Clustering. Genome 559: Introduction to Statistical and Computational Genomics Elhanan Borenstein. Some slides adapted from Jacques van Helden
|
|
|
- Terence Hill
- 5 years ago
- Views:
Transcription
1 Clustering Genome 559: Introduction to Statistical and Computational Genomics Elhanan Borenstein Some slides adapted from Jacques van Helden


2 Gene expression profiling A quick review Which molecular processes/functions are involved in a certain phenotype (e.g., disease, stress response, etc.) The Gene Ontology (GO) Project Provides shared vocabulary/annotation GO terms are linked in a complex structure Enrichment analysis: Find the most differentially expressed genes Identify functional annotations that are over-represented Modified Fisher's exact test

 for each functional category 2.")
3 Gene Set Enrichment Analysis Calculates a score for the enrichment of a entire set of genes Does not require setting a cutoff! Identifies the set of relevant genes! Provides a more robust statistical framework! GSEA steps: A quick review cont 1. Calculation of an enrichment score (ES) for each functional category 2. Estimation of significance level 3. Adjustment for multiple hypotheses testing
4 The clustering problem The goal of gene clustering process is to partition the genes into distinct sets such that genes that are assigned to the same cluster are similar, while genes assigned to different clusters are nonsimilar. gene x gene y

5 What are we clustering? We can cluster genes, conditions (samples), or both.
6 Why clustering
7 Clustering genes or conditions is a basic tool for the analysis of expression profiles, and can be useful for many purposes, including: Inferring functions of unknown genes (assuming a similar expression pattern implies a similar function). Identifying disease profiles (tissues with similar pathology should yield similar expression profiles). Deciphering regulatory mechanisms: co-expression of genes may imply co-regulation. Reducing dimensionality. Why clustering
8 Different views of clustering
9 Different views of clustering
10 Different views of clustering
11 Different views of clustering
12 Different views of clustering
13 Different views of clustering
14 Measuring similarity/distance An important step in many clustering methods is the selection of a distance measure (metric), defining the distance between 2 data points (e.g., 2 genes) Point 1 : [ ] Point 2 : [ ] Genes are points in the multi-dimensional space R n (where n denotes the number of conditions)
15 Measuring similarity/distance So how do we measure the distance between two point in a multi-dimensional space? B A
. The Manhattan distance (a.k.a taxicab distance) The maximum norm (a.k.a infinity distance) p-norm 2-norm 1-norm infinity-norm The Hamming distance (number of substitutions required to change one point into another).")
16 Symmetric vs. asymmetric distances. Measuring similarity/distance So how do we measure the distance between two point in a multi-dimensional space? Common distance functions: The Euclidean distance (a.k.a distance as the crow flies or distance). The Manhattan distance (a.k.a taxicab distance) The maximum norm (a.k.a infinity distance) p-norm 2-norm 1-norm infinity-norm The Hamming distance (number of substitutions required to change one point into another).
17 Correlation as distance Another approach is to use the correlation between two data points as a distance metric. Pearson Correlation Spearman Correlation Absolute Value of Correlation
18 Metric matters! The metric of choice has a marked impact on the shape of the resulting clusters: Some elements may be close to one another in one metric and far from one anther in a different metric. Consider, for example, the point (x=1,y=1) and the origin. What s their distance using the 2-norm (Euclidean distance )? What s their distance using the 1-norm (a.k.a. taxicab/ Manhattan norm)? What s their distance using the infinity-norm?
19 The clustering problem A good clustering solution should have two features: 1. High homogeneity: homogeneity measures the similarity between genes assigned to the same cluster. 2. High separation: separation measures the distance/dissimilarity between clusters. (If two clusters have similar expression patterns, then they should probably be merged into one cluster).
20 The philosophy of clustering Unsupervised learning problem No single solution is necessarily the true/correct! There is usually a tradeoff between homogeneity and separation: More clusters increased homogeneity but decreased separation Less clusters Increased separation but reduced homogeneity Method matters; metric matters; definitions matter; There are many formulations of the clustering problem; most of them are NP-hard (why?). In most cases, heuristic methods or approximations are used.
21 One problem, numerous solutions Many algorithms: Hierarchical clustering k-means self-organizing maps (SOM) Knn PCC CAST CLICK The results (i.e., obtained clusters) can vary drastically depending on: Clustering method Parameters specific to each clustering method (e.g. number of centers for the k-mean method, agglomeration rule for hierarchical clustering, etc.)
22 Hierarchical clustering
23 object 1 object 2 object 3 object 4 object 5 Hierarchical clustering Hierarchical clustering is an agglomerative clustering method Takes as input a distance matrix Progressively regroups the closest objects/groups Tree representation Distance matrix branch node c3 c1 object 1 object 5 object object object object object root c4 c2 object 4 object 2 object 3 leaf nodes
24 mmm Déjà vu anyone?
25 Hierarchical clustering algorithm 1. Assign each object to a separate cluster. 2. Find the pair of clusters with the shortest distance, and regroup them into a single cluster. 3. Repeat 2 until there is a single cluster. The result is a tree, whose intermediate nodes represent clusters Branch lengths represent distances between clusters
26 Hierarchical clustering result Five clusters 26
27 Hierarchical clustering 1. Assign each object to a separate cluster. 2. Find the pair of clusters with the shortest distance, and regroup them into a single cluster. 3. Repeat 2 until there is a single cluster. One needs to define a (dis)similarity metric between two groups. There are several possibilities Average linkage: the average distance between objects from groups A and B Single linkage: the distance between the closest objects from groups A and B Complete linkage: the distance between the most distant objects from groups A and B

28 Impact of the agglomeration rule These four trees were built from the same distance matrix, using 4 different agglomeration rules. Single-linkage typically creates nesting clusters Complete linkage create more balanced trees. Note: these trees were computed from a matrix of random numbers. The impression of structure is thus a complete artifact.

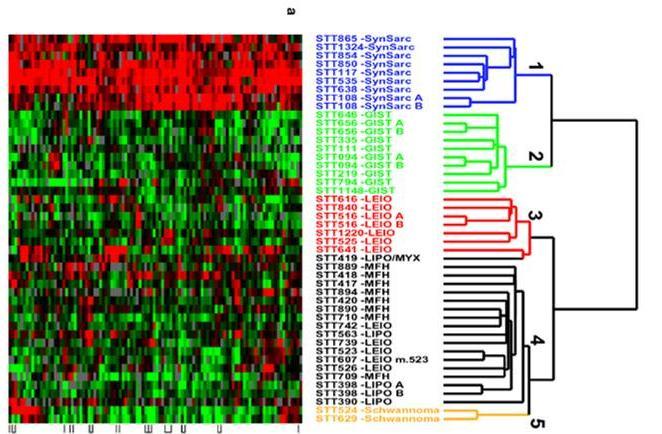
29 Clustering in both dimensions
30
Clustering. Genome 559: Introduction to Statistical and Computational Genomics Elhanan Borenstein. Some slides adapted from Jacques van Helden
 Clustering Genome 559: Introduction to Statistical and Computational Genomics Elhanan Borenstein Some slides adapted from Jacques van Helden Gene expression profiling A quick review Which molecular processes/functions
Clustering. Genome 559: Introduction to Statistical and Computational Genomics Elhanan Borenstein. Some slides adapted from Jacques van Helden
 Clustering Genome 559: Introduction to Statistical and Computational Genomics Elhanan Borenstein Some slides adapted from Jacques van Helden Small vs. large parsimony A quick review Fitch s algorithm:
Clustering. Genome 373 Genomic Informatics Elhanan Borenstein. Some slides adapted from Jacques van Helden
 Clustering Genome 373 Genomic Informatics Elhanan Borenstein Some slides adapted from Jacques van Helden The clustering problem The goal of gene clustering process is to partition the genes into distinct
Gene Ontology and Functional Enrichment. Genome 559: Introduction to Statistical and Computational Genomics Elhanan Borenstein
 Gene Ontology and Functional Enrichment Genome 559: Introduction to Statistical and Computational Genomics Elhanan Borenstein The parsimony principle: A quick review Find the tree that requires the fewest
Clustering and Network
 Clustering and Network Jing-Dong Jackie Han jdhan@picb.ac.cn http://www.picb.ac.cn/~jdhan Copy Right: Jing-Dong Jackie Han What is clustering? A way of grouping together data samples that are similar in
Clustering. Stephen Scott. CSCE 478/878 Lecture 8: Clustering. Stephen Scott. Introduction. Outline. Clustering.
 1 / 19 sscott@cse.unl.edu x1 If no label information is available, can still perform unsupervised learning Looking for structural information about instance space instead of label prediction function Approaches:
Unsupervised machine learning
 Chapter 9 Unsupervised machine learning Unsupervised machine learning (a.k.a. cluster analysis) is a set of methods to assign objects into clusters under a predefined distance measure when class labels
University of Florida CISE department Gator Engineering. Clustering Part 1
 Clustering Part 1 Dr. Sanjay Ranka Professor Computer and Information Science and Engineering University of Florida, Gainesville What is Cluster Analysis? Finding groups of objects such that the objects
6.047 / Computational Biology: Genomes, Networks, Evolution Fall 2008
 MIT OpenCourseWare http://ocw.mit.edu 6.047 / 6.878 Computational Biology: Genomes, Networks, Evolution Fall 2008 For information about citing these materials or our Terms of Use, visit: http://ocw.mit.edu/terms.
Clustering & microarray technology
 Clustering & microarray technology A large scale way to measure gene expression levels. Thanks to Kevin Wayne, Matt Hibbs, & SMD for a few of the slides 1 Why is expression important? Proteins Gene Expression
Overview of clustering analysis. Yuehua Cui
 Overview of clustering analysis Yuehua Cui Email: cuiy@msu.edu http://www.stt.msu.edu/~cui A data set with clear cluster structure How would you design an algorithm for finding the three clusters in this
Chapter 5: Microarray Techniques
 Chapter 5: Microarray Techniques 5.2 Analysis of Microarray Data Prof. Yechiam Yemini (YY) Computer Science Department Columbia University Normalization Clustering Overview 2 1 Processing Microarray Data
Introduction to Bioinformatics
 CSCI8980: Applied Machine Learning in Computational Biology Introduction to Bioinformatics Rui Kuang Department of Computer Science and Engineering University of Minnesota kuang@cs.umn.edu History of Bioinformatics
Applying cluster analysis to 2011 Census local authority data
 Applying cluster analysis to 2011 Census local authority data Kitty.Lymperopoulou@manchester.ac.uk SPSS User Group Conference November, 10 2017 Outline Basic ideas of cluster analysis How to choose variables
Data Preprocessing. Cluster Similarity
 1 Cluster Similarity Similarity is most often measured with the help of a distance function. The smaller the distance, the more similar the data objects (points). A function d: M M R is a distance on M
Multivariate Analysis Cluster Analysis
 Multivariate Analysis Cluster Analysis Prof. Dr. Anselmo E de Oliveira anselmo.quimica.ufg.br anselmo.disciplinas@gmail.com Cluster Analysis System Samples Measurements Similarities Distances Clusters
Principles of Pattern Recognition. C. A. Murthy Machine Intelligence Unit Indian Statistical Institute Kolkata
 Principles of Pattern Recognition C. A. Murthy Machine Intelligence Unit Indian Statistical Institute Kolkata e-mail: murthy@isical.ac.in Pattern Recognition Measurement Space > Feature Space >Decision
Computer Vision Group Prof. Daniel Cremers. 14. Clustering
 Group Prof. Daniel Cremers 14. Clustering Motivation Supervised learning is good for interaction with humans, but labels from a supervisor are hard to obtain Clustering is unsupervised learning, i.e. it
Clustering. CSL465/603 - Fall 2016 Narayanan C Krishnan
 Clustering CSL465/603 - Fall 2016 Narayanan C Krishnan ckn@iitrpr.ac.in Supervised vs Unsupervised Learning Supervised learning Given x ", y " "%& ', learn a function f: X Y Categorical output classification
A general co-expression network-based approach to gene expression analysis: comparison and applications
 BMC Systems Biology This Provisional PDF corresponds to the article as it appeared upon acceptance. Fully formatted PDF and full text (HTML) versions will be made available soon. A general co-expression
Clustering and classification with applications to microarrays and cellular phenotypes
 Clustering and classification with applications to microarrays and cellular phenotypes Gregoire Pau, EMBL Heidelberg gregoire.pau@embl.de European Molecular Biology Laboratory 1 Microarray data patients
Inferring Transcriptional Regulatory Networks from High-throughput Data
 Inferring Transcriptional Regulatory Networks from High-throughput Data Lectures 9 Oct 26, 2011 CSE 527 Computational Biology, Fall 2011 Instructor: Su-In Lee TA: Christopher Miles Monday & Wednesday 12:00-1:20
Contingency Table Analysis via Matrix Factorization
 Contingency Table Analysis via Matrix Factorization Kumer Pial Das 1, Jay Powell 2, Myron Katzoff 3, S. Stanley Young 4 1 Department of Mathematics,Lamar University, TX 2 Better Schooling Systems, Pittsburgh,
Comparative Network Analysis
 Comparative Network Analysis BMI/CS 776 www.biostat.wisc.edu/bmi776/ Spring 2016 Anthony Gitter gitter@biostat.wisc.edu These slides, excluding third-party material, are licensed under CC BY-NC 4.0 by
Hierarchical Clustering
 Hierarchical Clustering Some slides by Serafim Batzoglou 1 From expression profiles to distances From the Raw Data matrix we compute the similarity matrix S. S ij reflects the similarity of the expression
Advanced Statistical Methods: Beyond Linear Regression
 Advanced Statistical Methods: Beyond Linear Regression John R. Stevens Utah State University Notes 3. Statistical Methods II Mathematics Educators Worshop 28 March 2009 1 http://www.stat.usu.edu/~jrstevens/pcmi
Chapter 16. Clustering Biological Data. Chandan K. Reddy Wayne State University Detroit, MI
 Chapter 16 Clustering Biological Data Chandan K. Reddy Wayne State University Detroit, MI reddy@cs.wayne.edu Mohammad Al Hasan Indiana University - Purdue University Indianapolis, IN alhasan@cs.iupui.edu
Descriptive Data Summarization
 Descriptive Data Summarization Descriptive data summarization gives the general characteristics of the data and identify the presence of noise or outliers, which is useful for successful data cleaning
Zhongyi Xiao. Correlation. In probability theory and statistics, correlation indicates the
 Character Correlation Zhongyi Xiao Correlation In probability theory and statistics, correlation indicates the strength and direction of a linear relationship between two random variables. In general statistical
Introduction to clustering methods for gene expression data analysis
 Introduction to clustering methods for gene expression data analysis Giorgio Valentini e-mail: valentini@dsi.unimi.it Outline Levels of analysis of DNA microarray data Clustering methods for functional
2. Sample representativeness. That means some type of probability/random sampling.
 1 Neuendorf Cluster Analysis Assumes: 1. Actually, any level of measurement (nominal, ordinal, interval/ratio) is accetable for certain tyes of clustering. The tyical methods, though, require metric (I/R)
CS249: ADVANCED DATA MINING
 CS249: ADVANCED DATA MINING Clustering Evaluation and Practical Issues Instructor: Yizhou Sun yzsun@cs.ucla.edu May 2, 2017 Announcements Homework 2 due later today Due May 3 rd (11:59pm) Course project
Weighted gene co-expression analysis. Yuehua Cui June 7, 2013
 Weighted gene co-expression analysis Yuehua Cui June 7, 2013 Weighted gene co-expression network (WGCNA) A type of scale-free network: A scale-free network is a network whose degree distribution follows
STATS 306B: Unsupervised Learning Spring Lecture 5 April 14
 STATS 306B: Unsupervised Learning Spring 2014 Lecture 5 April 14 Lecturer: Lester Mackey Scribe: Brian Do and Robin Jia 5.1 Discrete Hidden Markov Models 5.1.1 Recap In the last lecture, we introduced
Cluster Analysis (Sect. 9.6/Chap. 14 of Wilks) Notes by Hong Li
 Notes by Hong Li") 77 Cluster Analysis (Sect. 9.6/Chap. 14 of Wilks) Notes by Hong Li 1) Introduction Cluster analysis deals with separating data into groups whose identities are not known in advance. In general, even the
77 Cluster Analysis (Sect. 9.6/Chap. 14 of Wilks) Notes by Hong Li 1) Introduction Cluster analysis deals with separating data into groups whose identities are not known in advance. In general, even the
Evolutionary Tree Analysis. Overview
 CSI/BINF 5330 Evolutionary Tree Analysis Young-Rae Cho Associate Professor Department of Computer Science Baylor University Overview Backgrounds Distance-Based Evolutionary Tree Reconstruction Character-Based
Hierarchical Clustering
 Hierarchical Clustering Example for merging hierarchically Merging Apples Merging Oranges Merging Strawberries All together Hierarchical Clustering In hierarchical clustering the data are not partitioned
Multivariate Statistics: Hierarchical and k-means cluster analysis
 Multivariate Statistics: Hierarchical and k-means cluster analysis Steffen Unkel Department of Medical Statistics University Medical Center Goettingen, Germany Summer term 217 1/43 What is a cluster? Proximity
High-dimensional data: Exploratory data analysis
 High-dimensional data: Exploratory data analysis Mark van de Wiel mark.vdwiel@vumc.nl Department of Epidemiology and Biostatistics, VUmc & Department of Mathematics, VU University Contributions by Wessel
Approaches to clustering gene expression time course data
 Approaches to clustering gene expression time course data by Praveen Krishnamurthy August, 2006 A thesis submitted to The Faculty of the Graduate School of The State University of New York at Buffalo in
Modern Information Retrieval
 Modern Information Retrieval Chapter 8 Text Classification Introduction A Characterization of Text Classification Unsupervised Algorithms Supervised Algorithms Feature Selection or Dimensionality Reduction
Clustering using Mixture Models
 Clustering using Mixture Models The full posterior of the Gaussian Mixture Model is p(x, Z, µ,, ) =p(x Z, µ, )p(z )p( )p(µ, ) data likelihood (Gaussian) correspondence prob. (Multinomial) mixture prior
Data Exploration and Unsupervised Learning with Clustering
 Data Exploration and Unsupervised Learning with Clustering Paul F Rodriguez,PhD San Diego Supercomputer Center Predictive Analytic Center of Excellence Clustering Idea Given a set of data can we find a
Data Mining: Data. Lecture Notes for Chapter 2. Introduction to Data Mining
 Data Mining: Data Lecture Notes for Chapter 2 Introduction to Data Mining by Tan, Steinbach, Kumar Similarity and Dissimilarity Similarity Numerical measure of how alike two data objects are. Is higher
Phylogenetic Tree Reconstruction
 I519 Introduction to Bioinformatics, 2011 Phylogenetic Tree Reconstruction Yuzhen Ye (yye@indiana.edu) School of Informatics & Computing, IUB Evolution theory Speciation Evolution of new organisms is driven
Logic and machine learning review. CS 540 Yingyu Liang
 Logic and machine learning review CS 540 Yingyu Liang Propositional logic Logic If the rules of the world are presented formally, then a decision maker can use logical reasoning to make rational decisions.
10-810: Advanced Algorithms and Models for Computational Biology. Optimal leaf ordering and classification
 10-810: Advanced Algorithms and Models for Computational Biology Optimal leaf ordering and classification Hierarchical clustering As we mentioned, its one of the most popular methods for clustering gene
Introduction to clustering methods for gene expression data analysis
 Introduction to clustering methods for gene expression data analysis Giorgio Valentini e-mail: valentini@dsi.unimi.it Outline Levels of analysis of DNA microarray data Clustering methods for functional
Network Motifs of Pathogenic Genes in Human Regulatory Network
 Network Motifs of Pathogenic Genes in Human Regulatory Network Michael Colavita Mentor: Soheil Feizi Fourth Annual MIT PRIMES Conference May 18, 2014 Topics Background Genetics Regulatory Networks The
Distances and similarities Based in part on slides from textbook, slides of Susan Holmes. October 3, Statistics 202: Data Mining
 Distances and similarities Based in part on slides from textbook, slides of Susan Holmes October 3, 2012 1 / 1 Similarities Start with X which we assume is centered and standardized. The PCA loadings were
9/30/11. Evolution theory. Phylogenetic Tree Reconstruction. Phylogenetic trees (binary trees) Phylogeny (phylogenetic tree)
 Phylogeny (phylogenetic tree)") I9 Introduction to Bioinformatics, 0 Phylogenetic ree Reconstruction Yuzhen Ye (yye@indiana.edu) School of Informatics & omputing, IUB Evolution theory Speciation Evolution of new organisms is driven by
I9 Introduction to Bioinformatics, 0 Phylogenetic ree Reconstruction Yuzhen Ye (yye@indiana.edu) School of Informatics & omputing, IUB Evolution theory Speciation Evolution of new organisms is driven by
A PARSIMONY APPROACH TO ANALYSIS OF HUMAN SEGMENTAL DUPLICATIONS
 A PARSIMONY APPROACH TO ANALYSIS OF HUMAN SEGMENTAL DUPLICATIONS CRYSTAL L. KAHN and BENJAMIN J. RAPHAEL Box 1910, Brown University Department of Computer Science & Center for Computational Molecular Biology
Math 8803/4803, Spring 2008: Discrete Mathematical Biology
 Math 8803/4803, Spring 2008: Discrete Mathematical Biology Prof. hristine Heitsch School of Mathematics eorgia Institute of Technology Lecture 12 February 4, 2008 Levels of RN structure Selective base
Microarray data analysis
 Microarray data analysis September 20, 2006 Jonathan Pevsner, Ph.D. Introduction to Bioinformatics pevsner@kennedykrieger.org Johns Hopkins School of Public Health (260.602.01) Copyright notice Many of
Machine Learning. Clustering 1. Hamid Beigy. Sharif University of Technology. Fall 1395
 Machine Learning Clustering 1 Hamid Beigy Sharif University of Technology Fall 1395 1 Some slides are taken from P. Rai slides Hamid Beigy (Sharif University of Technology) Machine Learning Fall 1395 1
Diffusion/Inference geometries of data features, situational awareness and visualization. Ronald R Coifman Mathematics Yale University
 Diffusion/Inference geometries of data features, situational awareness and visualization Ronald R Coifman Mathematics Yale University Digital data is generally converted to point clouds in high dimensional
CREATING PHYLOGENETIC TREES FROM DNA SEQUENCES
 INTRODUCTION CREATING PHYLOGENETIC TREES FROM DNA SEQUENCES This worksheet complements the Click and Learn developed in conjunction with the 2011 Holiday Lectures on Science, Bones, Stones, and Genes:
Statistical Significance for Hierarchical Clustering
 Statistical Significance for Hierarchical Clustering arxiv:1411.5259v1 [stat.me] 19 Nov 2014 Patrick K. Kimes 1 Yufeng Liu 1,2,3 D. Neil Hayes 4 J. S. Marron 1,2 Abstract: Cluster analysis has proved to
Lecture 5: November 19, Minimizing the maximum intracluster distance
 Analysis of DNA Chips and Gene Networks Spring Semester, 2009 Lecture 5: November 19, 2009 Lecturer: Ron Shamir Scribe: Renana Meller 5.1 Minimizing the maximum intracluster distance 5.1.1 Introduction
Cluster Analysis of Gene Expression Microarray Data. BIOL 495S/ CS 490B/ MATH 490B/ STAT 490B Introduction to Bioinformatics April 8, 2002
 Cluster Analysis of Gene Expression Microarray Data BIOL 495S/ CS 490B/ MATH 490B/ STAT 490B Introduction to Bioinformatics April 8, 2002 1 Data representations Data are relative measurements log 2 ( red
Multimedia Retrieval Distance. Egon L. van den Broek
 Multimedia Retrieval 2018-1019 Distance Egon L. van den Broek 1 The project: Two perspectives Man Machine or? Objective Subjective 2 The default Default: distance = Euclidean distance This is how it is
Package GeneExpressionSignature
 Package GeneExpressionSignature September 6, 2018 Title Gene Expression Signature based Similarity Metric Version 1.26.0 Date 2012-10-24 Author Yang Cao Maintainer Yang Cao , Fei
Using Phylogenomics to Predict Novel Fungal Pathogenicity Genes
 Using Phylogenomics to Predict Novel Fungal Pathogenicity Genes David DeCaprio, Ying Li, Hung Nguyen (sequenced Ascomycetes genomes courtesy of the Broad Institute) Phylogenomics Combining whole genome
Decision Trees. Lewis Fishgold. (Material in these slides adapted from Ray Mooney's slides on Decision Trees)
") Decision Trees Lewis Fishgold (Material in these slides adapted from Ray Mooney's slides on Decision Trees) Classification using Decision Trees Nodes test features, there is one branch for each value of
Decision Trees Lewis Fishgold (Material in these slides adapted from Ray Mooney's slides on Decision Trees) Classification using Decision Trees Nodes test features, there is one branch for each value of
Geometric View of Machine Learning Nearest Neighbor Classification. Slides adapted from Prof. Carpuat
 Geometric View of Machine Learning Nearest Neighbor Classification Slides adapted from Prof. Carpuat What we know so far Decision Trees What is a decision tree, and how to induce it from data Fundamental
Zhiguang Huo 1, Chi Song 2, George Tseng 3. July 30, 2018
 Bayesian latent hierarchical model for transcriptomic meta-analysis to detect biomarkers with clustered meta-patterns of differential expression signals BayesMP Zhiguang Huo 1, Chi Song 2, George Tseng
Discovering molecular pathways from protein interaction and ge
 Discovering molecular pathways from protein interaction and gene expression data 9-4-2008 Aim To have a mechanism for inferring pathways from gene expression and protein interaction data. Motivation Why
Biological Networks Analysis
 Biological Networks Analysis Degree Distribution and Network Motifs Genome 559: Introduction to Statistical and Computational Genomics Elhanan Borenstein Networks: Networks vs. graphs A collection of nodesand
Co-expression analysis of RNA-seq data
 Co-expression analysis of RNA-seq data Etienne Delannoy & Marie-Laure Martin-Magniette & Andrea Rau Plant Science Institut of Paris-Saclay (IPS2) Applied Mathematics and Informatics Unit (MIA-Paris) Genetique
Protein function prediction via analysis of interactomes
 Protein function prediction via analysis of interactomes Elena Nabieva Mona Singh Department of Computer Science & Lewis-Sigler Institute for Integrative Genomics January 22, 2008 1 Introduction Genome
Co-expression analysis
 Co-expression analysis Etienne Delannoy & Marie-Laure Martin-Magniette & Andrea Rau ED& MLMM& AR Co-expression analysis Ecole chercheur SPS 1 / 49 Outline 1 Introduction 2 Unsupervised clustering Distance-based
Clustering with k-means and Gaussian mixture distributions
 Clustering with k-means and Gaussian mixture distributions Machine Learning and Category Representation 2014-2015 Jakob Verbeek, ovember 21, 2014 Course website: http://lear.inrialpes.fr/~verbeek/mlcr.14.15
Clustering of Pathogenic Genes in Human Co-regulatory Network. Michael Colavita Mentor: Soheil Feizi Fifth Annual MIT PRIMES Conference May 17, 2015
 Clustering of Pathogenic Genes in Human Co-regulatory Network Michael Colavita Mentor: Soheil Feizi Fifth Annual MIT PRIMES Conference May 17, 2015 Topics Background Genetic Background Regulatory Networks
EVOLUTIONARY DISTANCES
 EVOLUTIONARY DISTANCES FROM STRINGS TO TREES Luca Bortolussi 1 1 Dipartimento di Matematica ed Informatica Università degli studi di Trieste luca@dmi.units.it Trieste, 14 th November 2007 OUTLINE 1 STRINGS:
Microarray Data Analysis: Discovery
 Microarray Data Analysis: Discovery Lecture 5 Classification Classification vs. Clustering Classification: Goal: Placing objects (e.g. genes) into meaningful classes Supervised Clustering: Goal: Discover
Evidence for dynamically organized modularity in the yeast protein-protein interaction network
 Evidence for dynamically organized modularity in the yeast protein-protein interaction network Sari Bombino Helsinki 27.3.2007 UNIVERSITY OF HELSINKI Department of Computer Science Seminar on Computational
A (short) introduction to phylogenetics
 introduction to phylogenetics") A (short) introduction to phylogenetics Thibaut Jombart, Marie-Pauline Beugin MRC Centre for Outbreak Analysis and Modelling Imperial College London Genetic data analysis with PR Statistics, Millport Field
A (short) introduction to phylogenetics Thibaut Jombart, Marie-Pauline Beugin MRC Centre for Outbreak Analysis and Modelling Imperial College London Genetic data analysis with PR Statistics, Millport Field
A transcriptome meta-analysis identifies the response of plant to stresses. Etienne Delannoy, Rim Zaag, Guillem Rigaill, Marie-Laure Martin-Magniette
 A transcriptome meta-analysis identifies the response of plant to es Etienne Delannoy, Rim Zaag, Guillem Rigaill, Marie-Laure Martin-Magniette Biological context Multiple biotic and abiotic es impacting
Statistics 202: Data Mining. c Jonathan Taylor. Model-based clustering Based in part on slides from textbook, slides of Susan Holmes.
 Model-based clustering Based in part on slides from textbook, slides of Susan Holmes December 2, 2012 1 / 1 Model-based clustering General approach Choose a type of mixture model (e.g. multivariate Normal)
Inferring Transcriptional Regulatory Networks from Gene Expression Data II
 Inferring Transcriptional Regulatory Networks from Gene Expression Data II Lectures 9 Oct 26, 2011 CSE 527 Computational Biology, Fall 2011 Instructor: Su-In Lee TA: Christopher Miles Monday & Wednesday
A* Search. 1 Dijkstra Shortest Path
 A* Search Consider the eight puzzle. There are eight tiles numbered 1 through 8 on a 3 by three grid with nine locations so that one location is left empty. We can move by sliding a tile adjacent to the
STATISTICA MULTIVARIATA 2
 1 / 73 STATISTICA MULTIVARIATA 2 Fabio Rapallo Dipartimento di Scienze e Innovazione Tecnologica Università del Piemonte Orientale, Alessandria (Italy) fabio.rapallo@uniupo.it Alessandria, May 2016 2 /
Multivariate Analysis
 Multivariate Analysis Chapter 5: Cluster analysis Pedro Galeano Departamento de Estadística Universidad Carlos III de Madrid pedro.galeano@uc3m.es Course 2015/2016 Master in Business Administration and
Machine Learning - MT Clustering
 Machine Learning - MT 2016 15. Clustering Varun Kanade University of Oxford November 28, 2016 Announcements No new practical this week All practicals must be signed off in sessions this week Firm Deadline:
Classification for High Dimensional Problems Using Bayesian Neural Networks and Dirichlet Diffusion Trees
 Classification for High Dimensional Problems Using Bayesian Neural Networks and Dirichlet Diffusion Trees Rafdord M. Neal and Jianguo Zhang Presented by Jiwen Li Feb 2, 2006 Outline Bayesian view of feature
k-means clustering mark = which(md == min(md)) nearest[i] = ifelse(mark <= 5, "blue", "orange")}
![k-means clustering mark = which(md == min(md)) nearest[i] = ifelse(mark <= 5, blue, orange)}](/thumbs/90/102448140.jpg "k-means clustering mark = which(md == min(md)) nearest[i] = ifelse(mark <= 5, blue, orange)}") 1 / 16 k-means clustering km15 = kmeans(x[g==0,],5) km25 = kmeans(x[g==1,],5) for(i in 1:6831){ md = c(mydist(xnew[i,],km15$center[1,]),mydist(xnew[i,],km15$center[2, mydist(xnew[i,],km15$center[3,]),mydist(xnew[i,],km15$center[4,]),
1 / 16 k-means clustering km15 = kmeans(x[g==0,],5) km25 = kmeans(x[g==1,],5) for(i in 1:6831){ md = c(mydist(xnew[i,],km15$center[1,]),mydist(xnew[i,],km15$center[2, mydist(xnew[i,],km15$center[3,]),mydist(xnew[i,],km15$center[4,]),
ICS 252 Introduction to Computer Design
 ICS 252 fall 2006 Eli Bozorgzadeh Computer Science Department-UCI References and Copyright Textbooks referred [Mic94] G. De Micheli Synthesis and Optimization of Digital Circuits McGraw-Hill, 1994. [CLR90]
2. Sample representativeness. That means some type of probability/random sampling.
 1 Neuendorf Cluster Analysis Model: X1 X2 X3 X4 X5 Clusters (Nominal variable) Y1 Y2 Y3 Clustering/Internal Variables External Variables Assumes: 1. Actually, any level of measurement (nominal, ordinal,
Clustering Perturbation Resilient
 Clustering Perturbation Resilient Instances Maria-Florina Balcan Carnegie Mellon University Clustering Comes Up Everywhere Clustering news articles or web pages or search results by topic. Clustering protein
Lecture 5: Clustering, Linear Regression
 Lecture 5: Clustering, Linear Regression Reading: Chapter 10, Sections 3.1-3.2 STATS 202: Data mining and analysis October 4, 2017 1 / 22 .0.0 5 5 1.0 7 5 X2 X2 7 1.5 1.0 0.5 3 1 2 Hierarchical clustering
Similarity Numerical measure of how alike two data objects are Value is higher when objects are more alike Often falls in the range [0,1]
![Similarity Numerical measure of how alike two data objects are Value is higher when objects are more alike Often falls in the range [0,1]](/thumbs/75/71992592.jpg "Similarity Numerical measure of how alike two data objects are Value is higher when objects are more alike Often falls in the range [0,1]") Similarity and Dissimilarity Similarity Numerical measure of how alike two data objects are Value is higher when objects are more alike Often falls in the range [0,1] Dissimilarity (e.g., distance) Numerical
Similarity and Dissimilarity Similarity Numerical measure of how alike two data objects are Value is higher when objects are more alike Often falls in the range [0,1] Dissimilarity (e.g., distance) Numerical
Biochip informatics-(i)
") Biochip informatics-(i) : biochip normalization & differential expression Ju Han Kim, M.D., Ph.D. SNUBI: SNUBiomedical Informatics http://www.snubi snubi.org/ Biochip Informatics - (I) Biochip basics Preprocessing
Biochip informatics-(i) : biochip normalization & differential expression Ju Han Kim, M.D., Ph.D. SNUBI: SNUBiomedical Informatics http://www.snubi snubi.org/ Biochip Informatics - (I) Biochip basics Preprocessing
Supplementary Information
 Supplementary Information For the article"comparable system-level organization of Archaea and ukaryotes" by J. Podani, Z. N. Oltvai, H. Jeong, B. Tombor, A.-L. Barabási, and. Szathmáry (reference numbers
Lecture 5: Clustering, Linear Regression
 Lecture 5: Clustering, Linear Regression Reading: Chapter 10, Sections 3.1-3.2 STATS 202: Data mining and analysis October 4, 2017 1 / 22 Hierarchical clustering Most algorithms for hierarchical clustering
Distances & Similarities
 Introduction to Data Mining Distances & Similarities CPSC/AMTH 445a/545a Guy Wolf guy.wolf@yale.edu Yale University Fall 2016 CPSC 445 (Guy Wolf) Distances & Similarities Yale - Fall 2016 1 / 22 Outline
Comparative Genomics II
 Comparative Genomics II Advances in Bioinformatics and Genomics GEN 240B Jason Stajich May 19 Comparative Genomics II Slide 1/31 Outline Introduction Gene Families Pairwise Methods Phylogenetic Methods
Clustering with k-means and Gaussian mixture distributions
 Clustering with k-means and Gaussian mixture distributions Machine Learning and Category Representation 2012-2013 Jakob Verbeek, ovember 23, 2012 Course website: http://lear.inrialpes.fr/~verbeek/mlcr.12.13
Page 1. Evolutionary Trees. Why build evolutionary tree? Outline
 Page Evolutionary Trees Russ. ltman MI S 7 Outline. Why build evolutionary trees?. istance-based vs. character-based methods. istance-based: Ultrametric Trees dditive Trees. haracter-based: Perfect phylogeny
7.2 One-Sample Correlation ( = a) Introduction. Correlation analysis measures the strength and direction of association between
 Introduction. Correlation analysis measures the strength and direction of association between") 7.2 One-Sample Correlation ( = a) Introduction Correlation analysis measures the strength and direction of association between variables. In this chapter we will test whether the population correlation
7.2 One-Sample Correlation ( = a) Introduction Correlation analysis measures the strength and direction of association between variables. In this chapter we will test whether the population correlation
Written Exam 15 December Course name: Introduction to Systems Biology Course no
 Technical University of Denmark Written Exam 15 December 2008 Course name: Introduction to Systems Biology Course no. 27041 Aids allowed: Open book exam Provide your answers and calculations on separate