Creating a Geodemographic Classification
|
|
|
- Rolf Maximillian Miles
- 5 years ago
- Views:
Transcription


1 Creating a Geodemographic Classification Dr Daniel Vickers Department of Geography, University of Sheffield D.Vickers@sheffield.ac.uk

2 Why classify areas? All the real knowledge which we possess depends on methods by which we distinguish the similar from the dissimilar. The greater number of natural distinctions this method comprehends the clearer becomes our idea of things. The more numerous the objects which employ our attention the more difficult it becomes to form such a method and the more necessary. (Linnæus 1737)


3 Why classify areas?
4 The Myths of Geodemographics The more data the better? The smaller the areas the more meaningful? These are distinct groups? A true depiction of reality?

5 The Objective of Creating OAC To provide a publicly accessible classification, free at the point of use for researchers, policy makers and the public, avoiding the expense of commercial classifications. To provide a transparent and replicable methodology with the input data as well as the classification output. To stimulate value added research either using the classification or the raw data.
6 The Seven Steps of Cluster Anlysis 1. Clustering elements (objects to cluster, also known as operational taxonomic units ) 2. Clustering variables (attributes of objects to be used) 3. Variable standardisation 4. Measure of association (proximity measure) 5. Clustering method 6. Number of clusters 7. Interpretation, testing and replication (adapted from Milligan 1996) Milligan, G. W. (1996) Clustering validation: Results and implications for applied analyses. in Arabie, P., Hubert, L. J. and De Soete, G. Eds., Clustering and Classification. Singapore: World Scientific.
7 What Goes into the Classification Output Areas are the smallest area for general census output. 223,060 in the UK England & Wales Number of OAs: 174,434 Min size: 40 households, 100 people Mean size: 124 households, 297 people Scotland Number of OAs: 42,604 Min size: 20 households, 50 people Mean size: 52 households, 119 people Northern Ireland Number of OAs: 5,022 Min size: 40 households, 100 people Mean size: 125 households, 336 people
8 How many data inputs are involved? 223,060 Output Areas, 41 Variables = 9,145,460 data points Creating a Geodemographic Classification 41 Census Variables covering: What Goes into the Classification Demographic attributes Including - age, ethnicity, country of birth and population density Household composition Including - living arrangements, family type and family size. Housing characteristics Including - tenure, type & size, and quality/overcrowding Socio-economic traits Including - education, socio-economic class, car ownership & commuting and health & care. Employment attributes Including - level of economic activity and employment class type.
9 Standardising the Variables Log Transformation Reduce the effect of extreme values Range Standardisation (0-1) Problems will occur if there are differing scales or magnitudes among the variables. In general, variables with larger values and greater variation will have more impact on the final similarity measure. It is necessary therefore to make each variable equally represented in the distance measure by standardising the data.
10 K-means clustering Clustering the Data K-means is an iterative relocation algorithm based on an error sum of squares measure. The basic operation of the algorithm is to move a case from one cluster to another to see if the move would improve the sum of squared deviations within each cluster (Aldenderfer and Blashfield, 1984). The case will then be assigned/re-allocated to the cluster to which it brings the greatest improvement. The next iteration occurs when all the cases have been processed. A stable classification is therefore reached when no moves occur during a complete iteration of the data. After clustering is complete, it is then possible to examine the means of each cluster for each dimension (variable) in order to assess the distinctiveness of the clusters (Everitt et al., 2001).
11 Issue 3: The number of clusters produced should be as close to the perceived ideal as possible. This means that the number of clusters needs to be of a size that is useful for further analysis. Creating a Geodemographic Classification Issues of Cluster Number Selection When choosing the number of clusters to have in the classification there were three main issues which need to be considered. Issue 1: Analysis of average distance from cluster centres for each cluster number option. The ideal solution would be the number of clusters which gives smallest average distance from the cluster centre across all clusters. Issue 2: Analysis of cluster size homogeneity for each cluster number option. It would be useful, where possible, to have clusters of as similar size as possible in terms of the number of members within each.
12 Average Distance from Cluster Centre Issues of Cluster Number Selection A three tier hierarchy 7, 21 & 52 clusters First Level target 6, K Aveerage Distance from Cluster Centre selected based on analysis of, average distance from cluster centre and size of each cluster. Second Level target 20, 21 selected based on analysis of, average distance from cluster centre and size of each cluster. Third Level target 50, 52 selected based on size of each cluster. Split into either 2 or 3 groups
13 Clustering: Using k-means to Create a Hierarchy First level run as standard k-means Second level, first level is split into separate files and each file is clustered separately Third level, second level is split into separate files and each file is clustered separately UK Database 223,060 OAs K-means algorithm SPSS, 7 Super Groups K-means algorithm SPSS, 3 Groups 5a 5b 5c K-means algorithm SPSS, 3 Sub Groups 5c1 5c2 5c3
14 1: BLUE COLLAR COMMUNITIES 2: CITY LIVING 3: COUNTRYSIDE Cluster Names 1a: Terraced Blue Collar 1b: Younger Blue Collar 1c: Older Blue Collar 2a: Transient Communities 2b: Settled in the City 3a: Village Life 3b: Agricultural 3c: Accessible Countryside 4a: Prospering Younger Families 4: PROSPERING SUBURBS 4b: Prospering Older Families 4c: Prospering Semis 4d: Thriving Suburbs 5: CONSTRAINED BY CIRCUMSTANCES 5a: Senior Communities 5b: Older Workers 5c: Public Housing 6a: Settled Households 6: TYPICAL TRAITS 6b: Least Divergent 6c: Young Families in Terraced Homes 6d: Aspiring Households 7: MULTICULTURAL 7a: Asian Communities 7b: Afro-Caribbean Communities
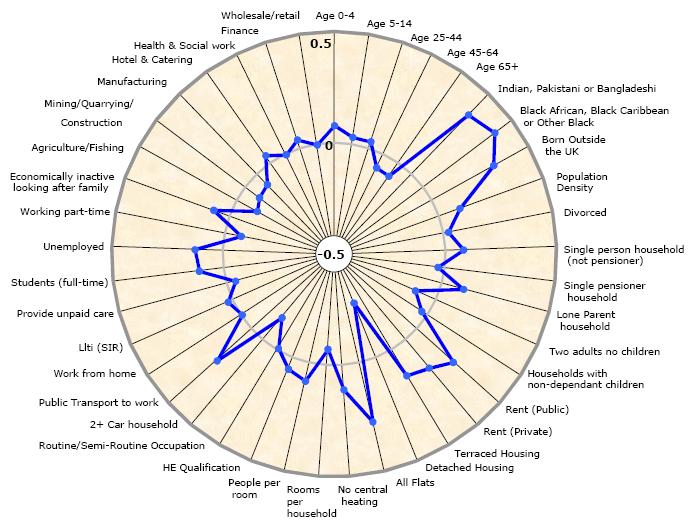
15 1: Blue Collar Communities Cluster Profiling

16 2: City Living Cluster Profiling

17 3: Countryside Cluster Profiling

18 4: Prospering Suburbs Cluster Profiling

19 5: Constrained by Circumstances Cluster Profiling
20 6: Typical Traits Cluster Profiling

21 7: Multicultural Cluster Profiling

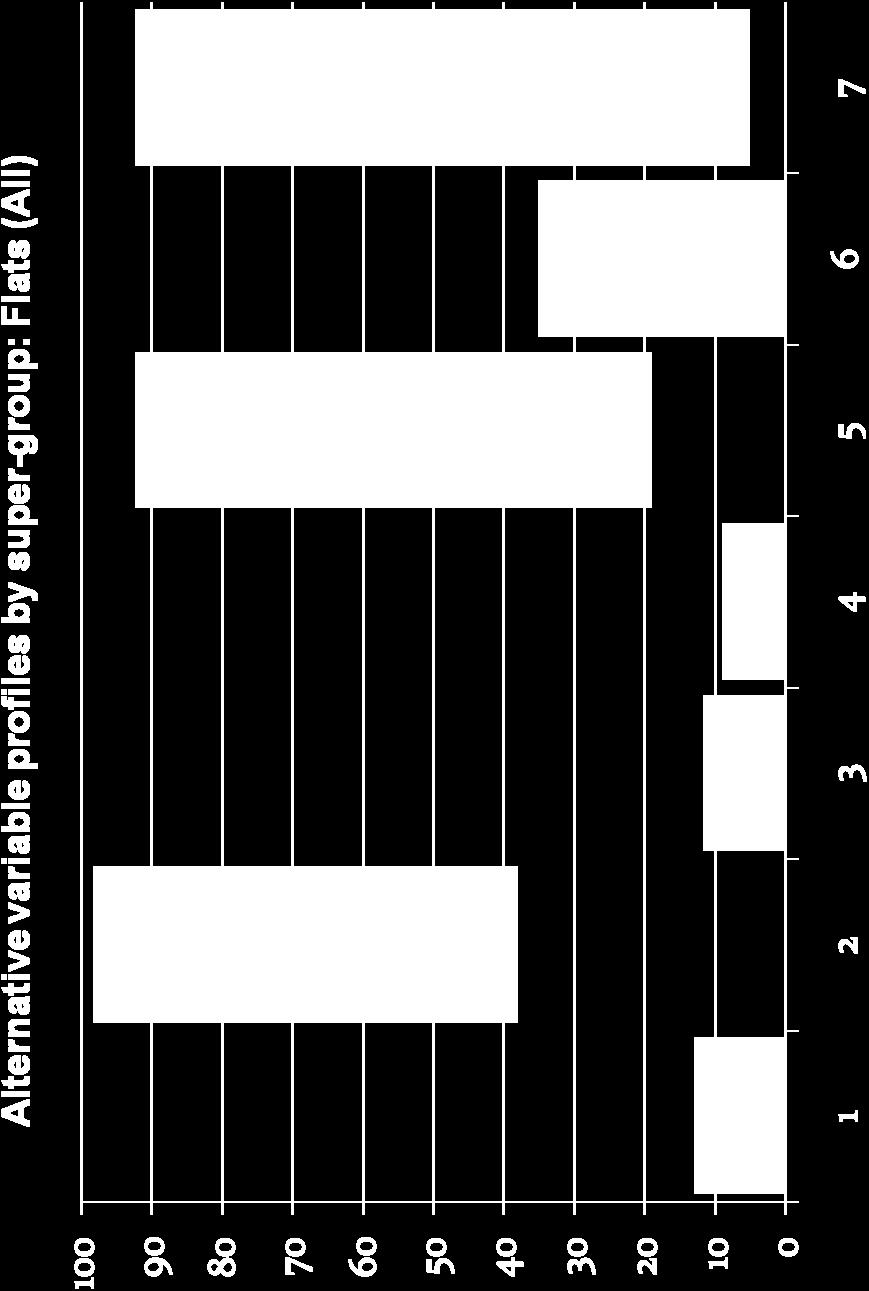
22 Cluster Profiling

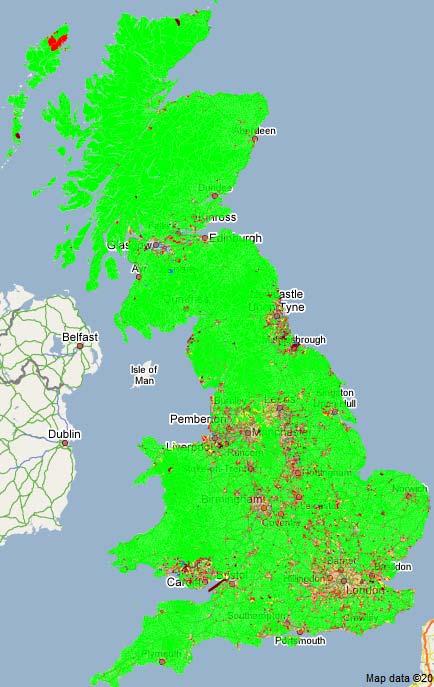
23 Mapping the Classification


24 Further Information For more information visit:
National Statistics 2001 Area Classifications
 National Statistics 2001 Area Classifications John Charlton, ONS see http://neighbourhood.statistics.gov.uk areaclassifications@ons.gov.uk Copyright ONS What are the Area Classifications Summarise 2001
The geography of domestic energy consumption
 The geography of domestic energy consumption Anastasia Ushakova PhD student at CDRC UCL Ellen Talbot PhD student at CDRC Liverpool Some important research questions How can we classify energy consumption
Visualisation of Uncertainty in a Geodemographic Classifier
 Visualisation of Uncertainty in a Geodemographic Classifier Aidan Slingsby 1, Nicholas J. Tate 2, and Peter F. Fisher 2 1 gicentre, Department of Computer Science, City University London, Northampton Square,
Applying cluster analysis to 2011 Census local authority data
 Applying cluster analysis to 2011 Census local authority data Kitty.Lymperopoulou@manchester.ac.uk SPSS User Group Conference November, 10 2017 Outline Basic ideas of cluster analysis How to choose variables
City, University of London Institutional Repository
 City Research Online City, University of London Institutional Repository Citation: Slingsby, A., Dykes, J. and Wood, J. (2010). Rectangular Hierarchical Cartograms for Socio-Economic Data. Journal of Maps,
Profiling Burglary in London using Geodemographics
 Profiling Burglary in London using Geodemographics C G Gale *1, A D Singleton 2 and P A Longley 3 1 UCL Department of Civil, Environmental & Geomatic Engineering 2 University of Liverpool Department of
Understanding Your Community A Guide to Data
 Understanding Your Community A Guide to Data Alex Lea September 2013 Research and Insight Team LeicestershireCounty Council Understanding Geographies Important to understand the various geographies that
AS Population Change Question spotting
 AS Change Question spotting Changing rate of growth How the rate of growth has changed over the last 100 years Explain the reasons for these changes Describe global or national distribution. Study the
Exploring the Geography of Access to Fixed Line Broadband Services in England using Crowd Sourced Speed Check Data
 Exploring the Geography of Access to Fixed Line Broadband Services in England using Crowd Sourced Speed Check Data Dean Riddlesden 1, Alex D. Singleton 2 1 Department of Geography and Planning, School
Understanding consumption in Melbourne s multicultural society
 Understanding consumption in Melbourne s multicultural society ECOCITY WORLD SUMMIT 12-14 JULY 2017 Dr. Christina YP Ting Prof. Peter Newton Asso. Prof. Wendy Stone Centre for Urban Transitions Swinburne
A Note on Methods. ARC Project DP The Demand for Higher Density Housing in Sydney and Melbourne Working Paper 3. City Futures Research Centre
 A Note on Methods ARC Project DP0773388 The Demand for Higher Density Housing in Sydney and Melbourne Working Paper 3 City Futures Research Centre February 2009 A NOTE ON METHODS Dr Raymond Bunker, Mr
Application Issues in GIS: the UCL Centre for Advanced Spatial Analysis. Paul Longley UCL
 Application Issues in GIS: the UCL Centre for Advanced Spatial Analysis Paul Longley UCL GIS: inclusive, shared understanding Geodemographics as a focus of interest Profiling public goods and services
Advances in Geographic Data Science and Urban Analytics
 Advances in Geographic Data Science and Urban Analytics Alex Singleton Professor of Geographic Information Science Department of Geography and Planning Consumer Data Research Centre www.cdrc.ac.uk www.geographicdatascience.com
Understanding China Census Data with GIS By Shuming Bao and Susan Haynie China Data Center, University of Michigan
 Understanding China Census Data with GIS By Shuming Bao and Susan Haynie China Data Center, University of Michigan The Census data for China provides comprehensive demographic and business information
Spatial Organization of Data and Data Extraction from Maptitude
 Spatial Organization of Data and Data Extraction from Maptitude N. P. Taliceo Geospatial Information Sciences The University of Texas at Dallas UT Dallas GIS Workshop Richardson, TX March 30 31, 2018 1/
Analysis of travel-to-work patterns and the identification and classification of REDZs
 Analysis of travel-to-work patterns and the identification and classification of REDZs Dr David Meredith, Teagasc, Spatial Analysis Unit, Rural Economy Development Programme, Ashtown, Dublin 15. david.meredith@teagasc.ie
HSC Geography. Year 2013 Mark Pages 10 Published Jul 4, Urban Dynamics. By James (97.9 ATAR)
") HSC Geography Year 2013 Mark 92.00 Pages 10 Published Jul 4, 2017 Urban Dynamics By James (97.9 ATAR) Powered by TCPDF (www.tcpdf.org) Your notes author, James. James achieved an ATAR of 97.9 in 2013 while
HSC Geography Year 2013 Mark 92.00 Pages 10 Published Jul 4, 2017 Urban Dynamics By James (97.9 ATAR) Powered by TCPDF (www.tcpdf.org) Your notes author, James. James achieved an ATAR of 97.9 in 2013 while
Spatial Trends of unpaid caregiving in Ireland
 Spatial Trends of unpaid caregiving in Ireland Stamatis Kalogirou 1,*, Ronan Foley 2 1. NCG Affiliate, Thoukididi 20, Drama, 66100, Greece; Tel: +30 6977 476776; Email: skalogirou@gmail.com; Web: http://www.gisc.gr.
Population health across space & time: geographical harmonisation of the ONS Longitudinal Study for England & Wales
 British Society for Population Studies Annual Conference, York, September 2011 Population health across space & time: geographical harmonisation of the ONS Longitudinal Study for England & Wales Paul Norman
What are we like? Population characteristics from UK censuses. Justin Hayes & Richard Wiseman UK Data Service Census Support
 What are we like? Population characteristics from UK censuses Justin Hayes & Richard Wiseman UK Data Service Census Support Who are we? Richard Wiseman UK Data Service / Jisc Justin Hayes UK Data Service
By Geri Flanary To accompany AP Human Geography: A Study Guide 3 rd edition By Ethel Wood
 Session 1 By Geri Flanary To accompany AP Human Geography: A Study Guide 3 rd edition By Ethel Wood WHAT IS DEMOGRAPHY? It is the scientific or statistical study of population. It comes from the Greek
The Spatial Structure of Cities: International Examples of the Interaction of Government, Topography and Markets
 Module 2: Spatial Analysis and Urban Land Planning The Spatial Structure of Cities: International Examples of the Interaction of Government, Topography and Markets Alain Bertaud Urbanist Summary What are
CIV3703 Transport Engineering. Module 2 Transport Modelling
 CIV3703 Transport Engineering Module Transport Modelling Objectives Upon successful completion of this module you should be able to: carry out trip generation calculations using linear regression and category
Typical information required from the data collection can be grouped into four categories, enumerated as below.
 Chapter 6 Data Collection 6.1 Overview The four-stage modeling, an important tool for forecasting future demand and performance of a transportation system, was developed for evaluating large-scale infrastructure
Summary and Implications for Policy
 Summary and Implications for Policy 1 Introduction This is the report on a background study for the National Spatial Strategy (NSS) regarding the Irish Rural Structure. The main objective of the study
2016 New Ward Boundaries Guidance on calculating statistics for the new 2016 wards
 2016 New Ward Boundaries Page 1 Performance, Information and Intelligence 2016 New Ward Boundaries Guidance on calculating statistics for the new 2016 wards Briefing Note Version 2 - March 2016 2016 New
Modelling Accessibility to General Hospitals in Ireland
 Modelling Accessibility to General Hospitals in Ireland Stamatis Kalogirou 1,*, Ronan Foley 2 1. National Centre for Geocomputation, John Hume Building, NUI Maynooth, Maynooth, Co. Kildare, Ireland, Tel:
The Governance of Land Use
 The planning system The Governance of Land Use United Kingdom Levels of government and their responsibilities The United Kingdom is a unitary state with three devolved governments in Northern Ireland,
Data Collection. Lecture Notes in Transportation Systems Engineering. Prof. Tom V. Mathew. 1 Overview 1
 Data Collection Lecture Notes in Transportation Systems Engineering Prof. Tom V. Mathew Contents 1 Overview 1 2 Survey design 2 2.1 Information needed................................. 2 2.2 Study area.....................................
Geographical Inequalities and Population Change in Britain,
 Geographical Inequalities and Population Change in Britain, 1971-2011 Chris Lloyd, Nick Bearman, Gemma Catney Centre for Spatial Demographics Research, University of Liverpool, UK Email: c.d.lloyd@liverpool.ac.uk
Data Matrix User Guide
 Data Matrix User Guide 1. Introduction The 2017 Data Matrix is designed to support the 2017 iteration of the Regional Skills Assessments (RSAs) in Scotland. The RSAs align with the Regional Outcome Agreement
Profiling Burglary in London using Geodemographics. Chris Gale 1, Alex Singleton 2, Paul Longley 1
 Profiling Burglary in London using Geodemographics Chris Gale 1, Alex Singleton 2, Paul Longley 1 1 2 Geodemographic Classifications A Geodemographic Classification: Simplifies a large and complex body
The Church Demographic Specialists
 The Church Demographic Specialists Easy-to-Use Features Map-driven, Web-based Software An Integrated Suite of Information and Query Tools Providing An Insightful Window into the Communities You Serve Key
Social Vulnerability Index. Susan L. Cutter Department of Geography, University of South Carolina
 Social Vulnerability Index Susan L. Cutter Department of Geography, University of South Carolina scutter@sc.edu Great Lakes and St. Lawrence Cities Initiative Webinar December 3, 2014 Vulnerability The
Populating urban data bases with local data
 Populating urban data bases with local data (ESPON M4D, Géographie-cités, June 2013 delivery) We present here a generic methodology for populating urban databases with local data, applied to the case of
The Building Blocks of the City: Points, Lines and Polygons
 The Building Blocks of the City: Points, Lines and Polygons Andrew Crooks Centre For Advanced Spatial Analysis andrew.crooks@ucl.ac.uk www.gisagents.blogspot.com Introduction Why use ABM for Residential
Rural Gentrification: Middle Class Migration from Urban to Rural Areas. Sevinç Bahar YENIGÜL
 'New Ideas and New Generations of Regional Policy in Eastern Europe' International Conference 7-8 th of April 2016, Pecs, Hungary Rural Gentrification: Middle Class Migration from Urban to Rural Areas
School of Geography and Geosciences. Head of School Degree Programmes. Programme Requirements. Modules. Geography and Geosciences 5000 Level Modules
 School of Geography and Geosciences Head of School Degree Programmes Graduate Diploma: Dr W E Stephens Health Geography Research Environmental History and Policy (see School of History) M.Res.: M.Litt.:
British Household Panel Survey, waves 1-17 ( )
") UK Data Archive Study Number 6032 - British Household Panel Survey, Waves 1-17, 1991-2008: Conditional Access, Rural-Urban s British Household Panel Survey, waves 1-17 (1991-2008) User Documentation: Rural-Urban
UK Data Archive Study Number 6032 - British Household Panel Survey, Waves 1-17, 1991-2008: Conditional Access, Rural-Urban s British Household Panel Survey, waves 1-17 (1991-2008) User Documentation: Rural-Urban
USING CENSUS OUTPUT AREAS FOR MARKET RESEARCH SAMPLING
 USING CENSUS OUTPUT AREAS FOR MARKET RESEARCH SAMPLING Martin van Staveren Small Area Geography Planning for the Future MRS CGG Seminar, 5 th February 2007 INITIAL USE OF GEODEMOGRAPHICS BMRB was first
Measuring connectivity in London
 Measuring connectivity in London OECD, Paris 30 th October 2017 Simon Cooper TfL City Planning 1 Overview TfL Connectivity measures in TfL PTALs Travel time mapping Catchment analysis WebCAT Current and
Climate Change Adaptation and New Migrants
 Climate Change Adaptation and New Migrants ACCARNSI CONFERENCE 2016, Early Career Researcher, 12 th National Forum and Workshop 26-28 September 2016 Christina YP Ting Swinburne University of Technology
A Comprehensive Method for Identifying Optimal Areas for Supermarket Development. TRF Policy Solutions April 28, 2011
 A Comprehensive Method for Identifying Optimal Areas for Supermarket Development TRF Policy Solutions April 28, 2011 Profile of TRF The Reinvestment Fund builds wealth and opportunity for lowwealth communities
GROWING APART: THE CHANGING FIRM-SIZE WAGE PREMIUM AND ITS INEQUALITY CONSEQUENCES ONLINE APPENDIX
 GROWING APART: THE CHANGING FIRM-SIZE WAGE PREMIUM AND ITS INEQUALITY CONSEQUENCES ONLINE APPENDIX The following document is the online appendix for the paper, Growing Apart: The Changing Firm-Size Wage
Mapping Welsh Neighbourhood Types. Dr Scott Orford Wales Institute for Social and Economic Research, Data and Methods WISERD
 Mapping Welsh Neighbourhood Types Dr Scott Orford Wales Institute for Social and Economic Research, Data and Methods WISERD orfords@cardiff.ac.uk WISERD Established in 2008 and funded by the ESRC and HEFCW
Socials Studies. Chapter 3 Canada s People 3.0-Human Geography
 Socials Studies Chapter 3 Canada s People 3.0-Human Geography Physical Geography Study of the natural features of the Earth s surface including landforms, climate, ocean currents and flora and fauna Human
Identifying Gaps in Health Service Provision: GIS Approaches
 Identifying Gaps in Health Service Provision: GIS Approaches Errol Bamford, Graeme Hugo Errol Bamford 6th National Rural Health Conference Canberra, Australian Capital Territory, 4-7 March 2001 Identifying
An Open Source Geodemographic Classification of Small Areas In the Republic of Ireland Chris Brunsdon, Martin Charlton, Jan Rigby
 An Open Source Geodemographic Classification of Small Areas In the Republic of Ireland Chris Brunsdon, Martin Charlton, Jan Rigby National Centre for Geocomputation National University of Ireland, Maynooth
Geography Department. Summer transition work
 Geography Department Summer transition work An essential part of studying Geography post-16 is becoming familiar with statistical testing for fieldwork. Please complete the following activities over summer
RESIDENTIAL SATISFACTION IN THE CHANGING URBAN FORM IN ADELAIDE: A COMPARATIVE ANALYSIS OF MAWSON LAKES AND CRAIGBURN FARM, SOUTH AUSTRALIA
 RESIDENTIAL SATISFACTION IN THE CHANGING URBAN FORM IN ADELAIDE: A COMPARATIVE ANALYSIS OF MAWSON LAKES AND CRAIGBURN FARM, SOUTH AUSTRALIA by Michael Chadbourne BEPM (Hons) University of Adelaide Thesis
A Modified DBSCAN Clustering Method to Estimate Retail Centre Extent
 A Modified DBSCAN Clustering Method to Estimate Retail Centre Extent Michalis Pavlis 1, Les Dolega 1, Alex Singleton 1 1 University of Liverpool, Department of Geography and Planning, Roxby Building, Liverpool
Energy Use in Homes 2004
 Energy Use in Homes 2004 A series of reports on domestic energy use in England Space and Water Heating Energy Use in Homes 2004 A series of reports on domestic energy use in England This is one of a series
GIS-Based Analysis of the Commuting Behavior and the Relationship between Commuting and Urban Form
 GIS-Based Analysis of the Commuting Behavior and the Relationship between Commuting and Urban Form 1. Abstract A prevailing view in the commuting is that commuting would reconstruct the urban form. By
European spatial policy and regionalised approaches
 Findings of the ESPON 2006 Programme COMMIN Final Conference 26-27 April 2007 European spatial policy and regionalised approaches by Dr. Kai BöhmeB ! Territory matters Structure of presentation! Territorial
David Owen and Anne Green, University of Warwick
 Factors associated with commuting behaviour in England and Wales David Owen and Anne Green, University of Warwick Paper presented to British Society for Population Studies Annual Conference, University
Section III: Poverty Mapping Results
 Section III: Poverty Mapping Results Figure 5: Gewog level rural poverty map 58. The most prominent result from the poverty mapping exercise of Bhutan is the production of a disaggregated poverty headcount
THE LEGACY OF DUBLIN S HOUSING BOOM AND THE IMPACT ON COMMUTING
 Proceedings ITRN2014 4-5th September, Caulfield and Ahern: The Legacy of Dublin s housing boom and the impact on commuting THE LEGACY OF DUBLIN S HOUSING BOOM AND THE IMPACT ON COMMUTING Brian Caulfield
Impact of Metropolitan-level Built Environment on Travel Behavior
 Impact of Metropolitan-level Built Environment on Travel Behavior Arefeh Nasri 1 and Lei Zhang 2,* 1. Graduate Research Assistant; 2. Assistant Professor (*Corresponding Author) Department of Civil and
Correspondence: Kamarul Ismail (
 GEOGRAFIA Online TM Malaysian Journal of Society and Space 12 issue 6 (34-42) 34 Improving the tool for analyzing Malaysia s demographic change: Data standardization analysis to form geo-demographics classification
A GEOGRAPHICALLY WEIGHTED REGRESSION BASED ANALYSIS OF RAIL COMMUTING AROUND CARDIFF, SOUTH WALES
 A GEOGRAPHICALLY WEIGHTED REGRESSION BASED ANALYSIS OF RAIL COMMUTING AROUND CARDIFF, SOUTH WALES Simon Blainey, University of Southampton, S.P.Blainey@soton.ac.uk John Preston, University of Southampton
LEO Catchment Profile (LCP) Key Data for Enterprise Strategy
 Key Data for Enterprise Strategy") Laois...Portarlington LEO Catchment Profile (LCP) Key Data for Enterprise Strategy Laois Local Enterprise Office Address: Business Support Unit, County Hall, Portlaoise, County Laois Web: https://www.localenterprise.ie/laois/
Laois...Portarlington LEO Catchment Profile (LCP) Key Data for Enterprise Strategy Laois Local Enterprise Office Address: Business Support Unit, County Hall, Portlaoise, County Laois Web: https://www.localenterprise.ie/laois/
Open Data Sources for Domain Specific Geodemographics
 Open Data Sources for Domain Specific Geodemographics Matthew D. Pratt 1, Paul A. Longley 1, James Cheshire 2, Chris Gale 1 1 Department of Geography, University College London, Gower Street, London, WC1E
Working with Census 2000 Data from MassGIS
 Tufts University GIS Tutorial Working with Census 2000 Data from MassGIS Revised September 26, 2007 Overview In this tutorial, you will use pre-processed census data from Massachusetts to create maps of
Understanding and accessing 2011 census aggregate data
 Understanding and accessing 2011 census aggregate data 4 July 11:00 to 16:00 BST Justin Hayes and Richard Wiseman UK Data Service Census Support UK censuses provide an unparalleled resource of high quality
Demographic Data in ArcGIS. Harry J. Moore IV
 Demographic Data in ArcGIS Harry J. Moore IV Outline What is demographic data? Esri Demographic data - Real world examples with GIS - Redistricting - Emergency Preparedness - Economic Development Next
Example Client. Example Agency. Experian Contact Details. Debbie Blackburn
 Example Client Example Agency Experian Contact Details Debbie Blackburn 07967 646493 deborah.blackburn@uk.experian.com About this Pack Experian are constantly reviewing the market to ensure our customers
Topic 4: Changing cities
 Topic 4: Changing cities Overview of urban patterns and processes 4.1 Urbanisation is a global process a. Contrasting trends in urbanisation over the last 50 years in different parts of the world (developed,
Population, Housing and Employment Forecasts. Technical Report
 Population, Housing and Employment Forecasts Technical Report Population, Housing and Employment Forecasts Technical Report Research and Performance April 2013 A report by the Cambridgeshire County Council
Giant Traveling Map Lesson
 Giant Traveling Map Lesson TITLE / AUTHOR: Idahoans on the Move / Rebecca Theobald IDAHO ACADEMIC STANDARDS / SUITABLE DISCIPLINES: OBJECTIVES: Students will: Learn about major cities in Idaho during three
Exploring the Impact of Ambient Population Measures on Crime Hotspots
 Exploring the Impact of Ambient Population Measures on Crime Hotspots Nick Malleson School of Geography, University of Leeds http://nickmalleson.co.uk/ N.S.Malleson@leeds.ac.uk Martin Andresen Institute
Jobs-Housing Fit: Linking Housing Affordability and Local Wages
 Jobs-Housing Fit: Linking Housing Affordability and Local Wages Alex Karner, PhD Assistant Professor School of City and Regional Planning Georgia Institute of Technology Chris Benner, PhD Dorothy E. Everett
Population Profiles
 U N D E R S T A N D I N G A N D E X P L O R I N G D E M O G R A P H I C C H A N G E MAPPING AMERICA S FUTURES, BRIEF 6 2000 2010 Population Profiles Atlanta, Las Vegas, Washington, DC, and Youngstown Allison
Millennium Cohort Study:
 Millennium Cohort Study: Geographic Identifiers in MCS June 2009 Jon Johnson Centre for Longitudinal Studies Faculty of Policy and Society Institute of Education, University of London Page 1 Introduction
A Guide to Census Geography
 Research Briefing 2013-05 July 2013 A Guide to Census Geography Contents 1 About this Briefing... 3 2 Sub Ward Geography... 3 3 The Geographical Hierarchies... 3 4 The Statistical Hierarchy... 4 5 Nesting...
A Micro-Analysis of Accessibility and Travel Behavior of a Small Sized Indian City: A Case Study of Agartala
 A Micro-Analysis of Accessibility and Travel Behavior of a Small Sized Indian City: A Case Study of Agartala Moumita Saha #1, ParthaPratim Sarkar #2,Joyanta Pal #3 #1 Ex-Post graduate student, Department
Developing and Validating Regional Travel Forecasting Models with CTPP Data: MAG Experience
 CTPP Webinar and Discussion Thursday, July 17, 1-3pm EDT Developing and Validating Regional Travel Forecasting Models with CTPP Data: MAG Experience Kyunghwi Jeon, MAG Petya Maneva, MAG Vladimir Livshits,
INSIDE. Metric Descriptions by Topic Area. Data Sources and Methodology by Topic Area. Technical Appendix
 As part of the Chicago Neighborhoods 2015 (CN2015) project, the Institute for Housing Studies at DePaul University collected data and built metrics to help The Chicago Community Trust and the City of Chicago
BUILDING SOUND AND COMPARABLE METRICS FOR SDGS: THE CONTRIBUTION OF THE OECD DATA AND TOOLS FOR CITIES AND REGIONS
 BUILDING SOUND AND COMPARABLE METRICS FOR SDGS: THE CONTRIBUTION OF THE OECD DATA AND TOOLS FOR CITIES AND REGIONS STATISTICAL CAPACITY BUILDING FOR MONITORING OF SUSTAINABLE DEVELOPMENT GOALS Lukas Kleine-Rueschkamp
Declaration Population and culture
 Declaration Population and culture The ministers of the parties to the Alpine Convention regard the socio-economic and socio-cultural aspects mentioned in Article 2, Paragraph 2, Item a., as being central
Geospatial Analysis of Job-Housing Mismatch Using ArcGIS and Python
 Geospatial Analysis of Job-Housing Mismatch Using ArcGIS and Python 2016 ESRI User Conference June 29, 2016 San Diego, CA Jung Seo, Frank Wen, Simon Choi and Tom Vo, Research & Analysis Southern California
The Economic and Social Health of the Cairngorms National Park 2010 Summary
 The Economic and Social Health of the Cairngorms National Park 2010 Published by Cairngorms National Park Authority The Economic and Social Health of the Cairngorms National Park 2010 This summary highlights
2016 New Ward Boundaries Guidance on calculating statistics for the new 2016 wards
 2016 New Ward Boundaries Page 1 Performance, Information and Intelligence 2016 New Ward Boundaries Guidance on calculating statistics for the new 2016 wards Briefing Note February 2016 2016 New Ward Boundaries
PURR: POTENTIAL OF RURAL REGIONS UK ESPON WORKSHOP Newcastle 23 rd November Neil Adams
 PURR: POTENTIAL OF RURAL REGIONS UK ESPON WORKSHOP Newcastle 23 rd November 2012 Neil Adams PURR: Potential of Rural Regions Introduction Context for the project A spectrum of knowledge Rural Potentials
SOCIO-DEMOGRAPHIC INDICATORS FOR REGIONAL POPULATION POLICIES
 SOCIO-DEMOGRAPHIC INDICATORS FOR REGIONAL POPULATION POLICIES A CANADIAN PERSPECTIVE Marc Termote Université de Montréal Potsdam, DART Conference, September 3, 2012 3 STEPS 1. Defining the problem 2. Identifying
2011 census geography and beyond: what can we expect? David Martin SLA Conference, 27 October 2008
 2011 census geography and beyond: what can we expect? David Martin SLA Conference, 27 October 2008 Overview A quick history lesson: census 2001-2001 output area design Where have we got to since then?
Smart Growth: Threat to the Quality of Life. Experience
 Smart Growth: Threat to the Quality of Life Presentation by Wendell Cox Wendell Cox Consultancy Visiting Professor Conservatoire National des Arts et Metiers Paris Frontier Centre for Public Policy Winnipeg
Energy Use in Homes. A series of reports on domestic energy use in England. Energy Efficiency
 Energy Use in Homes A series of reports on domestic energy use in England Energy Efficiency Energy Use in Homes A series of reports on domestic energy use in England This is one of a series of three reports
Presented at ESRI Education User Conference, July 6-8, 2001, San Diego, CA
 Presented at ESRI Education User Conference, July 6-8, 2001, San Diego, CA Irina V. Sharkova, Ph.D., Research Assistant Professor Richard Lycan, Ph.D., Senior Research Associate Population Research Center
CRP 608 Winter 10 Class presentation February 04, Senior Research Associate Kirwan Institute for the Study of Race and Ethnicity
 CRP 608 Winter 10 Class presentation February 04, 2010 SAMIR GAMBHIR SAMIR GAMBHIR Senior Research Associate Kirwan Institute for the Study of Race and Ethnicity Background Kirwan Institute Our work Using
Assessing Social Vulnerability to Biophysical Hazards. Dr. Jasmine Waddell
 Assessing Social Vulnerability to Biophysical Hazards Dr. Jasmine Waddell About the Project Built on a need to understand: The pre-disposition of the populations in the SE to adverse impacts from disaster
Abstract. 1 Introduction
 Urban density and car and bus use in Edinburgh Paul Dandy Department of Civil & Transportation Engineering, Napier University, EH10 5DT, United Kingdom EMail: p.dandy@napier.ac.uk Abstract Laissez-faire
How Geography Affects Consumer Behaviour The automobile example
 How Geography Affects Consumer Behaviour The automobile example Murtaza Haider, PhD Chuck Chakrapani, Ph.D. We all know that where a consumer lives influences his or her consumption patterns and behaviours.
Qatar Statistical Geospatial Integration
 Qatar Statistical Geospatial Integration A Presentation by the Ministry of Development Planning & Statistics (MDPS), State of Qatar http://www.mdps.gov.qa (Fourth UN-GGIM Arab States Committee Meeting,
A4. Methodology Annex: Sampling Design (2008) Methodology Annex: Sampling design 1
 Methodology Annex: Sampling design 1") A4. Methodology Annex: Sampling Design (2008) Methodology Annex: Sampling design 1 Introduction The evaluation strategy for the One Million Initiative is based on a panel survey. In a programme such as
A4. Methodology Annex: Sampling Design (2008) Methodology Annex: Sampling design 1 Introduction The evaluation strategy for the One Million Initiative is based on a panel survey. In a programme such as
DELIVERING ECOSYSTEM- BASED MARINE SPATIAL PLANNING IN PRACTICE
 DELIVERING ECOSYSTEM- BASED MARINE SPATIAL PLANNING IN PRACTICE A first assessment for the UK and Ireland January 08 GLOBAL WARMING IMAGES / WWF ABOUT WWF WWF is the world s leading independent conservation
The National Spatial Strategy
 Purpose of this Consultation Paper This paper seeks the views of a wide range of bodies, interests and members of the public on the issues which the National Spatial Strategy should address. These views
Brazil Experience in SDG data production, dissemination and capacity building
 Brazil Experience in SDG data production, dissemination and capacity building Claudio Stenner Coordinator of Geography 4th Meeting of the Working Group on Geospatial Information IAEG-SDG United Nations
Marking Scheme Field Work. 6 International Geography Olympiad. Brisbane
 Marking Scheme Field Work th 6 International Geography Olympiad Brisbane June 2006 Question - Map - 7 Marks Mark out of 4 and divide by 2 at the end. (Sample map was provided to markers.) Shading according
Council Workshop on Neighbourhoods Thursday, October 4 th, :00 to 4:00 p.m. Burlington Performing Arts Centre
 Council Workshop on Neighbourhoods Thursday, October 4 th, 2012 1:00 to 4:00 p.m. Burlington Performing Arts Centre Agenda Introductions Warm-Up Exercise Presentation Exercise Neighbourhood Planning Break
Gridded population data for the UK redistribution models and applications
 Gridded population data for the UK redistribution models and applications David Martin 1 1 School of Geography, University of Southampton, Southampton, SO17 1BJ, UK e- mail: D.J.Martin@soton.ac.uk Abstract