Exploratory Spatial Data Analysis Using GeoDA: : An Introduction
|
|
|
- Arnold Anthony
- 6 years ago
- Views:
Transcription
1 Exploratory Spatial Data Analysis Using GeoDA: : An Introduction Prepared by Professor Ravi K. Sharma, University of Pittsburgh Modified for NBDPN 2007 Conference Presentation by Professor Russell S. Kirby, University of Alabama at Birmingham
2 Objectives Using MACDP data on chromosomal abnormalities measured across census tracts, we will demonstrate the use of GeoDa to: Start a project, import data, use basic functions Perform Exploratory Spatial Data Analysis (ESDA) Calculate rates and weights Create spatial weight matrix Perform spatial autocorrelation The examples that follow are based on a dataset for county-level analysis of low birth weight for the state of Pennsylvania.
3 GeoDa GeoDa is a freely available software program for exploratory spatial data analysis (ESDA), developed by Professor Luc Anselin of the University of Illinois It can be downloaded from the following URL:
4 Beginning a Project
5 Opening GeoDa To begin click on the GeoDa Icon

6 Starting a project

7 Open a map with shape file

8 The base map

9 Editing features

10 Menu toolbar features

11 Icon toolbar features
12 Creating Maps and Selecting Features

13 Create choropleth maps
14 Choropleth map steps

15 Creating choropleth (quantile)) maps

16 Creating quantile maps
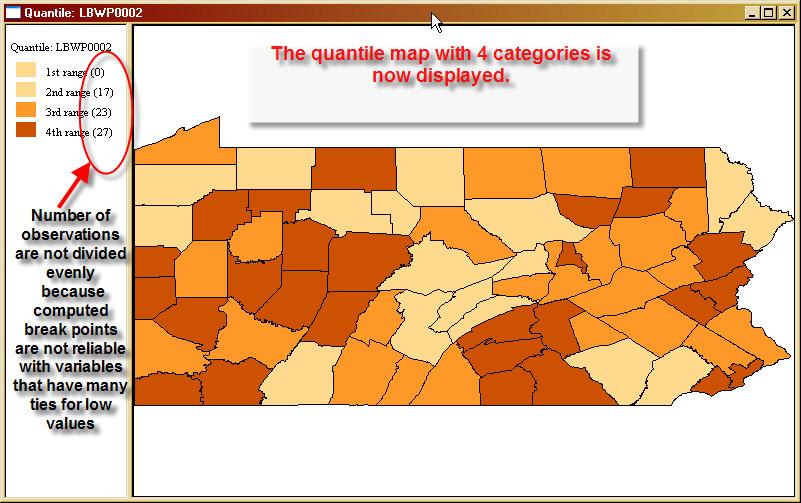
17 Final choropleth map

18 Open a new copy of base map

19 Create a new choropleth map

20 Dynamic map selection option

21 Selecting map areas

22 Table features

23 Table sorting features

24 Specific table selection

25 Creating new variables

26 Creating shape files from map

27 Polygon to point shape file

28 Create centroids for point files
29 Exploratory Data Analysis (EDA)

30 EDA: plots

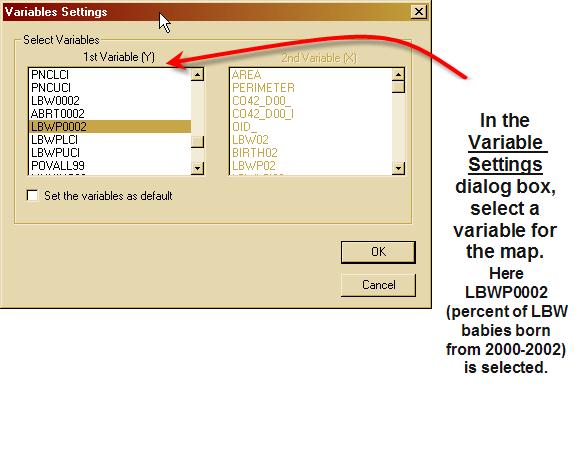
31 Variable selection for plots

32 Plots: Histogram

33 Linkage: selecting features

34 Linkage: selecting features (con( con t.)

35 Generate and interpret box plots
36 Calculating Rates

37 Create raw rates

38 Selecting variables for rates

39 Raw rates: by percent

40 Saving rates

41 Identifying outliers from box plots

42 Create excess risk rates

43 Excess risk map

44 Creating Empirical Bayes smoothing

45 Map generated by EB smoothing
46 Creating Weights: Examining spatial relationships

47 Creating weights

48 Loading weight files

49 Creating spatial rates

50 Spatially smoothed map

51 Create weights: Rook

52 Text file of Rook weights

53 Compare weights with map and table
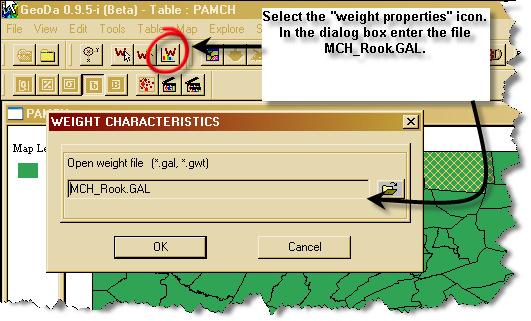
54 View weight characteristics

55 Multiple views: weight histogram, map and table

56 Create weights: Queen

57 Compare multiple features

58 Creating weights: neighbors

59 Reviewing weights

60 Creating weights: nearest neighbors

61 Histogram of neighbor weights
62 Autocorrelation: Identifying clusters
63 Global Moran It is a measure of spatial autocorrelation (feature similarity) based not only on feature locations or attribute values alone but also on both feature locations and feature values simultaneously. Given a set of features and an associated attribute, it evaluates whether the pattern expressed is clustered, dispersed, or random. A Moran's Index value near +1.0 indicates clustering; an index value near -1.0 indicates dispersion

64 Global Moran

65 Autocorrelation: weight file required

66 Global Moran result
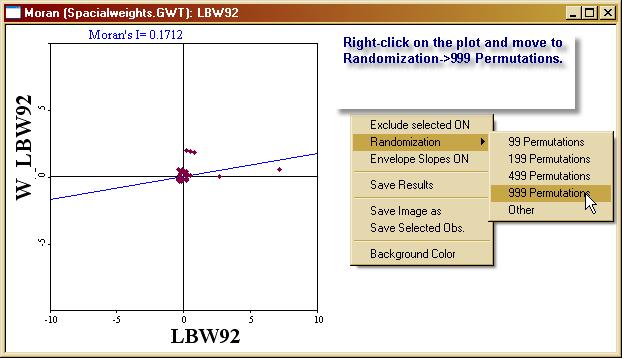
67 Randomization feature
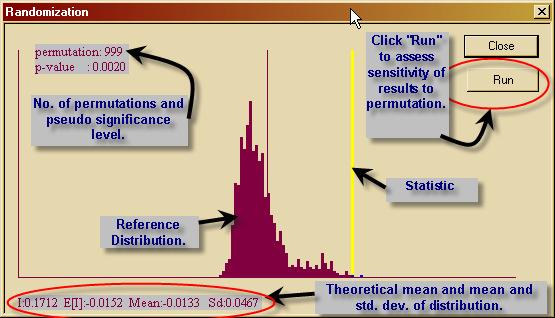
68 Randomization: graph result

69 Randomization: Envelope Slopes
70 Local Moran (LISA) The local Moran test (Anselin( 1995), detects local spatial autocorrelation. It can be used to identify local clusters (regions where adjacent areas have similar values) or spatial outliers (areas distinct from their neighbors). The Local Moran statistic decomposes Moran's I (Moran 1950) ) into contributions for each location, Ii.. The sum of Ii for all observations is proportional to Moran's I, an indicator of global pattern. Thus, there can be two interpretations of Local Moran statistics, as indicators of local spatial clusters and as a diagnostic for outliers in global spatial patterns.

71 Local Moran
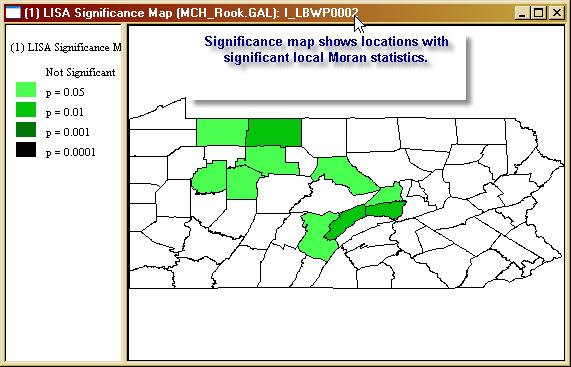
72 LISA: Significance map

73 LISA: Cluster map
OPEN GEODA WORKSHOP / CRASH COURSE FACILITATED BY M. KOLAK
 OPEN GEODA WORKSHOP / CRASH COURSE FACILITATED BY M. KOLAK WHAT IS GEODA? Software program that serves as an introduction to spatial data analysis Free Open Source Source code is available under GNU license
Lecture 3: Exploratory Spatial Data Analysis (ESDA) Prof. Eduardo A. Haddad
 Prof. Eduardo A. Haddad") Lecture 3: Exploratory Spatial Data Analysis (ESDA) Prof. Eduardo A. Haddad Key message Spatial dependence First Law of Geography (Waldo Tobler): Everything is related to everything else, but near things
Lecture 3: Exploratory Spatial Data Analysis (ESDA) Prof. Eduardo A. Haddad Key message Spatial dependence First Law of Geography (Waldo Tobler): Everything is related to everything else, but near things
Mapping and Analysis for Spatial Social Science
 Mapping and Analysis for Spatial Social Science Luc Anselin Spatial Analysis Laboratory Dept. Agricultural and Consumer Economics University of Illinois, Urbana-Champaign http://sal.agecon.uiuc.edu Outline
Outline ESDA. Exploratory Spatial Data Analysis ESDA. Luc Anselin
 Exploratory Spatial Data Analysis ESDA Luc Anselin University of Illinois, Urbana-Champaign http://www.spacestat.com Outline ESDA Exploring Spatial Patterns Global Spatial Autocorrelation Local Spatial
Exploratory Spatial Data Analysis and GeoDa
 Exploratory Spatial Data Analysis and GeoDa Luc Anselin Spatial Analysis Laboratory Dept. Agricultural and Consumer Economics University of Illinois, Urbana-Champaign http://sal.agecon.uiuc.edu Outline
Soc/Anth 597 Spatial Demography March 14, GeoDa 0.95i Exercise A. Stephen A. Matthews. Outline. 1. Background
 Soc/Anth 597 Spatial Demography March 14, 2006 GeoDa 0.95i Exercise A Stephen A. Matthews Outline 1. Background 2. Data set introduced (GDANEPAL.SHP) 3. GeoDa introduced Task 1: Start GeoDa Task 2: Open
Geographical Information Systems Institute. Center for Geographic Analysis, Harvard University. GeoDa: Spatial Autocorrelation
 Geographical Information Systems Institute, A. Background From geodacenter.asu.edu: GeoDa is a free software program that serves as an introduction to spatial data analysis. OpenGeoDa is the cross-platform,
Attribute Data. ArcGIS reads DBF extensions. Data in any statistical software format can be
 This hands on application is intended to introduce you to the foundational methods of spatial data analysis available in GeoDa. We will undertake an exploratory spatial data analysis, of 1,387 southern
Exploratory Spatial Data Analysis (And Navigating GeoDa)
") Exploratory Spatial Data Analysis (And Navigating GeoDa) June 9, 2006 Stephen A. Matthews Associate Professor of Sociology & Anthropology, Geography and Demography Director of the Geographic Information
Exploratory Spatial Data Analysis (And Navigating GeoDa) June 9, 2006 Stephen A. Matthews Associate Professor of Sociology & Anthropology, Geography and Demography Director of the Geographic Information
Outline. Introduction to SpaceStat and ESTDA. ESTDA & SpaceStat. Learning Objectives. Space-Time Intelligence System. Space-Time Intelligence System
 Outline I Data Preparation Introduction to SpaceStat and ESTDA II Introduction to ESTDA and SpaceStat III Introduction to time-dynamic regression ESTDA ESTDA & SpaceStat Learning Objectives Activities
The GeoDa Book. Exploring Spatial Data. Luc Anselin
 The GeoDa Book Exploring Spatial Data Luc Anselin Copyright 2017 by GeoDa Press LLC All rights reserved. ISBN: 0-9863421-2-2 ISBN-13: 978-0-9863421-2-7 GeoDa Press LLC, Chicago, IL GeoDa TM is a trade
Luc Anselin Spatial Analysis Laboratory Dept. Agricultural and Consumer Economics University of Illinois, Urbana-Champaign
 GIS and Spatial Analysis Luc Anselin Spatial Analysis Laboratory Dept. Agricultural and Consumer Economics University of Illinois, Urbana-Champaign http://sal.agecon.uiuc.edu Outline GIS and Spatial Analysis
Where to Invest Affordable Housing Dollars in Polk County?: A Spatial Analysis of Opportunity Areas
 Resilient Neighborhoods Technical Reports and White Papers Resilient Neighborhoods Initiative 6-2014 Where to Invest Affordable Housing Dollars in Polk County?: A Spatial Analysis of Opportunity Areas
Exploratory Spatial Data Analysis (ESDA)
") Exploratory Spatial Data Analysis (ESDA) VANGHR s method of ESDA follows a typical geospatial framework of selecting variables, exploring spatial patterns, and regression analysis. The primary software
Exploratory Spatial Data Analysis (ESDA) VANGHR s method of ESDA follows a typical geospatial framework of selecting variables, exploring spatial patterns, and regression analysis. The primary software
Spatial Analysis I. Spatial data analysis Spatial analysis and inference
 Spatial Analysis I Spatial data analysis Spatial analysis and inference Roadmap Outline: What is spatial analysis? Spatial Joins Step 1: Analysis of attributes Step 2: Preparing for analyses: working with
Lab Activity: The Central Limit Theorem
 Lab Activity: The Central Limit Theorem In this lab activity, you will explore the properties of the Central Limit Theorem. Student Learning Outcomes By the end of this chapter, you should be able to do
Introduction. Part I: Quick run through of ESDA checklist on our data
 CSDE GIS Workshop Series Spatial Regression Chris Fowler csfowler@uw.edu Introduction The goal of these exercises is to give you a chance to put the concepts we have just discussed into practice. Keep
Spatial Clusters of Rates
 Spatial Clusters of Rates Luc Anselin http://spatial.uchicago.edu concepts EBI local Moran scan statistics Concepts Rates as Risk from counts (spatially extensive) to rates (spatially intensive) rate =
EXPLORATORY SPATIAL DATA ANALYSIS OF BUILDING ENERGY IN URBAN ENVIRONMENTS. Food Machinery and Equipment, Tianjin , China
 EXPLORATORY SPATIAL DATA ANALYSIS OF BUILDING ENERGY IN URBAN ENVIRONMENTS Wei Tian 1,2, Lai Wei 1,2, Pieter de Wilde 3, Song Yang 1,2, QingXin Meng 1 1 College of Mechanical Engineering, Tianjin University
Rate Maps and Smoothing
 Rate Maps and Smoothing Luc Anselin Spatial Analysis Laboratory Dept. Agricultural and Consumer Economics University of Illinois, Urbana-Champaign http://sal.agecon.uiuc.edu Outline Mapping Rates Risk
Local Spatial Autocorrelation Clusters
 Local Spatial Autocorrelation Clusters Luc Anselin http://spatial.uchicago.edu LISA principle local Moran local G statistics issues and interpretation LISA Principle Clustering vs Clusters global spatial
Spatial Autocorrelation (2) Spatial Weights
 Spatial Weights") Spatial Autocorrelation (2) Spatial Weights Luc Anselin Spatial Analysis Laboratory Dept. Agricultural and Consumer Economics University of Illinois, Urbana-Champaign http://sal.agecon.uiuc.edu Outline
Spatial Autocorrelation (2) Spatial Weights Luc Anselin Spatial Analysis Laboratory Dept. Agricultural and Consumer Economics University of Illinois, Urbana-Champaign http://sal.agecon.uiuc.edu Outline
Geographical Information Systems Institute. Center for Geographic Analysis, Harvard University. GeoDa: Exploratory Spatial Data Analysis
 Geographical Information Systems Institute, A. Background GeoDa: Exploratory Spatial Data Analysis From geodacenter.asu.edu: GeoDa is a free software program that serves as an introduction to spatial data
Tracey Farrigan Research Geographer USDA-Economic Research Service
 Rural Poverty Symposium Federal Reserve Bank of Atlanta December 2-3, 2013 Tracey Farrigan Research Geographer USDA-Economic Research Service Justification Increasing demand for sub-county analysis Policy
Finding Hot Spots in ArcGIS Online: Minimizing the Subjectivity of Visual Analysis. Nicholas M. Giner Esri Parrish S.
 Finding Hot Spots in ArcGIS Online: Minimizing the Subjectivity of Visual Analysis Nicholas M. Giner Esri Parrish S. Henderson FBI Agenda The subjectivity of maps What is Hot Spot Analysis? Why do Hot
This lab exercise will try to answer these questions using spatial statistics in a geographic information system (GIS) context.
 context.") by Introduction Problem Do the patterns of forest fires change over time? Do forest fires occur in clusters, and do the clusters change over time? Is this information useful in fighting forest fires? This
by Introduction Problem Do the patterns of forest fires change over time? Do forest fires occur in clusters, and do the clusters change over time? Is this information useful in fighting forest fires? This
Spatial Autocorrelation
 Spatial Autocorrelation Luc Anselin http://spatial.uchicago.edu spatial randomness positive and negative spatial autocorrelation spatial autocorrelation statistics spatial weights Spatial Randomness The
In this exercise we will learn how to use the analysis tools in ArcGIS with vector and raster data to further examine potential building sites.
 GIS Level 2 In the Introduction to GIS workshop we filtered data and visually examined it to determine where to potentially build a new mixed use facility. In order to get a low interest loan, the building
Introduction to Spatial Statistics and Modeling for Regional Analysis
 Introduction to Spatial Statistics and Modeling for Regional Analysis Dr. Xinyue Ye, Assistant Professor Center for Regional Development (Department of Commerce EDA University Center) & School of Earth,
Final Project: An Income and Education Study of Washington D.C.
 Final Project: An Income and Education Study of Washington D.C. Barbara J. McKay Archibald Geography 586 Dr. Justine Blanford 12 December, 2009 As the seat of the United States Federal Government, Washington
Spatial Regression. 1. Introduction and Review. Luc Anselin. Copyright 2017 by Luc Anselin, All Rights Reserved
 Spatial Regression 1. Introduction and Review Luc Anselin http://spatial.uchicago.edu matrix algebra basics spatial econometrics - definitions pitfalls of spatial analysis spatial autocorrelation spatial
SPACE Workshop NSF NCGIA CSISS UCGIS SDSU. Aldstadt, Getis, Jankowski, Rey, Weeks SDSU F. Goodchild, M. Goodchild, Janelle, Rebich UCSB
 SPACE Workshop NSF NCGIA CSISS UCGIS SDSU Aldstadt, Getis, Jankowski, Rey, Weeks SDSU F. Goodchild, M. Goodchild, Janelle, Rebich UCSB August 2-8, 2004 San Diego State University Some Examples of Spatial
SASI Spatial Analysis SSC Meeting Aug 2010 Habitat Document 5
 OBJECTIVES The objectives of the SASI Spatial Analysis were to (1) explore the spatial structure of the asymptotic area swept (z ), (2) define clusters of high and low z for each gear type, (3) determine
Introduction GeoXp : an R package for interactive exploratory spatial data analysis. Illustration with a data set of schools in Midi-Pyrénées.
 Presentation of Presentation of Use of Introduction : an R package for interactive exploratory spatial data analysis. Illustration with a data set of schools in Midi-Pyrénées. Authors of : Christine Thomas-Agnan,
CSISS Tools and Spatial Analysis Software
 CSISS Tools and Spatial Analysis Software June 5, 2006 Stephen A. Matthews Associate Professor of Sociology & Anthropology, Geography and Demography Director of the Geographic Information Analysis Core
Visualize and interactively design weight matrices
 Visualize and interactively design weight matrices Angelos Mimis *1 1 Department of Economic and Regional Development, Panteion University of Athens, Greece Tel.: +30 6936670414 October 29, 2014 Summary
Acknowledgments xiii Preface xv. GIS Tutorial 1 Introducing GIS and health applications 1. What is GIS? 2
 Acknowledgments xiii Preface xv GIS Tutorial 1 Introducing GIS and health applications 1 What is GIS? 2 Spatial data 2 Digital map infrastructure 4 Unique capabilities of GIS 5 Installing ArcView and the
The Implementation of Autocorrelation-Based Regioclassification in ArcMap Using ArcObjects
 140 The Implementation of Autocorrelation-Based Regioclassification in ArcMap Using ArcObjects Christoph MAYRHOFER Abstract Conventional methods for cartographic classification are often solely based on
Where Do Overweight Women In Ghana Live? Answers From Exploratory Spatial Data Analysis
 Where Do Overweight Women In Ghana Live? Answers From Exploratory Spatial Data Analysis Abstract Recent findings in the health literature indicate that health outcomes including low birth weight, obesity
Tutorial 12 Excess Pore Pressure (B-bar method) Undrained loading (B-bar method) Initial pore pressure Excess pore pressure
 Undrained loading (B-bar method) Initial pore pressure Excess pore pressure") Tutorial 12 Excess Pore Pressure (B-bar method) Undrained loading (B-bar method) Initial pore pressure Excess pore pressure Introduction This tutorial will demonstrate the Excess Pore Pressure (Undrained
Tutorial 12 Excess Pore Pressure (B-bar method) Undrained loading (B-bar method) Initial pore pressure Excess pore pressure Introduction This tutorial will demonstrate the Excess Pore Pressure (Undrained
KAAF- GE_Notes GIS APPLICATIONS LECTURE 3
 GIS APPLICATIONS LECTURE 3 SPATIAL AUTOCORRELATION. First law of geography: everything is related to everything else, but near things are more related than distant things Waldo Tobler Check who is sitting
Esri EADA10. ArcGIS Desktop Associate. Download Full Version :
 Esri EADA10 ArcGIS Desktop Associate Download Full Version : http://killexams.com/pass4sure/exam-detail/eada10 Question: 85 Which format is appropriate for exporting map documents that require vector layers
Concepts and Applications of Kriging. Eric Krause Konstantin Krivoruchko
 Concepts and Applications of Kriging Eric Krause Konstantin Krivoruchko Outline Introduction to interpolation Exploratory spatial data analysis (ESDA) Using the Geostatistical Wizard Validating interpolation
GIS CONFERENCE MAKING PLACE MATTER Decoding Health Data with Spatial Statistics
 esri HEALTH AND HUMAN SERVICES GIS CONFERENCE MAKING PLACE MATTER Decoding Health Data with Spatial Statistics Flora Vale Jenora D Acosta Wait a minute Wait a minute Where is Lauren?? Wait a minute Where
Concepts and Applications of Kriging. Eric Krause
 Concepts and Applications of Kriging Eric Krause Sessions of note Tuesday ArcGIS Geostatistical Analyst - An Introduction 8:30-9:45 Room 14 A Concepts and Applications of Kriging 10:15-11:30 Room 15 A
Spatial Analysis 1. Introduction
 Spatial Analysis 1 Introduction Geo-referenced Data (not any data) x, y coordinates (e.g., lat., long.) ------------------------------------------------------ - Table of Data: Obs. # x y Variables -------------------------------------
Concepts and Applications of Kriging
 2013 Esri International User Conference July 8 12, 2013 San Diego, California Technical Workshop Concepts and Applications of Kriging Eric Krause Konstantin Krivoruchko Outline Intro to interpolation Exploratory
Development of Integrated Spatial Analysis System Using Open Sources. Hisaji Ono. Yuji Murayama
 Development of Integrated Spatial Analysis System Using Open Sources Hisaji Ono PASCO Corporation 1-1-2, Higashiyama, Meguro-ku, TOKYO, JAPAN; Telephone: +81 (03)3421 5846 FAX: +81 (03)3421 5846 Email:
In matrix algebra notation, a linear model is written as
 DM3 Calculation of health disparity Indices Using Data Mining and the SAS Bridge to ESRI Mussie Tesfamicael, University of Louisville, Louisville, KY Abstract Socioeconomic indices are strongly believed
Community Health Needs Assessment through Spatial Regression Modeling
 Community Health Needs Assessment through Spatial Regression Modeling Glen D. Johnson, PhD CUNY School of Public Health glen.johnson@lehman.cuny.edu Objectives: Assess community needs with respect to particular
FleXScan User Guide. for version 3.1. Kunihiko Takahashi Tetsuji Yokoyama Toshiro Tango. National Institute of Public Health
 FleXScan User Guide for version 3.1 Kunihiko Takahashi Tetsuji Yokoyama Toshiro Tango National Institute of Public Health October 2010 http://www.niph.go.jp/soshiki/gijutsu/index_e.html User Guide version
The Rain in Spain - Tableau Public Workbook
 The Rain in Spain - Tableau Public Workbook This guide will take you through the steps required to visualize how the rain falls in Spain with Tableau public. (All pics from Mac version of Tableau) Workbook
Geovisualization. Luc Anselin. Copyright 2016 by Luc Anselin, All Rights Reserved
 Geovisualization Luc Anselin http://spatial.uchicago.edu from EDA to ESDA from mapping to geovisualization mapping basics multivariate EDA primer From EDA to ESDA Exploratory Data Analysis (EDA) reaction
11. Kriging. ACE 492 SA - Spatial Analysis Fall 2003
 11. Kriging ACE 492 SA - Spatial Analysis Fall 2003 c 2003 by Luc Anselin, All Rights Reserved 1 Objectives The goal of this lab is to further familiarize yourself with ESRI s Geostatistical Analyst, extending
Nature of Spatial Data. Outline. Spatial Is Special
 Nature of Spatial Data Outline Spatial is special Bad news: the pitfalls of spatial data Good news: the potentials of spatial data Spatial Is Special Are spatial data special? Why spatial data require
Outline Anatomy of ArcGIS Metadata Data Types Vector Raster Conversion Adding Data Navigation Symbolization Methods Layer Files Editing Help Files
 UPlan Training Lab Exercise: Introduction to ArcGIS Outline Anatomy of ArcGIS Metadata Data Types Vector Raster Conversion Adding Data Navigation Symbolization Methods Layer Files Editing Help Files Anatomy
Spatial Data, Spatial Analysis and Spatial Data Science
 Spatial Data, Spatial Analysis and Spatial Data Science Luc Anselin http://spatial.uchicago.edu 1 spatial thinking in the social sciences spatial analysis spatial data science spatial data types and research
Geographical Movement
 Today s Topic Geographical Movement is critically important. This is because much change in the world is due to geographical movement. The movement of ideas, people, disease, money, energy, or material.
Basic Geostatistics: Pattern Description
 Basic Geostatistics: Pattern Description A SpaceStat Software Tutorial Copyright 2013, BioMedware, Inc. (www.biomedware.com). All rights reserved. SpaceStat and BioMedware are trademarks of BioMedware,
STARS: Space-Time Analysis of Regional Systems
 STARS: Space-Time Analysis of Regional Systems Sergio J. Rey Mark V. Janikas April 27, 2004 Abstract Space-Time Analysis of Regional Systems (STARS) is an open source package designed for dynamic exploratory
Spatial Data Analysis in Archaeology Anthropology 589b. Kriging Artifact Density Surfaces in ArcGIS
 Spatial Data Analysis in Archaeology Anthropology 589b Fraser D. Neiman University of Virginia 2.19.07 Spring 2007 Kriging Artifact Density Surfaces in ArcGIS 1. The ingredients. -A data file -- in.dbf
Spatial Tools for Econometric and Exploratory Analysis
 Spatial Tools for Econometric and Exploratory Analysis Michael F. Goodchild University of California, Santa Barbara Luc Anselin University of Illinois at Urbana-Champaign http://csiss.org Outline A Quick
Classification Exercise UCSB July 2006
 Classification Exercise UCSB July 2006 Purpose This exercise will examine how spatial data is catergorized and the advantages and disadvantages of different classification methods. Terms to know Population,
Introduction to PySAL and Web Based Spatial Statistics
 1 Introduction to PySAL and Web Based Spatial Statistics Myung-Hwa Hwang GeoDa Center for Geospatial Analysis and Computation School of Geographical Sciences and Urban Planning Arizona State University
Spatial Effects and Externalities
 Spatial Effects and Externalities Philip A. Viton November 5, Philip A. Viton CRP 66 Spatial () Externalities November 5, / 5 Introduction If you do certain things to your property for example, paint your
Spatial Trends of unpaid caregiving in Ireland
 Spatial Trends of unpaid caregiving in Ireland Stamatis Kalogirou 1,*, Ronan Foley 2 1. NCG Affiliate, Thoukididi 20, Drama, 66100, Greece; Tel: +30 6977 476776; Email: skalogirou@gmail.com; Web: http://www.gisc.gr.
Spatial Analysis with ArcGIS Pro STUDENT EDITION
 Spatial Analysis with ArcGIS Pro STUDENT EDITION Copyright 2018 Esri All rights reserved. Course version 2.0. Version release date November 2018. Printed in the United States of America. The information
WlLPEN L. GORR KRISTEN S. KURLAND. Universitats- und Landesbibliothek. Bibliothek Architektur und Stadtebau ESRI
 hj WlLPEN L. GORR KRISTEN S. KURLAND Universitats- und Landesbibliothek Darmstadt Bibliothek Architektur und Stadtebau ESRI Contents Acknowledgments Preface xvii XV GIS Tutorial 1 Introduction Launch ArcMap
A GEOSTATISTICAL APPROACH TO PREDICTING A PHYSICAL VARIABLE THROUGH A CONTINUOUS SURFACE
 Katherine E. Williams University of Denver GEOG3010 Geogrpahic Information Analysis April 28, 2011 A GEOSTATISTICAL APPROACH TO PREDICTING A PHYSICAL VARIABLE THROUGH A CONTINUOUS SURFACE Overview Data
The Geodatabase Working with Spatial Analyst. Calculating Elevation and Slope Values for Forested Roads, Streams, and Stands.
 GIS LAB 7 The Geodatabase Working with Spatial Analyst. Calculating Elevation and Slope Values for Forested Roads, Streams, and Stands. This lab will ask you to work with the Spatial Analyst extension.
Geometric Algorithms in GIS
 Geometric Algorithms in GIS GIS Software Dr. M. Gavrilova GIS System What is a GIS system? A system containing spatially referenced data that can be analyzed and converted to new information for a specific
Data Structures & Database Queries in GIS
 Data Structures & Database Queries in GIS Objective In this lab we will show you how to use ArcGIS for analysis of digital elevation models (DEM s), in relationship to Rocky Mountain bighorn sheep (Ovis
Geoprocessing Tools at ArcGIS 9.2 Desktop
 Geoprocessing Tools at ArcGIS 9.2 Desktop Analysis Tools Analysis Tools \ Extract Clip Analysis Tools \ Extract Select Analysis Tools \ Extract Split Analysis Tools \ Extract Table Select Analysis Tools
Concepts and Applications of Kriging
 Esri International User Conference San Diego, California Technical Workshops July 24, 2012 Concepts and Applications of Kriging Konstantin Krivoruchko Eric Krause Outline Intro to interpolation Exploratory
The Use of Spatial Weights Matrices and the Effect of Geometry and Geographical Scale
 The Use of Spatial Weights Matrices and the Effect of Geometry and Geographical Scale António Manuel RODRIGUES 1, José António TENEDÓRIO 2 1 Research fellow, e-geo Centre for Geography and Regional Planning,
Web-Based Analytical Tools for the Exploration of Spatial Data
 Web-Based Analytical Tools for the Exploration of Spatial Data Luc Anselin, Yong Wook Kim and Ibnu Syabri Spatial Analysis Laboratory Department of Agricultural and Consumer Economics University of Illinois,
1 Introduction to Minitab
 1 Introduction to Minitab Minitab is a statistical analysis software package. The software is freely available to all students and is downloadable through the Technology Tab at my.calpoly.edu. When you
Lab 1 Uniform Motion - Graphing and Analyzing Motion
 Lab 1 Uniform Motion - Graphing and Analyzing Motion Objectives: < To observe the distance-time relation for motion at constant velocity. < To make a straight line fit to the distance-time data. < To interpret
Migration Clusters in Brazil: an Analysis of Areas of Origin and Destination Ernesto Friedrich Amaral
 1 Migration Clusters in Brazil: an Analysis of Areas of Origin and Destination Ernesto Friedrich Amaral Research question and data The main goal of this research is to analyze whether the pattern of concentration
Using AMOEBA to Create a Spatial Weights Matrix and Identify Spatial Clusters, and a Comparison to Other Clustering Algorithms
 Using AMOEBA to Create a Spatial Weights Matrix and Identify Spatial Clusters, and a Comparison to Other Clustering Algorithms Arthur Getis* and Jared Aldstadt** *San Diego State University **SDSU/UCSB
The Church Demographic Specialists
 The Church Demographic Specialists Easy-to-Use Features Map-driven, Web-based Software An Integrated Suite of Information and Query Tools Providing An Insightful Window into the Communities You Serve Key
Geostatistical Interpolation: Kriging and the Fukushima Data. Erik Hoel Colligium Ramazzini October 30, 2011
 Geostatistical Interpolation: Kriging and the Fukushima Data Erik Hoel Colligium Ramazzini October 30, 2011 Agenda Basics of geostatistical interpolation Fukushima radiation Database Web site Geoanalytic
Distributed Graduated Seminar in Landscape Genetics. Adaptive genetic variation
 Introduction To carry out this lab, we use GIS software (Quantum GIS and OpenGeoDa) and a specific landscape genomic software implementing a correlative approach to detect signatures of natural selection
Photometry of Supernovae with Makali i
 Photometry of Supernovae with Makali i How to perform photometry specifically on supernovae targets using the free image processing software, Makali i This worksheet describes how to use photometry to
Orange Visualization Tool (OVT) Manual
 Manual") Orange Visualization Tool (OVT) Manual This manual describes the features of the tool and how to use it. 1. Contents of the OVT Once the OVT is open (the first time it may take some seconds), it should
Orange Visualization Tool (OVT) Manual This manual describes the features of the tool and how to use it. 1. Contents of the OVT Once the OVT is open (the first time it may take some seconds), it should
LAB 3 INSTRUCTIONS SIMPLE LINEAR REGRESSION
 LAB 3 INSTRUCTIONS SIMPLE LINEAR REGRESSION In this lab you will first learn how to display the relationship between two quantitative variables with a scatterplot and also how to measure the strength of
Applying cluster analysis to 2011 Census local authority data
 Applying cluster analysis to 2011 Census local authority data Kitty.Lymperopoulou@manchester.ac.uk SPSS User Group Conference November, 10 2017 Outline Basic ideas of cluster analysis How to choose variables
Watershed Modeling With DEMs
 Watershed Modeling With DEMs Lesson 6 6-1 Objectives Use DEMs for watershed delineation. Explain the relationship between DEMs and feature objects. Use WMS to compute geometric basin data from a delineated
Introduction To Raster Based GIS Dr. Zhang GISC 1421 Fall 2016, 10/19
 Introduction To Raster Based GIS Dr. Zhang GISC 1421 Fall 2016, 10/19 Model of the course Using and making maps Navigating GIS maps Map design Working with spatial data Geoprocessing Spatial data infrastructure
DIFFERENT INFLUENCES OF SOCIOECONOMIC FACTORS ON THE HUNTING AND FISHING LICENSE SALES IN COOK COUNTY, IL
 DIFFERENT INFLUENCES OF SOCIOECONOMIC FACTORS ON THE HUNTING AND FISHING LICENSE SALES IN COOK COUNTY, IL Xiaohan Zhang and Craig Miller Illinois Natural History Survey University of Illinois at Urbana
Outline. ArcGIS? ArcMap? I Understanding ArcMap. ArcMap GIS & GWR GEOGRAPHICALLY WEIGHTED REGRESSION. (Brief) Overview of ArcMap
 Overview of ArcMap") GEOGRAPHICALLY WEIGHTED REGRESSION Outline GWR 3.0 Software for GWR (Brief) Overview of ArcMap Displaying GWR results in ArcMap stewart.fotheringham@nuim.ie http://ncg.nuim.ie ncg.nuim.ie/gwr/ ArcGIS?
GEOGRAPHICALLY WEIGHTED REGRESSION Outline GWR 3.0 Software for GWR (Brief) Overview of ArcMap Displaying GWR results in ArcMap stewart.fotheringham@nuim.ie http://ncg.nuim.ie ncg.nuim.ie/gwr/ ArcGIS?
Spatial Regression Modeling
 Spatial Regression Modeling Paul Voss & Katherine Curtis The Center for Spatially Integrated Social Science Santa Barbara, CA July 12-17, 2009 Day 1 Objective Provide a solid introduction and overview
Application of Spatial Regression Models to Income Poverty Ratios in Middle Delta Contiguous Counties in Egypt
 Application of Spatial Regression Models to Income Poverty Ratios in Middle Delta Contiguous Counties in Egypt Sohair F Higazi Dept. Applied Statistics Faculty of Commerce, Tanta University, Tanta, Egypt
2015 JOURNAL OF ASFMRA
 How Spatially Clustered are State-level Farmland Values? By Terry Griffin, Gregg Ibendahl, and Tyler Mark ABSTRACT Farmland values are influenced by productivity levels, prices of pertinent crops, farm
Visual Analytics Law Enforcement Toolkit
 Visual Analytics Law Enforcement Toolkit Abish Malik, Ross Maciejewski, Timothy F. Collins, David S. Ebert Purdue University Visualization and Analytics Center Purdue University West Lafayette, IN 47906
GIS Test Drive What a Geographic Information System Is and What it Can Do. Alison Davis-Holland
 GIS Test Drive What a Geographic Information System Is and What it Can Do Alison Davis-Holland adavisholland@gmail.com WHO AM I? Geospatial Analyst M.S. in Geographic and Cartographic Sciences Use GIS
Determining the Concentration of a Solution: Beer s Law
 Determining the Concentration of a Solution: Beer s Law Vernier Spectrometer 1 The primary objective of this experiment is to determine the concentration of an unknown copper (II) sulfate solution. You
BMEGUI Tutorial 6 Mean trend and covariance modeling
 BMEGUI Tutorial 6 Mean trend and covariance modeling 1. Objective Spatial research analysts/modelers may want to remove a global offset (called mean trend in BMEGUI manual and tutorials) from the space/time
SOCI 20253/GEOG 20500, SOCI 30253, MACS Introduction to Spatial Data Science SYLLABUS
 University of Chicago Department of Sociology Autumn 2017 SOCI 20253/GEOG 20500, SOCI 30253, MACS 54000 Introduction to Spatial Data Science Luc Anselin Meet: Office: E-Mail: Office Hours: Prerequisite: