FleXScan User Guide. for version 3.1. Kunihiko Takahashi Tetsuji Yokoyama Toshiro Tango. National Institute of Public Health
|
|
|
- Anabel West
- 5 years ago
- Views:
Transcription
1 FleXScan User Guide for version 3.1 Kunihiko Takahashi Tetsuji Yokoyama Toshiro Tango National Institute of Public Health October User Guide version 3.1e
2 Introduction The FleXScan software has been developed to analyze spatial count data using the flexible spatial scan statistic developed by Tango and Takahashi (2005) and Kulldorff s circular spatial scan statistic (1997). The current version includes a spatial scan statistic with a restricted likelihood ratio proposed by Tango (2008). It is similar to the SaTScan software (2008) developed by Kulldorff together with Information Management System Inc., but the current version of FleXScan is still restricted to spatial analyses. Kulldorff s circular spatial scan statistic uses a circular window with variable size to define the potential cluster area and so it is difficult to correctly detect noncircular clusters, such as those along a river. In real applications, most geographical areas are noncircular. Tango and Takahashi s flexible spatial scan statistic, therefore, is designed so that the detected cluster is allowed to be flexible in shape, while at the same time the cluster is confined within relatively small neighborhoods of each region. It should be noted that both of these scan statistics are based on maximizing the likelihood ratio. Tango (2000) showed an interesting example in which Kulldorff's circular spatial scan statistic detected an unrealistically large most likely cluster (MLC) consisting of 70 regions. This was much larger than expected from an observed disease map, and was due to absorption of neighboring regions with a non-elevated risk of disease occurrence in his simulated data. Furthermore, Tango and Takahashi have shown examples in which Duczmal and Assunção s non-circular scan statistic (2004) detected quite large and peculiar shaped MLC that had the largest likelihood ratio among the MLCs identified by the three different spatial scan statistics: Kulldorff's, Duczmal and Assunção s, and Tango and Takahashi's. These results cast doubt on the validity of model selection based on maximizing the likelihood ratio. Tango (2008) proposed a new spatial scan statistic free from this undesirable property by modifying the likelihood ratio so that it scans only the regions with elevated risk at the region s significance level of alpha, specified by the user. The FleXScan software is a free software program designed for any of the following interrelated purposes: 1) To evaluate reported spatial disease clusters, to see if they are statistically significant. 2) To test whether a disease is randomly distributed over space
3 3) To perform geographical surveillance of disease, to detect areas of significantly high rates. FleXScan uses the Poisson model, where the number of events in an area is Poisson distributed according to a known underlying population at risk. This version can also analyze data under the Binomial model. The data may be either aggregated at the census tract, zip-code, county or other geographical level. FleXScan can adjust for the underlying inhomogeneity of a background population and for any number of categorical covariates provided by user. References Tango T and Takahashi K. (2005). A flexibly shaped spatial scan statistic for detecting clusters. International Journal of Health Geographics 2005, 4:11. [Open Access] Kulldorff M. (1997). A spatial scan statistic. Communications in Statistics: Theory and Methods, 26: Tango T. (2008). A spatial scan statistic with a restricted likelihood ratio. Japanese Journal of Biometrics 29: Kulldorff M and Information Management Services, Inc (2008). SaTScan TM v7.0: Software for the spatial and space-time scan statistics. Duczmal L and Assunção R. (2004). A simulated annealing strategy for the detection of arbitrarily shaped spatial clusters. Computational Statistics & Data Analysis, 45, Tango T. (2000). A test for spatial disease clustering adjusted for multiple testing. Statistics in Medicine, 19,
4 Downloading and Installation To install FleXScan, go to the Department of Technology Assessment and Biostatistics, National Institute of Public Health Web site at: and select the download link. After downloading the FleXScan installation executable to your PC, click on its icon and install the software by following the step-wise instructions. System requirements: Intel Pentium processor III or higher Microsoft Windows 2000,Windows XP, Windows VISTA or Windows 7 256MB of RAM (recommended) - 3 -
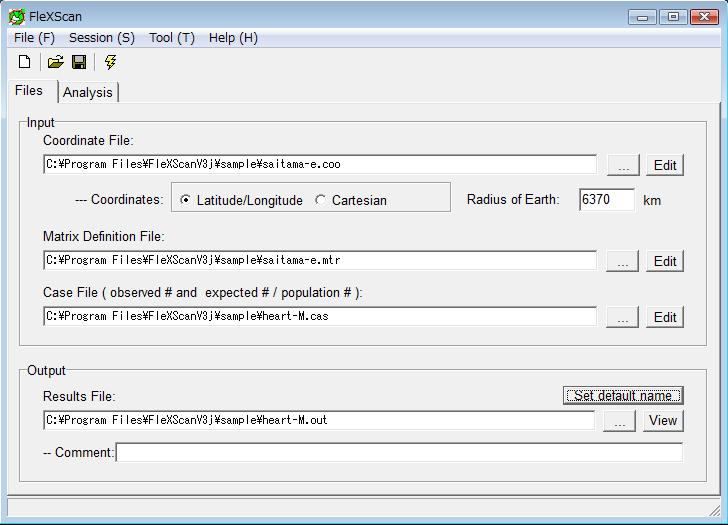
5 Test Run Before using your own data, we recommend trying the sample data set provided with the software. To perform a test run: 1. Click on the FleXScan application icon. 2. Select the following files in the sample folder (C:/Program Files/FleXScan/sample, default) as input data. 1 Coordinate File: saitama-e.coo 2 Check latitude/longitude in the Coordinates 3 Matrix Definition File: saitama-e.mtr 4 Case File: heart-m.cas 3. Click on Set default name or input any file name to output the results
6 4. Next, click on Analysis tab 1 Select Poisson in the Statistical model. 2 Select Original LLR or LLR with Restriction in the Statistic type, and Flexible or Circular in the Scanning method, respectively. 5. Click on Run button ( ) or select Session - Run. 6. After a while, the results file and the results map will appear. Results: MOST LIKELY CLUSTER Census areas included. : kawaguchi, souka, koshigaya, are regions detected as the most likely cluster, and its significance is also given by P-value...: Regardless of the p-value, the most likely cluster is shown in red on the map
7 - 6 -
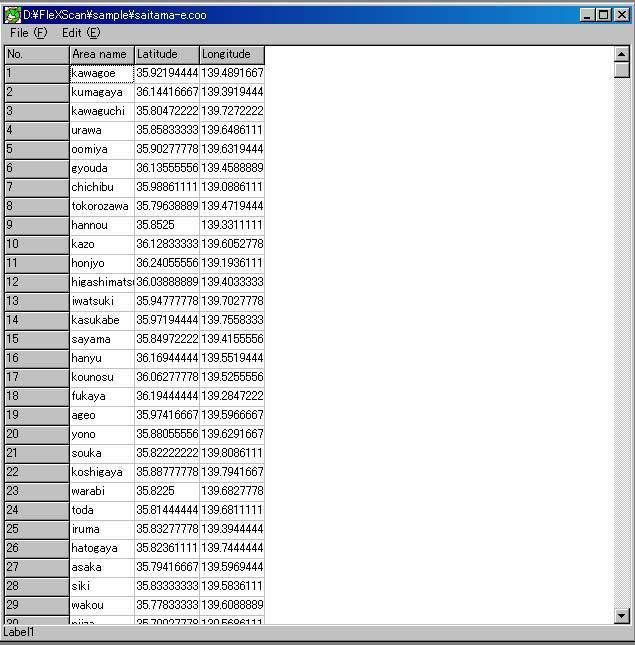
8 Sample Data Sets and Data Input Form To analyze your own data using FleXScan, you need to prepare at least three data files: 1) Coordinate File, 2) Matrix Definition File, and 3) Case File. The detailed structure of each file is explained in the following section showing sample data files for Saitama prefecture in Japan (automatically installed in your sample folder). 1 Coordinate File (coo) The coordinate file provides the geographic coordinates for each area. Coordinates may be specified either using the standard Cartesian coordinates system or in latitude and longitude. Cartesian is the regular planar x,y-coordinate system. Each line of the file represents an area name (or code) and its geographical location. For the Cartesian coordinates system Format: <Area name or code> <X-coordinate> <Y-coordinate> For the Latitude and Longitude coordinates system Format: <Area name or code> <Latitude> <Longitude> Latitudes and longitudes should be entered as decimal numbers of degrees. You can convert latitudes and longitudes expressed in degrees, minutes, and seconds to decimal number of degrees by the following formula: xx (degrees) yy (minutes) zz (seconds) xx + yy/60 + zz/3600 (degrees). When coordinates are specified in latitudes and longitudes, FleXScan calculates the distance between two points on the surface of the spherical earth with a radius given in the Radius of Earth
9 - 8 -
 that are adjacent to (i.e., border on) the area described in the first column.")
10 2 Matrix Definition File (mtr) Format: <Area name or code> <Area 1> <Area 2> The first column of each line is the area name, which must be identical to that in Coordinate File. The following columns specify the area name(s) that are adjacent to (i.e., border on) the area described in the first column. For example, kawagoe, sayama, iruma, niiza, and miyoshi areas are adjacent to tokorozawa (see row No.8 of the figure below). When Area1 is adjacent to Area3 and Area5, the mtr file should be: Area1 Area3 Area5 Area2. Area3 Area1 Note that Area1 also appears in the line of Area3 in this case (and vice versa), and the matrix must be symmetrical, otherwise an error occurs. The Check symmetry tool in the File menu is available to check the symmetry of the matrix
11 3 Case File (cas) The frequency of disease in each area is described in Case File. The current version of FleXScan can analyze two types of data. 1 observed number and expected number, Format: <Area name or code> <Observed no.> <Expected no.> For this data, Poisson model should be selected in the Statistical model for the analysis. 2 observed number and population, Format: <Area name or code> <Observed no.> <Population > For this data, Binomial model should be selected in the Statistical model for the analysis. The first column of each line is the area name, which must be identical to that in the Coordinate File. The second column is the observed number of diseases, and the third column is the expected number of diseases under the null hypothesis, or the background population at risk in each area. When you use the Poisson model, you need to calculate the expected number by yourself, for example, in the same manner as standardized mortality ratio (SMR). In kawagoe (see No.1 row of the figure) there were 705 deaths and the age-standardized expected number of deaths was (i.e., SMR = / 705 = 1.02). But, if you do not need standardization (e.g., you are interested in the crude death rate), you can analyze the case file of observed number and population using the Poisson model
. The area name or code cannot include a space character. Use an under score or a hyphen in stead of a space character. Good 10001 Good New_York N.G. New York - 11 -")
12 Important Note: All area names or codes and their order must be identical among Coordinate File, Matrix Definition File, Case File, and Population File (if necessary). The area name or code cannot include a space character. Use an under score or a hyphen in stead of a space character. Good Good New_York N.G. New York

13 Editing your data set The data files 1) to 3) can be edited using FleXScan data editor. Enter the file name and click the Edit button to execute the data editor. You can copy and paste your data from other software such as MS-Excel. It may be convenient to input your data on MS-Excel and copy and paste it to the FleXScan data editor. 1) Editing Coordinate File (coo). Input the area name and its latitude and longitude in each column. If x and y-coordinates are used, select Cartesian on the Files tab panel. Save & return to finish editing data. 2) Editing Matrix Definition File (mtr). Coordinate File must be made before starting to edit Matrix Definition File. Input the area name, which must be identical to that of Coordinate File. It will be convenient to Copy & Paste all the area names from Coordinate File to Matrix Definition File. Select an area name and execute Edit Area List, then a list of area names will appear in the order of distance from the selected area. Check the check-box of areas that are adjacent to the selected area. By clicking the OK button, the checked areas will be automatically added to the Adjacent columns (see the figure below)
14 The symmetry can be tested by executing File Check symmetry. If the information is not symmetrical (e.g., Area3 is selected as an adjacent area to Area1, but Area1 is not selected as an adjacent area to Area3), an error message will appear. Supplementary technical information: The Matrix Definition File is designed in a user-friendly format. FleXScan will automatically convert it to a Connection Information Matrix File (mt0 file) and utilize it for the calculation. You can see the format of the mt0 file using a text editor. Conversely, if you already have the area connection data in the format of an mt0 file, it can be converted to an mtr file by executing Tool Matrix-file converter. 3) Editing Case File (cas). Coordinate File must be made before starting to edit Case File. Case File can be edited in the same manner as Coordinate File
15 Parameters You can change several parameters for the analysis on the Analysis tab panel. Statistical model 1 Poisson: for the data of the observed number and the expected number. 2 Binomial: for the data of the observed number and the population. Statistic type 1 Original LLR: The likelihood ratio statistic by Kulldorff, which has been used in the previous FleXScan version 1 and version 2. 2 LLR with Restriction: The restricted likelihood ratio statistic by Tango, with a preset parameter for restriction Alpha (default is 0.2). This statistic avoids detecting undesirably large clusters, and improves calculation time. See the reference article for details. Scanning method 1 Flexible : 2 Circular : flexible scan statistic by Tango and Takahashi circular scan statistic by Kulldorff The Maximum Spatial Cluster Size The number of maximum spatial cluster size to scan. See the reference article for details. If Original LLR is selected, recommended<=20. If LLR with Restriction is selected, there are no restrictions. Random number: The type of random number for Monte Carlo simulation 1 Multinomial: Total number of cases in whole area is fixed. It can be chosen in either Poisson or Binomial model. 2 Poisson: Total number of cases is not fixed, and it can be chosen in Poisson model 3 Binomial: Total number of cases is not fixed, and it can be chosen in Binomial model
16 Monte Carlo replications The number of Monte Carlo replications to calculate a p-value for statistical test. For example, if this number is set to 999, the p-value is calculated from the simulated 999 plus 1 observed log-likelihood ratio values (999+1=1000 in total). Seed of Random Number The seed for generating random numbers in the Monte Carlo simulation. Also, on the Files tab panel, Coordinates The type of coordinates used by the coordinates file. Radius of Earth Radius of Earth to calculate a distance between two sets of latitude and longitude. It is approximately 6370 km in Japan
17 - 16 -
18 Software Licenses The FleXScan software may be used freely, with proper references to both the software and the statistical methods papers. The suggested citations are: Tango T. and Takahashi K. A flexibly shaped spatial scan statistic for detecting clusters. International Journal of Health Geographics 2005, 4:11. Takahashi K, Yokoyama T and Tango T. FleXScan v3.1: Software for the Flexible Scan Statistic. National Institute of Public Health, Japan, Also for the spatial scan statistic with a restricted likelihood ratio, Tango T. A spatial scan statistic with a restricted likelihood ratio. Japanese Journal of Biometrics 2008, 29: Copyrights Copyright 2010 Takahashi K, Yokoyama T, Tango T. All rights reserved. The FleXScan software is copyrighted by Kunihiko Takahashi, Tetsuji Yokoyama and Toshiro Tango, National Institute of Public Health, Japan
SaTScan TM. User Guide. for version 7.0. By Martin Kulldorff. August
 SaTScan TM User Guide for version 7.0 By Martin Kulldorff August 2006 http://www.satscan.org/ Contents Introduction... 4 The SaTScan Software... 4 Download and Installation... 5 Test Run... 5 Sample Data
A nonparametric spatial scan statistic for continuous data
 DOI 10.1186/s12942-015-0024-6 METHODOLOGY Open Access A nonparametric spatial scan statistic for continuous data Inkyung Jung * and Ho Jin Cho Abstract Background: Spatial scan statistics are widely used
Inclusion of Non-Street Addresses in Cancer Cluster Analysis
 Inclusion of Non-Street Addresses in Cancer Cluster Analysis Sue-Min Lai, Zhimin Shen, Darin Banks Kansas Cancer Registry University of Kansas Medical Center KCR (Kansas Cancer Registry) KCR: population-based
A spatial scan statistic for multinomial data
 A spatial scan statistic for multinomial data Inkyung Jung 1,, Martin Kulldorff 2 and Otukei John Richard 3 1 Department of Epidemiology and Biostatistics University of Texas Health Science Center at San
Spatio-Temporal Cluster Detection of Point Events by Hierarchical Search of Adjacent Area Unit Combinations
 Spatio-Temporal Cluster Detection of Point Events by Hierarchical Search of Adjacent Area Unit Combinations Ryo Inoue 1, Shiho Kasuya and Takuya Watanabe 1 Tohoku University, Sendai, Japan email corresponding
Cluster Analysis using SaTScan. Patrick DeLuca, M.A. APHEO 2007 Conference, Ottawa October 16 th, 2007
 Cluster Analysis using SaTScan Patrick DeLuca, M.A. APHEO 2007 Conference, Ottawa October 16 th, 2007 Outline Clusters & Cluster Detection Spatial Scan Statistic Case Study 28 September 2007 APHEO Conference
An Introduction to SaTScan
 An Introduction to SaTScan Software to measure spatial, temporal or space-time clusters using a spatial scan approach Marilyn O Hara University of Illinois moruiz@illinois.edu Lecture for the Pre-conference
Quick Start Guide New Mountain Visit our Website to Register Your Copy (weatherview32.com)
") Quick Start Guide New Mountain Visit our Website to Register Your Copy (weatherview32.com) Page 1 For the best results follow all of the instructions on the following pages to quickly access real-time
Quick Start Guide New Mountain Visit our Website to Register Your Copy (weatherview32.com) Page 1 For the best results follow all of the instructions on the following pages to quickly access real-time
Preparing Spatial Data
 13 CHAPTER 2 Preparing Spatial Data Assessing Your Spatial Data Needs 13 Assessing Your Attribute Data 13 Determining Your Spatial Data Requirements 14 Locating a Source of Spatial Data 14 Performing Common
Utilizing Data from American FactFinder with TIGER/Line Shapefiles in ArcGIS
 Utilizing Data from American FactFinder with TIGER/Line Shapefiles in ArcGIS Web Adams, GISP Data Dissemination Specialist U.S. Census Bureau New York Regional Office 1 What We Do Decennial Census Every
USING CLUSTERING SOFTWARE FOR EXPLORING SPATIAL AND TEMPORAL PATTERNS IN NON-COMMUNICABLE DISEASES
 USING CLUSTERING SOFTWARE FOR EXPLORING SPATIAL AND TEMPORAL PATTERNS IN NON-COMMUNICABLE DISEASES Mariana Nagy "Aurel Vlaicu" University of Arad Romania Department of Mathematics and Computer Science
SuperCELL Data Programmer and ACTiSys IR Programmer User s Guide
 SuperCELL Data Programmer and ACTiSys IR Programmer User s Guide This page is intentionally left blank. SuperCELL Data Programmer and ACTiSys IR Programmer User s Guide The ACTiSys IR Programmer and SuperCELL
NINE CHOICE SERIAL REACTION TIME TASK
 instrumentation and software for research NINE CHOICE SERIAL REACTION TIME TASK MED-STATE NOTATION PROCEDURE SOF-700RA-8 USER S MANUAL DOC-025 Rev. 1.3 Copyright 2013 All Rights Reserved MED Associates
Cluster Analysis using SaTScan
 Cluster Analysis using SaTScan Summary 1. Statistical methods for spatial epidemiology 2. Cluster Detection What is a cluster? Few issues 3. Spatial and spatio-temporal Scan Statistic Methods Probability
Task 1: Start ArcMap and add the county boundary data from your downloaded dataset to the data frame.
 Exercise 6 Coordinate Systems and Map Projections The following steps describe the general process that you will follow to complete the exercise. Specific steps will be provided later in the step-by-step
Geographical Information Systems
 Geographical Information Systems Geographical Information Systems (GIS) is a relatively new technology that is now prominent in the ecological sciences. This tool allows users to map geographic features
CatchmentsUK. User Guide. Wallingford HydroSolutions Ltd. Defining catchments in the UK
 Defining catchments in the UK Wallingford HydroSolutions Ltd Cover photographs (clockwise from top left): istockphoto.com/hazel Proudlove istockphoto.com/antony Spencer istockphoto.com/ann Taylor-Hughes
WindNinja Tutorial 3: Point Initialization
 WindNinja Tutorial 3: Point Initialization 07/20/2017 Introduction Welcome to. This tutorial will step you through the process of running a WindNinja simulation that is initialized by location specific
Data Structures & Database Queries in GIS
 Data Structures & Database Queries in GIS Objective In this lab we will show you how to use ArcGIS for analysis of digital elevation models (DEM s), in relationship to Rocky Mountain bighorn sheep (Ovis
Using Tables and Graphing Calculators in Math 11
 Using Tables and Graphing Calculators in Math 11 Graphing calculators are not required for Math 11, but they are likely to be helpful, primarily because they allow you to avoid the use of tables in some
Downloading GPS Waypoints
 Downloading Data with DNR- GPS & Importing to ArcMap and Google Earth Written by Patrick Florance & Carolyn Talmadge, updated on 4/10/17 DOWNLOADING GPS WAYPOINTS... 1 VIEWING YOUR POINTS IN GOOGLE EARTH...
Virtual Beach Making Nowcast Predictions
 Virtual Beach 3.0.6 Making Nowcast Predictions In this module you will learn how to: A. Create a real-time connection to Web data services through EnDDaT B. Download real-time data to make a Nowcast prediction
Gridded Ambient Air Pollutant Concentrations for Southern California, User Notes authored by Beau MacDonald, 11/28/2017
 Gridded Ambient Air Pollutant Concentrations for Southern California, 1995-2014 User Notes authored by Beau, 11/28/2017 METADATA: Each raster file contains data for one pollutant (NO2, O3, PM2.5, and PM10)
Applying MapCalc Map Analysis Software
 Applying MapCalc Map Analysis Software Generating Surface Maps from Point Data: A farmer wants to generate a set of maps from soil samples he has been collecting for several years. Previously, he would
WindNinja Tutorial 3: Point Initialization
 WindNinja Tutorial 3: Point Initialization 6/27/2018 Introduction Welcome to WindNinja Tutorial 3: Point Initialization. This tutorial will step you through the process of downloading weather station data
Best Pair II User Guide (V1.2)
") Best Pair II User Guide (V1.2) Paul Rodman (paul@ilanga.com) and Jim Burrows (burrjaw@earthlink.net) Introduction Best Pair II is a port of Jim Burrows' BestPair DOS program for Macintosh and Windows computers.
Best Pair II User Guide (V1.2) Paul Rodman (paul@ilanga.com) and Jim Burrows (burrjaw@earthlink.net) Introduction Best Pair II is a port of Jim Burrows' BestPair DOS program for Macintosh and Windows computers.
DISPLAYING THE POISSON REGRESSION ANALYSIS
 Chapter 17 Poisson Regression Chapter Table of Contents DISPLAYING THE POISSON REGRESSION ANALYSIS...264 ModelInformation...269 SummaryofFit...269 AnalysisofDeviance...269 TypeIII(Wald)Tests...269 MODIFYING
Virtual Beach Building a GBM Model
 Virtual Beach 3.0.6 Building a GBM Model Building, Evaluating and Validating Anytime Nowcast Models In this module you will learn how to: A. Build and evaluate an anytime GBM model B. Optimize a GBM model
41. Sim Reactions Example
 HSC Chemistry 7.0 41-1(6) 41. Sim Reactions Example Figure 1: Sim Reactions Example, Run mode view after calculations. General This example contains instruction how to create a simple model. The example
Displaying Latitude & Longitude Data (XY Data) in ArcGIS
 in ArcGIS") Displaying Latitude & Longitude Data (XY Data) in ArcGIS Created by Barbara Parmenter and updated on 2/15/2018 If you have a table of data that has longitude and latitude, or XY coordinates, you can view
Displaying Latitude & Longitude Data (XY Data) in ArcGIS Created by Barbara Parmenter and updated on 2/15/2018 If you have a table of data that has longitude and latitude, or XY coordinates, you can view
ST-Links. SpatialKit. Version 3.0.x. For ArcMap. ArcMap Extension for Directly Connecting to Spatial Databases. ST-Links Corporation.
 ST-Links SpatialKit For ArcMap Version 3.0.x ArcMap Extension for Directly Connecting to Spatial Databases ST-Links Corporation www.st-links.com 2012 Contents Introduction... 3 Installation... 3 Database
Spatial Clusters of Rates
 Spatial Clusters of Rates Luc Anselin http://spatial.uchicago.edu concepts EBI local Moran scan statistics Concepts Rates as Risk from counts (spatially extensive) to rates (spatially intensive) rate =
In this exercise we will learn how to use the analysis tools in ArcGIS with vector and raster data to further examine potential building sites.
 GIS Level 2 In the Introduction to GIS workshop we filtered data and visually examined it to determine where to potentially build a new mixed use facility. In order to get a low interest loan, the building
Winmostar tutorial LAMMPS Polymer Annealing V X-Ability Co., Ltd. 2018/01/15
 Winmostar tutorial LAMMPS Polymer Annealing V8.007 X-Ability Co., Ltd. question@winmostar.com 2018/01/15 Summary In this tutorial we will calculate glass transition temperature from the cooling process
Studying Topography, Orographic Rainfall, and Ecosystems (STORE)
") Studying Topography, Orographic Rainfall, and Ecosystems (STORE) Introduction Basic Lesson 3: Using Microsoft Excel to Analyze Weather Data: Topography and Temperature This lesson uses NCDC data to compare
Studying Topography, Orographic Rainfall, and Ecosystems (STORE) Introduction Basic Lesson 3: Using Microsoft Excel to Analyze Weather Data: Topography and Temperature This lesson uses NCDC data to compare
ncounter PlexSet Data Analysis Guidelines
 ncounter PlexSet Data Analysis Guidelines NanoString Technologies, Inc. 530 airview Ave North Seattle, Washington 98109 USA Telephone: 206.378.6266 888.358.6266 E-mail: info@nanostring.com Molecules That
PStress R Pulley Stress Analysis Software Users Manual*
 PStress R Pulley Stress Analysis Software Users Manual* Issued: October 7, 2014 *For PStress V3.5 CONVEYOR DYNAMICS, INC. 1111 West Holly St. Bellingham, WA, 98225 (USA) Phone: +1 (360) 671-2200 Contents
Passing-Bablok Regression for Method Comparison
 Chapter 313 Passing-Bablok Regression for Method Comparison Introduction Passing-Bablok regression for method comparison is a robust, nonparametric method for fitting a straight line to two-dimensional
How to Create Stream Networks using DEM and TauDEM
 How to Create Stream Networks using DEM and TauDEM Take note: These procedures do not describe all steps. Knowledge of ArcGIS, DEMs, and TauDEM is required. TauDEM software ( http://hydrology.neng.usu.edu/taudem/
User's Guide. DISTO online. Leica Geosystems
 User's Guide DISTO online Leica Geosystems Copyright 2001 by PMS Photo Mess Systeme AG. All rights reserved. This manual describes the versions 2.x of the program DISTO online. PMS PHOTO-MESS-SYSTEME AG
Orbit Support Pack for Excel. user manual
 Orbit Support Pack for Excel user manual Information in this document is subject to change without notice. Companies, names and data used in examples herein are fictitious unless noted otherwise. No part
Outline. Practical Point Pattern Analysis. David Harvey s Critiques. Peter Gould s Critiques. Global vs. Local. Problems of PPA in Real World
 Outline Practical Point Pattern Analysis Critiques of Spatial Statistical Methods Point pattern analysis versus cluster detection Cluster detection techniques Extensions to point pattern measures Multiple
Ramberg-Osgood Convertor. User Manual
 Ramberg-Osgood Convertor User Manual For Version: 1.0.5 Copyright 2010-2016 OPIMsoft Technology Co., Ltd. All Rights Reserved. INDEX 1 FUNCTION... 1 2 INSTALLATION... 4 3 HOW TO USE... 5 4 THEORY INSTRUCTION...
Account Setup. STEP 1: Create Enhanced View Account
 SpyMeSatGov Access Guide - Android DigitalGlobe Imagery Enhanced View How to setup, search and download imagery from DigitalGlobe utilizing NGA s Enhanced View license Account Setup SpyMeSatGov uses a
ARIC Manuscript Proposal # PC Reviewed: _9/_25_/06 Status: A Priority: _2 SC Reviewed: _9/_25_/06 Status: A Priority: _2
 ARIC Manuscript Proposal # 1186 PC Reviewed: _9/_25_/06 Status: A Priority: _2 SC Reviewed: _9/_25_/06 Status: A Priority: _2 1.a. Full Title: Comparing Methods of Incorporating Spatial Correlation in
Jasco V-670 absorption spectrometer
 Laser Spectroscopy Labs Jasco V-670 absorption spectrometer Operation instructions 1. Turn ON the power switch on the right side of the spectrophotometer. It takes about 5 minutes for the light source
Tests for the Odds Ratio in a Matched Case-Control Design with a Quantitative X
 Chapter 157 Tests for the Odds Ratio in a Matched Case-Control Design with a Quantitative X Introduction This procedure calculates the power and sample size necessary in a matched case-control study designed
ArcGIS 9 ArcGIS StreetMap Tutorial
 ArcGIS 9 ArcGIS StreetMap Tutorial Copyright 2001 2008 ESRI All Rights Reserved. Printed in the United States of America. The information contained in this document is the exclusive property of ESRI. This
IncuCyte ZOOM NeuroTrack Fluorescent Processing
 IncuCyte ZOOM NeuroTrack Fluorescent Processing The NeuroTrack TM Software Module (Cat No 9600-0011) is used to measure the processes of neurons in monoculture or with fluorescent labeling in co-culture.
Comparing whole genomes
 BioNumerics Tutorial: Comparing whole genomes 1 Aim The Chromosome Comparison window in BioNumerics has been designed for large-scale comparison of sequences of unlimited length. In this tutorial you will
C101-E112. BioSpec-nano. Shimadzu Spectrophotometer for Life Science
 C101-E112 BioSpec-nano Shimadzu Spectrophotometer for Life Science Power of small. BioSpec-nano BioSpec-nano Shimadzu Spectrophotometer for Life Science Quick and Simple Nucleic Acid Quantitation Drop-and-Click
HEC-HMS Lab 2 Using Thiessen Polygon and Inverse Distance Weighting
 HEC-HMS Lab 2 Using Thiessen Polygon and Inverse Distance Weighting Created by Venkatesh Merwade (vmerwade@purdue.edu) Learning outcomes The objective of this lab is to learn how to input data from multiple
August 7, 2007 NUMERICAL SOLUTION OF LAPLACE'S EQUATION
 August 7, 007 NUMERICAL SOLUTION OF LAPLACE'S EQUATION PURPOSE: This experiment illustrates the numerical solution of Laplace's Equation using a relaxation method. The results of the relaxation method
Working with Map Projections
 Working with Map Projections Rachel Applebaum and Margaret M. Maher Author of Lining Up Data in ArcGIS: a guide to map projections Second edition Some common problems that prevent data from aligning correctly
MIS 0855 Data Science (Section 005) Fall 2016 In-Class Exercise (Week 4) Visualizing with Maps
 Fall 2016 In-Class Exercise (Week 4) Visualizing with Maps") MIS 0855 Data Science (Section 005) Fall 2016 In-Class Exercise (Week 4) Visualizing with Maps Objective: Learn how to use Tableau s powerful mapping tools Learning Outcomes: Learn at what levels (e.g.
MIS 0855 Data Science (Section 005) Fall 2016 In-Class Exercise (Week 4) Visualizing with Maps Objective: Learn how to use Tableau s powerful mapping tools Learning Outcomes: Learn at what levels (e.g.
Lab 1: Importing Data, Rectification, Datums, Projections, and Coordinate Systems
 Lab 1: Importing Data, Rectification, Datums, Projections, and Coordinate Systems Topics covered in this lab: i. Importing spatial data to TAS ii. Rectification iii. Conversion from latitude/longitude
Introduction to Hartree-Fock calculations in Spartan
 EE5 in 2008 Hannes Jónsson Introduction to Hartree-Fock calculations in Spartan In this exercise, you will get to use state of the art software for carrying out calculations of wavefunctions for molecues,
Spatial Data Analysis in Archaeology Anthropology 589b. Kriging Artifact Density Surfaces in ArcGIS
 Spatial Data Analysis in Archaeology Anthropology 589b Fraser D. Neiman University of Virginia 2.19.07 Spring 2007 Kriging Artifact Density Surfaces in ArcGIS 1. The ingredients. -A data file -- in.dbf
PolarSync Quick Start
 PolarSync Quick Start Installation and Use In this Quick Start guide, we will cover installing the PolarSync program and using it as a teacher, student or guest. I. Installing PolarSync... 1 II. Teacher
AAG TPoint Mapper (Version 1.40)
") AAG TPoint Mapper (Version 1.40) AAG_TPointMapper works together with Maxim DL, Pinpoint, TheSky6 and TPoint to automate the process of building a TPoint model for a GOTO telescope connected to TheSky6.
AAG TPoint Mapper (Version 1.40) AAG_TPointMapper works together with Maxim DL, Pinpoint, TheSky6 and TPoint to automate the process of building a TPoint model for a GOTO telescope connected to TheSky6.
Lab 1: Landuse and Hydrology, learning ArcGIS II. MANIPULATING DATA
 Lab 1: Landuse and Hydrology, learning ArcGIS II. MANIPULATING DATA As you experienced in the first lab session when you created a hillshade, high resolution data can be unwieldy if you are trying to perform
Swarm and Evolutionary Computation. A new PSO-optimized geometry of spatial and spatio-temporal scan statistics for disease outbreak detection
 Swarm and Evolutionary Computation 4 (2012) 1 11 Contents lists available at SciVerse ScienceDirect Swarm and Evolutionary Computation journal homepage: www.elsevier.com/locate/swevo Regular paper A new
In order to save time, the following data files have already been preloaded to the computer (most likely under c:\odmc2012\data\)
") ODMC2012 QGIS Ex1 Schools and Public Transport In this exercise, users will learn how to a) map the location of secondary schools in and around the Southampton area; b) overlay the school location map
ODMC2012 QGIS Ex1 Schools and Public Transport In this exercise, users will learn how to a) map the location of secondary schools in and around the Southampton area; b) overlay the school location map
Photometry of Supernovae with Makali i
 Photometry of Supernovae with Makali i How to perform photometry specifically on supernovae targets using the free image processing software, Makali i This worksheet describes how to use photometry to
Investigating Models with Two or Three Categories
 Ronald H. Heck and Lynn N. Tabata 1 Investigating Models with Two or Three Categories For the past few weeks we have been working with discriminant analysis. Let s now see what the same sort of model might
Using the Budget Features in Quicken 2008
 Using the Budget Features in Quicken 2008 Quicken budgets can be used to summarize expected income and expenses for planning purposes. The budget can later be used in comparisons to actual income and expenses
Utilization and Provision of Geographical Name Information on the Basic Map of Japan*
 UNITED NATIONS WORKING PAPER GROUP OF EXPERTS NO. 1/9 ON GEOGRAPHICAL NAMES Twenty-eight session 28 April 2 May 2014 Item 9 of the Provisional Agenda Activities relating to the Working Group on Toponymic
Investigating Weather and Climate with Google Earth Teacher Guide
 Google Earth Weather and Climate Teacher Guide In this activity, students will use Google Earth to explore global temperature changes. They will: 1. Use Google Earth to determine how the temperature of
NEW HOLLAND IH AUSTRALIA. Machinery Market Information and Forecasting Portal *** Dealer User Guide Released August 2013 ***
 NEW HOLLAND IH AUSTRALIA Machinery Market Information and Forecasting Portal *** Dealer User Guide Released August 2013 *** www.cnhportal.agriview.com.au Contents INTRODUCTION... 5 REQUIREMENTS... 6 NAVIGATION...
Watershed Modeling Orange County Hydrology Using GIS Data
 v. 10.0 WMS 10.0 Tutorial Watershed Modeling Orange County Hydrology Using GIS Data Learn how to delineate sub-basins and compute soil losses for Orange County (California) hydrologic modeling Objectives
You w i ll f ol l ow these st eps : Before opening files, the S c e n e panel is active.
 You w i ll f ol l ow these st eps : A. O pen a n i m a g e s t a c k. B. Tr a c e t h e d e n d r i t e w i t h t h e user-guided m ode. C. D e t e c t t h e s p i n e s a u t o m a t i c a l l y. D. C
SteelSmart System Cold Formed Steel Design Software Download & Installation Instructions
 Step 1 - Login or Create an Account at the ASI Portal: Login: https://portal.appliedscienceint.com/account/login Create Account: https://portal.appliedscienceint.com/account/register 2 0 1 7 A p p l i
Ratio of Polynomials Fit One Variable
 Chapter 375 Ratio of Polynomials Fit One Variable Introduction This program fits a model that is the ratio of two polynomials of up to fifth order. Examples of this type of model are: and Y = A0 + A1 X
Computer simulation of radioactive decay
 Computer simulation of radioactive decay y now you should have worked your way through the introduction to Maple, as well as the introduction to data analysis using Excel Now we will explore radioactive
Standards-Based Quantification in DTSA-II Part II
 Standards-Based Quantification in DTSA-II Part II Nicholas W.M. Ritchie National Institute of Standards and Technology, Gaithersburg, MD 20899-8371 nicholas.ritchie@nist.gov Introduction This article is
Prosurv LLC Presents
 Prosurv LLC Presents An Enterprise-Level Geo-Spatial Data Visualizer Part IV Upload Data Upload Data Click the Upload Data menu item to access the uploading data page. Step #1: Select a Project All Projects
Search for the Gulf of Carpentaria in the remap search bar:
 This tutorial is aimed at getting you started with making maps in Remap (). In this tutorial we are going to develop a simple classification of mangroves in northern Australia. Before getting started with
Non-Inferiority Tests for the Ratio of Two Proportions in a Cluster- Randomized Design
 Chapter 236 Non-Inferiority Tests for the Ratio of Two Proportions in a Cluster- Randomized Design Introduction This module provides power analysis and sample size calculation for non-inferiority tests
CityGML XFM Application Template Documentation. Bentley Map V8i (SELECTseries 2)
") CityGML XFM Application Template Documentation Bentley Map V8i (SELECTseries 2) Table of Contents Introduction to CityGML 1 CityGML XFM Application Template 2 Requirements 2 Finding Documentation 2 To
CityGML XFM Application Template Documentation Bentley Map V8i (SELECTseries 2) Table of Contents Introduction to CityGML 1 CityGML XFM Application Template 2 Requirements 2 Finding Documentation 2 To
Hotelling s One- Sample T2
 Chapter 405 Hotelling s One- Sample T2 Introduction The one-sample Hotelling s T2 is the multivariate extension of the common one-sample or paired Student s t-test. In a one-sample t-test, the mean response
Acknowledgments xiii Preface xv. GIS Tutorial 1 Introducing GIS and health applications 1. What is GIS? 2
 Acknowledgments xiii Preface xv GIS Tutorial 1 Introducing GIS and health applications 1 What is GIS? 2 Spatial data 2 Digital map infrastructure 4 Unique capabilities of GIS 5 Installing ArcView and the
Using the EartH2Observe data portal to analyse drought indicators. Lesson 4: Using Python Notebook to access and process data
 Using the EartH2Observe data portal to analyse drought indicators Lesson 4: Using Python Notebook to access and process data Preface In this fourth lesson you will again work with the Water Cycle Integrator
Creating Empirical Calibrations
 030.0023.01.0 Spreadsheet Manual Save Date: December 1, 2010 Table of Contents 1. Overview... 3 2. Enable S1 Calibration Macro... 4 3. Getting Ready... 4 4. Measuring the New Sample... 5 5. Adding New
ProMass Deconvolution User Training. Novatia LLC January, 2013
 ProMass Deconvolution User Training Novatia LLC January, 2013 Overview General info about ProMass Features Basics of how ProMass Deconvolution works Example Spectra Manual Deconvolution with ProMass Deconvolution
Bayesian Inference for Regression Parameters
 Bayesian Inference for Regression Parameters 1 Bayesian inference for simple linear regression parameters follows the usual pattern for all Bayesian analyses: 1. Form a prior distribution over all unknown
In Association With. Introduces. TPT Contractor
 In Association With Introduces TPT Contractor Software for Contractors with TENSIONMETERS Table of Contents Capabilities 4 Setup and Use 7 The Dashboard 12 Tower Setup Form 18 Field Calibration Verification
The data for this lab comes from McDonald Forest. We will be working with spatial data representing the forest boundary, streams, roads, and stands.
 GIS LAB 6 Using the Projection Utility. Converting Data to Oregon s Approved Lambert Projection. Determining Stand Size, Stand Types, Road Length, and Stream Length. This lab will ask you to work with
Your work from these three exercises will be due Thursday, March 2 at class time.
 GEO231_week5_2012 GEO231, February 23, 2012 Today s class will consist of three separate parts: 1) Introduction to working with a compass 2) Continued work with spreadsheets 3) Introduction to surfer software
Exploratory Spatial Data Analysis Using GeoDA: : An Introduction
 Exploratory Spatial Data Analysis Using GeoDA: : An Introduction Prepared by Professor Ravi K. Sharma, University of Pittsburgh Modified for NBDPN 2007 Conference Presentation by Professor Russell S. Kirby,
The Church Demographic Specialists
 The Church Demographic Specialists Easy-to-Use Features Map-driven, Web-based Software An Integrated Suite of Information and Query Tools Providing An Insightful Window into the Communities You Serve Key
Quality Measures Green Light Report Online Management Tool. Self Guided Tutorial
 Quality Measures Green Light Report Online Management Tool Self Guided Tutorial 1 Tutorial Contents Overview Access the QM Green Light Report Review the QM Green Light Report Tips for Success Contact PointRight
BMEGUI Tutorial 6 Mean trend and covariance modeling
 BMEGUI Tutorial 6 Mean trend and covariance modeling 1. Objective Spatial research analysts/modelers may want to remove a global offset (called mean trend in BMEGUI manual and tutorials) from the space/time
Instructions for Mapping 2011 Census Data
 Instructions for Mapping 2011 Census Data To map 2011 census data, you must download the census boundary files and the census data separately, then join the two files in ArcMap. In this guide, we will
Interactive GIS in Veterinary Epidemiology Technology & Application in a Veterinary Diagnostic Lab
 Interactive GIS in Veterinary Epidemiology Technology & Application in a Veterinary Diagnostic Lab Basics GIS = Geographic Information System A GIS integrates hardware, software and data for capturing,
User's Manual. Chemical software Acid-base equilibria for Windows. ABEW Version Windows XP - Windows Vista - Windows 7 - Windows 8 - Windows 10
 User's Manual EW Version 1.9. Chemical software cid-base equilibria for Windows Windows XP - Windows Vista - Windows 7 - Windows 8 - Windows 10 S O F T W R E Reference: EW www.vaxasoftware.com ENGLIS INDEX
ANALYSIS OF SURVEY DATA USING SPSS
 11 ANALYSIS OF SURVEY DATA USING SPSS U.C. Sud Indian Agricultural Statistics Research Institute, New Delhi-110012 11.1 INTRODUCTION SPSS version 13.0 has many additional features over the version 12.0.
WeatherHawk Weather Station Protocol
 WeatherHawk Weather Station Protocol Purpose To log atmosphere data using a WeatherHawk TM weather station Overview A weather station is setup to measure and record atmospheric measurements at 15 minute
Basic chromatographic parameters and optimization in LC
 AM0925 Assignment Basic chromatographic parameters and optimization in LC Introduction This is a computer exercise where you will apply a simulator of reversed phase LC to study the influence of chromatographic
Spatial Analysis using Vector GIS THE GOAL: PREPARATION:
 PLAN 512 GIS FOR PLANNERS Department of Urban and Environmental Planning University of Virginia Fall 2006 Prof. David L. Phillips Spatial Analysis using Vector GIS THE GOAL: This tutorial explores some
Building Inflation Tables and CER Libraries
 Building Inflation Tables and CER Libraries January 2007 Presented by James K. Johnson Tecolote Research, Inc. Copyright Tecolote Research, Inc. September 2006 Abstract Building Inflation Tables and CER