JOINT STRATEGIC NEEDS ASSESSMENT (JSNA) Key findings from the Leicestershire JSNA and Charnwood summary
|
|
|
- Jocelyn Johns
- 5 years ago
- Views:
Transcription

1 JOINT STRATEGIC NEEDS ASSESSMENT (JSNA) Key findings from the Leicestershire JSNA and Charnwood summary 1
2 What is a JSNA? Joint Strategic Needs Assessment (JSNA) identifies the big picture in terms of the health and wellbeing needs and inequalities of a local population JSNA describes a process that identifies current and future health and wellbeing needs in light of existing services, and informs future service planning taking into account evidence of effectiveness 2
3 JSNAs and joint health and wellbeing strategies Health and Wellbeing Board What does our population and place look like? Collect the evidence What are we doing now, how well is it working? JSNA Joint Health & Wellbeing Strategy What does this mean now and for the future? A narrative on the evidence So what are our collective priorities for action, and how can we achieve them? Engagement with users and the public Commissioning plans What services do we need to commission (or decommission)? Outcomes framework How do we measure success? 3
4 Timescales JSNA March 2012 Joint Health & Wellbeing Strategy Summer 2012 Commissioning plans Autumn 2012 Outcomes framework Winter
5 JSNA 22 detailed chapters Demography Deprivation and the Economy Housing Children and Young People Health Inequalities Staying Healthy Sexual Health Long Term Conditions Cancer Mental Health Learning Disabilities Physical Disabilities Older People Dementia End of Life Care Carers Offender Health Wellbeing / Happiness Primary Care NHS Hospital Care Adult Social Care Service Usage, Assessment and Development in Social Care Assets 5
6 JSNA 22 detailed chapters Background and wider determinants Demography Deprivation and the Economy Housing Children and Young People Health Inequalities Staying Healthy Sexual Health Long Term Conditions Cancer Mental Health Learning Disabilities Physical Disabilities Older People Dementia End of Life Care Carers Offender Health Wellbeing / Happiness Primary Care NHS Hospital Care Adult Social Care Service Usage, Assessment and Development in Social Care Assets 6
7 JSNA 22 detailed chapters Chapters on need Demography Deprivation and the Economy Housing Children and Young People Health Inequalities Staying Healthy Sexual Health Long Term Conditions Cancer Mental Health Learning Disabilities Physical Disabilities Older People Dementia End of Life Care Carers Offender Health Wellbeing / Happiness Primary Care NHS Hospital Care Adult Social Care Service Usage, Assessment and Development in Social Care Assets 7
8 JSNA 22 detailed chapters Service provision Demography Deprivation and the Economy Housing Children and Young People Health Inequalities Staying Healthy Sexual Health Long Term Conditions Cancer Mental Health Learning Disabilities Physical Disabilities Older People Dementia End of Life Care Carers Offender Health Wellbeing / Happiness Primary Care NHS Hospital Care Adult Social Care Service Usage, Assessment and Development in Social Care Assets 8
9 2012 JSNA key priorities Giving children the best start in life Managing the shift to early intervention and prevention Supporting the ageing population In addition to targeting specific parts of the life course the following cross cutting themes have been identified: Targeting the communities with the greatest needs Improving mental health and wellbeing 9
10 2012 JSNA key priorities Leicestershire Together recognises that addressing these health needs can only be done in partnership with the other commissioning hubs of Leicestershire Together influencing other boards has been identified as a key priority for ensuring that the Health and Wellbeing Board delivers improved health outcomes across the life course. E.g. Children and Young People Commissioning Board The Leicester and Leicestershire Enterprise Partnership Environment Board Safer Communities Commissioning Board Stronger Communities Board Housing Services Partnership Housing Planning Infrastructure Group Leicestershire Rural Partnership Community Budget Programme Board Voluntary and Community Sector Strategy Group 10
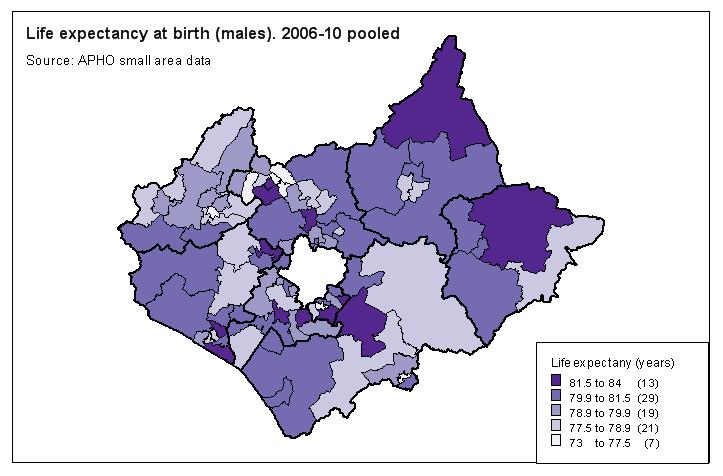
11 What does this mean for Charnwood? Background and wider determinants In 2008/ % of the residents of Charnwood surveyed reported their health and wellbeing status as being 'very good' or 'good'. This was higher than the England average (75.8%) Life expectancy for males and females in Charnwood is significantly higher than the England average. Males in Charnwood can expect to live for 79.4 years compared to the England average of 78.3 years and females can expect to live 83.1 years compared to the England average of However, the gap in life expectancy between the best-off and worstoff males in Charnwood can be estimated as 9.6 years, and for females as 6.4 years. Although these gaps are not significantly higher than the England averages (8.9 for males and 5.9 for females) it suggests inequalities exist. 11
12 12
13 13

14 Causes of inequality in life expectancy 14
15 What does this mean for Charnwood? Giving children the best start in life The infant mortality rate in Charnwood is similar to the England average (5.3 deaths for every 1000 births compared to 4.7 in England). Breastfeeding rates in Charnwood are better than the England average with 47% of women still breastfeeding at 6-8 weeks compared to 44.9% nationally). Children in Charnwood were less likely to be obese than the national average, with 16.3% of year 6 children obese compared to 18.7% nationally. However, this is still a 6 th of children in this year. The teenage conception rate in Charnwood is lower than the England average, with 27 births per 1000 women aged compared to the England average (40.2). 15

16 In 2009/10 in year 6 children in Charnwood the Loughborough Ashby ward had a significantly high rate of obesity compared to the LCR average. New data for 2010/11 shows no wards in Charnwood are significantly high. 16
17 What does this mean for Charnwood? Early intervention and prevention Smoking In 2009/10 it was estimated that around adults in Charnwood smoke (18.3%). However, in the same year 1742 adults in Charnwood set a date to quit smoking, and of these 1077 (61.8%) had quit at 4 weeks. Obesity In 2006/08 it was estimated that (22.6%) adults in Charnwood were obese. This is not significantly different to the England average (24.2%). In 2006/08 it was estimated that 31.1% of adults in Charnwood ate 5 or more portions of fruit and vegetables per day, and in 2008/09 it was estimated that 25.4% of adults in Charnwood took part in physical activity. 17
18 18

19 What does this mean for Charnwood? Early intervention and prevention Alcohol In 2009/10 there were 1451 admissions to hospital for alcohol related conditions per 100,000 population in Charnwood. This is lower than the England average (1743 per 100,000 population) There are estimated to be around adults in Charnwood who binge drink (20% of the population). 19
 mortality were cancer")
20 What does this mean for Charnwood? Burden of ill health In LCR in 2010 the top causes of premature (under 75) mortality were cancer (45%), circulatory disease (24 %) and respiratory disease (8%). 20
21 What does this mean for Charnwood? Burden of ill health In LCR in 2010 the top causes of premature (under 75) mortality were cancer (45%), circulatory disease (24 %) and respiratory disease (8%). 21
22 What does this mean for Charnwood? Burden of ill health Mortality rates from cancer, circulatory disease and chronic obstructive pulmonary disease (COPD) in Charnwood are significantly lower than the England average. Comparing modelled estimates of disease to the GP recorded prevalence suggests that in Charnwood there are approximately: 1810 patients with undiagnosed CHD Over 17,000 patients with undiagnosed hypertension 22

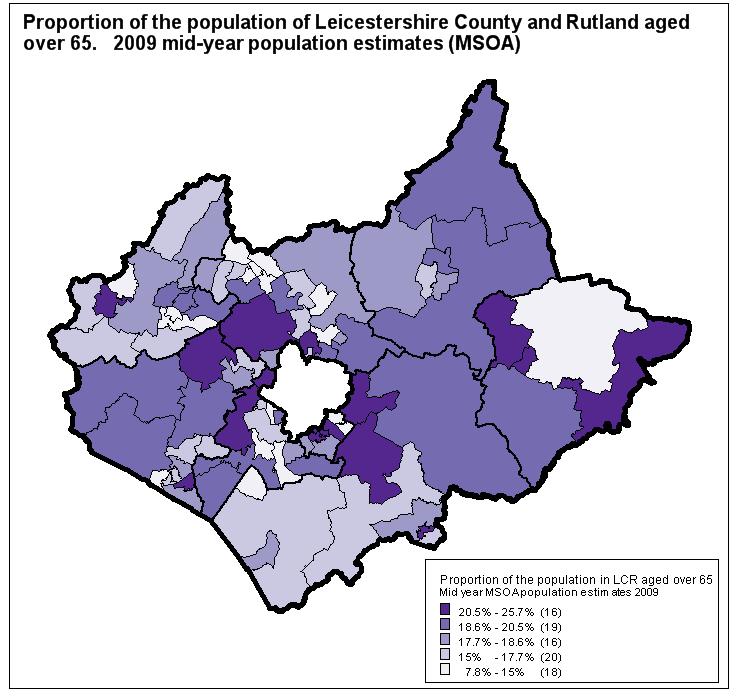
23 What does this mean for Charnwood? Older people In 2010 there are approximately people aged over 60 in Charnwood, and 7300 aged over 80. The population of Charnwood aged over 60 is estimated to increase by around 60% by
24 What does this mean for Charnwood? Older people In life expectancy for men at age 65 in Charnwood is 18.7 years and life expectancy for women at age 65 is 21.2 years. Around 6300 people aged over 75 in Charnwood are predicted to live alone in 2010, and this number is predicted to increase to by 2030 (a 77% increase). In 2010 there are estimated to be around people in Charnwood over the age of 65 with a limiting long term illness. By 2030 this is estimated to increase to around 19090, an increase of 63.2%. 24
25 25
26 26
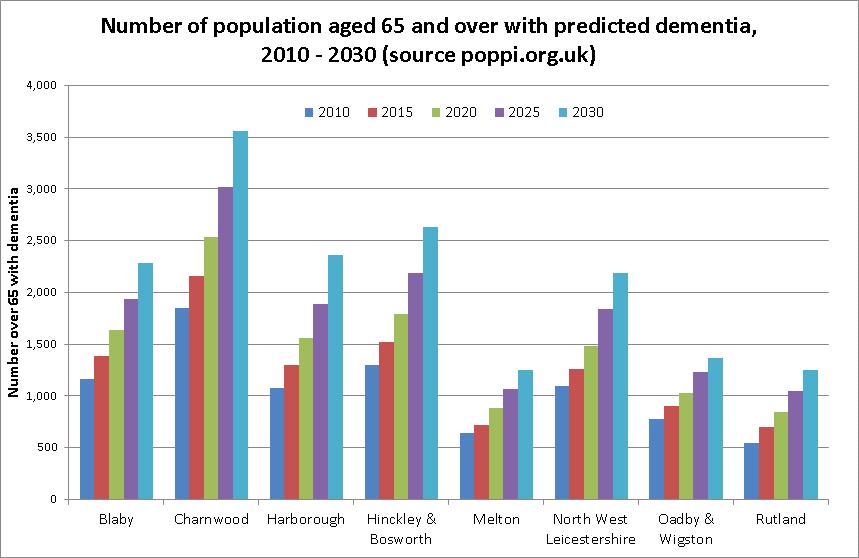
27 What does this mean for Charnwood? Impact of the ageing population In 2010 there are estimated to be around 1800 people in Charnwood with dementia. By 2030 this is estimated to increase to around 3600 people, an increase of 93%. The Census 2001 estimates that in 2001 there were around people in Charnwood who were providing unpaid care. This equates to 9.9% of the population. The increase in the older population is likely to impact substantially on the numbers of carers, particularly older carers. In 2010 there were estimated to be around 3060 carers aged over 65 in Charnwood, by 2030 this is estimated to increase to around 4610, a 51% increase. 27
28 28
29 How will the JSNA be used locally? How can Charnwood help deliver the priorities identified in the JSNA? How will you use the JSNA locally to inform local priority setting? What are the issues that are specific to Charnwood that need to be addressed locally? 29
30 Where can you find the JSNA? ssessment_jsna_2012_key_documents 30
31 LEICESTERSHIRE JOINT STRATEGIC NEEDS ASSESSMENT LOCALITY PROFILES Charnwood District APRIL 2012 Produced by NHS Leicestershire County and Rutland Public Health Directorate For more information contact: Verity Bellamy at


32 Introduction The Joint Strategic Needs Assessment (JSNA) is our overarching assessment of the health and wellbeing needs of our population across the wider health and social care economy. The JSNA is driven by the Shadow Health and Wellbeing Board in Leicestershire and is the basis for developing the Health and Wellbeing Strategy. The Health and Social Care Bill, emphasizes the importance of the JSNA as the starting point for developing health and wellbeing strategies and underpinning commissioning decisions. The Bill proposes the new statutory health and wellbeing boards will have three required functions: To oversee the production of the Joint Strategic Needs Assessment To develop a Joint Health and Wellbeing Strategy (JHWS) To develop joint commissioning intentions and ensure all commissioning intentions meet the needs identified by the JSNA and are in line with the JHWS The Shadow Health and Wellbeing Board will monitor progress towards the objectives of the Joint Health and Wellbeing Strategy through the public health outcomes framework. Page 2

33 2012 Leicestershire JSNA Priorities The strategic objective for the Health and Wellbeing Board is to add quality and years to life, by improving health throughout people s lives, reducing inequalities and focusing on the needs of the local population. The key priorities identified across the life course from the 2012 JSNA are: Giving children the best start in life Managing the shift to early intervention and prevention Supporting the aging population In addition to targeting specific parts of the life course the following cross cutting themes have been identified: Targeting the communities with the greatest needs Improving mental health and wellbeing Addressing these health needs can only be done in partnership with the other commissioning hubs of Leicestershire Together, influencing other boards has been identified as a key priority for ensuring that the Health and Wellbeing Board delivers improved health outcomes across the life course. Children and Young People Commissioning Board The Leicester and Leicestershire Enterprise Partnership Environment Board Safer Communities Commissioning Board Stronger Communities Board Housing Services Partnership Housing Planning Infrastructure Group Leicestershire Rural Partnership Community Budget Programme Board Voluntary and Community Sector Strategy Group Page 3
. Around 22% of the population are aged 60 years and over.")
34 Note Wherever possible this summary provides data at Charnwood level, however where this is not possible a population weighted average has been calculated or the Leicestershire / LCR value reported. Population of Charnwood In 2010 the population of Charnwood was estimated to be (mid 2010 population estimates). Around 22% of the population are aged 60 years and over. In 2010 there were 1911 live births in Charnwood, this is a rate of 54.1 births per 1000 women aged years. This is significantly lower than the England average (65.5 per 1000 women). In % of the population of Charnwood are estimated to be from a non-white ethnic background. This is higher than the England average (12.5%). Deprivation Based on the indices of deprivation 2010, the average deprivation score for Charnwood is Life expectancy Males In life expectancy for males in Charnwood was 79.4 years, this is significantly higher than the England average (78.3). The gap in life expectancy between the best-off and worst-off males in Charnwood for (the Slope Index of Inequality) is 9.6 years. This is not significantly different to the median gap in life expectancy for all upper tier local authorities in England (8.9 years). Females In life expectancy for females in Charnwood was 83.1 years, this is significantly higher than the England average (82.3). The gap in life expectancy between the best-off and worst-off females in Charnwood for (the Slope Index of Inequality) is 6.4 years. This is not significantly different to the median gap in life expectancy for all upper tier local authorities in England (5.9 years). Page 4
35 Children's health In 2010 there were an estimated children and young people under the age of 20 in Charnwood. Infant mortality In 2007/09 the infant mortality rate in Charnwood was 5.3 deaths in infants under one year per 1000 live births. This is not significantly different to the England average (4.7). These figures represent very small numbers of deaths, and so should be interpreted with caution. Children in poverty At the beginning of 2011 an estimated (10.5%) of children under the age of 16 in Leicestershire were classed as living in poverty. This is lower than the England average (20.9%). (Data is not available at a lower geographical level). Breastfeeding In 2009/10 the proportion of women still breastfeeding at 6-8 weeks in Charnwood was 47%. This is higher than the England average (44.9%). Children's tooth decay In 2007/08 in Charnwood the average number of decayed, missing or filled teeth in 5 year old children was This is not significantly different to the England average (1.11). Accidental injury In 2008/09 in Leicestershire there were emergency admissions for unintentional and deliberate injury to children and young people for every 10,000 children aged 0 to 17 years in the population. This is lower than the England average (117.4). (Data is not available at lower geographical levels). Page 5
36 Childhood obesity In 2009/10 9% of children in reception year in Charnwood were obese. This is not significantly different to the England average (9.8%). In 2009/ % of children in year 6 in Charnwood were obese. This is significantly lower than the England average (18.7%). Special educational needs In 2010 in Leicestershire there were 57 children in primary school with Special Educational Needs (with a statement) (2.2%). This is higher than the England average (1.4%). There were 92 children in secondary school in Leicestershire with Special Educational Needs (with a statement) (3.6%). This is higher than the England average (2%). Teenage conceptions Between 2007 and 2009 the under-18 conception rate in Charnwood was 27 births per 1000 women aged This is lower than the England average (40.2). The teenage conception rate in Charnwood has decreased by 28% since the 1998 baseline. Page 6
 had quit at 4 weeks. Obesity In 2006/08 it was estimated that 30900 (22.")
37 Staying healthy Smoking In 2009/10 it was estimated that around adults in Charnwood smoke (18.3%). This is not significantly different to the England average (21%). However, in the same year 1742 adults in Charnwood set a date to quit smoking, and of these 1077 (61.8%) had quit at 4 weeks. Obesity In 2006/08 it was estimated that (22.6%) adults in Charnwood were obese. This is not significantly different to the England average (24.2%). In 2006/08 it was estimated that 31.1% of adults in Charnwood ate 5 or more portions of fruit and vegetables per day. This is not significantly different to the England average (28.7%). In 2008/09 it was estimated that 25.4% of adults in Charnwood took part in physical activity. This is higher than the England average (21.6%). Alcohol In 2009/10 there were 1451 admissions to hospital for alcohol related conditions per 100,000 population in Charnwood. This is lower than the England average (1743 per 100,000 population.) There are estimated to be around adults in Charnwood who binge drink (20%). This is not significantly different to the England average (20.1%.) Accidental injury In 2007/09 there were 48 people killed or seriously injured on the road in Charnwood. This is a rate of 29.6 per 100,000 population, which is significantly lower than the England average (48 per 100,000 population). Sexual health In 2010/11 there were around attendances at GUM clinics in Leicestershire County and Rutland, 73.1% of these were first attendances. 93% of these first attendances at GUM clinics were seen within 48 hours. (Data not available at a lower geographical level) In 2009 there were 1552 NHS funded abortions in Leicestershire County and Rutland, of these 70% were conducted at under 10 weeks. This is lower than the England average (74.4%). (Data not available at a smaller geographical level). Page 7
38 Burden of ill health In 2008/ % of the residents of Charnwood surveyed reported their health and wellbeing status as being 'very good' or 'good'. This was higher than the England average (75.8%). In 2009 there were 5382 deaths in Leicestershire County and Rutland, 1691 of these were premature (i.e. before the age of 75). Among the premature deaths the highest proportion were from cancer (46.6%), followed by circulatory disease (24.3%) and respiratory disease (9%). In 2007/09 there were 425 deaths in Charnwood considered amenable to healthcare. This is a rate of 85.1 per 100,000 population, which is significantly lower than the England average (96.4 per 100,000 population). Circulatory disease In 2007/09 there were 298 premature deaths from circulatory disease in Charnwood. This is a rate of 57.8 per 100,000 population, which is significantly lower than the England average (70.5 per 100,000 population). CHD In 2010/11 there were 5376 patients registered with Coronary Heart Disease (CHD) in Charnwood. This is a GP recorded prevalence of 3%. However, model based estimates suggest that the actual prevalence is 4.5%, which would suggest there are approximately 1810 patients with undiagnosed CHD in Charnwood. Cancer In 2007/09 there were 513 premature deaths from cancer in Charnwood. This is a rate of 98.7 per 100,000 population, which is significantly lower than the England average (112.1 per 100,000 population). Respiratory disease In 2007/09 there were 35 deaths from chronic obstructive pulmonary disease (COPD) in Charnwood. This is a rate of 6.4 per 100,000 population, which is significantly lower than the England average (11.8 per 100,000 population). Diabetes In 2010/11 there were 7949 patients in Charnwood registered with their GP as having diabetes. This is an estimated diabetes age-specific prevalence rate of 5.5%, which is not significantly different to the England average (5.5%). In 2005 there were an estimated 290 deaths in people aged between 20 and 79 years in Leicestershire County and Rutland from diabetes, which made up approximately 10.6% of all deaths in that year. Hypertension In 2010/11 there were patients registered with hypertension in Charnwood. This is GP a recorded prevalence of 13.1%. However, model based estimates estimate that the actual prevalence is 26.6%, which would suggest there are approximately patients with undiagnosed hypertension in Charnwood. Mental health In 2010/11 there were 1175 people in Charnwood registered with their GP as having a mental health disorder including schizophrenia, bipolar disorder and other psychoses. This equates to 0.7% of the population, which is lower than the England average (0.8%). Page 8

39 Older people In 2010 there are approximately people aged over 60 in Charnwood, and 7300 aged over 80. The population of Charnwood aged over 60 is estimated to increase by around 60% by In life expectancy for men at age 65 in Charnwood is 18.7 years. However, the 2001 Census estimated that healthy life expectancy in Charnwood at 65 was 13.3 years. This was significantly higher than the England average (12.5 years). In life expectancy for women at age 65 in Charnwood is 21.2 years. However, the Census 2001 estimated that healthy life expectancy at age 65 in Charnwood was 15 years. This is significantly higher than the England average (14.5 years). Around 6300 of the population aged over 75 in Charnwood are predicted to live alone in 2010, and this number is predicted to increase to by 2030 (77% increase). In 2010 there are estimated to be around people in Charnwood over the age of 65 with a limiting long term illness. By 2030 this is estimated to increase to around 19090, an increase of 63.2%. Falls In 2009/10 in males in Charnwood there were 57.7 emergency admissions for hip fracture (which can be used as a proxy for falls) per 100,000 population, this was not significantly different to the England average (70.1 per 100,000 population). In 2009/10 in females in Charnwood the rate of emergency admissions for falls was per 100,000 population, this was not significantly different to the England average (119.2 per 100,000 population). Knee and hip replacements In 2008/09 there were 182 knee replacements in Charnwood, which is a rate of per 100,000 population, this is not significantly different to than the England average (128 per 100,000 population) In 2008/09 there were 144 hip replacements in Charnwood, which is a rate of 89.1 per 100,000 population, this is significantly lower than than the England average (113.9 per 100,000 population) Page 9

40 Dementia In 2010 there are estimated to be around 1800 people in Charnwood with dementia. By 2030 this is estimated to increase to around 3600 people, an increase of 93%. End of life care National studies indicate that over half of people would prefer to die at home. In % of deaths in Charnwood took place in hospital and 22.4% took place at home. Disabilities Learning disabilities In 2011 there are estimated to be around 3250 people in Charnwood with a learning disability. This equates to 2.4% of the population. Physical disabilities In 2011 there are estimated to be around 8160 people in Charnwoodaged with a moderate physical disability (7.5%), this is lower than the England average (7.8%). This is estimated to increase to around 8486 people by There are estimated to be a further 2380 people in Charnwood aged with a serious physical disability (2.2%), this is lower than the England average (2.3%). This is estimated to increase to around 2480 people by Carers The Census 2001 estimates that in 2001 there were around people in Charnwood who were providing unpaid care. This equates to 9.9% of the population. The increase in the older population is likely to impact substantially on the numbers of carers, particularly older carers. In 2010 there were estimated to be around 3060 carers aged over 65 in Charnwood, by 2030 this is estimated to increase to around 4610, a 51% increase. References This report is driven by the JSNA core dataset and all data references are available from: Page 10
have been a number of high level and expert reviews including the most recent, the Marmot review.
 QUESTIONS 5. Role of GPs and GP practices in public health: Are there additional ways in which we can ensure that GPs and GP practices will continue to play a key role in areas for which Public Health
Approach to identifying hot spots for NCDs in South Africa
 Approach to identifying hot spots for NCDs in South Africa HST Conference 6 May 2016 Noluthando Ndlovu, 1 Candy Day, 1 Benn Sartorius, 2 Karen Hofman, 3 Jens Aagaard-Hansen 3,4 1 Health Systems Trust,
Understanding Your Community A Guide to Data
 Understanding Your Community A Guide to Data Alex Lea September 2013 Research and Insight Team LeicestershireCounty Council Understanding Geographies Important to understand the various geographies that
Cold Weather Plan. This Plan is to be read in conjunction with: Winter Plan Escalation and Surge Business Continuity Plans Major Incident Plan
 Cold Weather Plan This Plan is to be read in conjunction with: Winter Plan Escalation and Surge Business Continuity Plans Major Incident Plan This Plan can be accessed from the Staff Zone Authorising Manager
The Future of Healthcare? W H A T D O E S T H E F U T U R E H O L D? The Empowered Consumer
 : : The Future of Healthcare? W H A T D O E S T H E F U T U R E H O L D? The Empowered Consumer Dr. Anne Anne W. Snowdon, W. Snowdon, RN, BScN, Chair MSc, PhD World Health Innovation Network, Odette School
Supporting the reconfiguration of primary care services: Strategic Health Asset Planning and Evaluation
 Supporting the reconfiguration of primary care services: Strategic Health Asset Planning and Evaluation About SHAPE Strategic Health Asset Planning and Evaluation (SHAPE) is a web enabled, evidence based
Jun Tu. Department of Geography and Anthropology Kennesaw State University
 Examining Spatially Varying Relationships between Preterm Births and Ambient Air Pollution in Georgia using Geographically Weighted Logistic Regression Jun Tu Department of Geography and Anthropology Kennesaw
Keeping well and healthy when it is really cold
 Cold Weather Plan for England 2012 Keeping well and healthy when it is really cold Easy Read version of: Cold Weather Plan for England 2012: Protecting health and reducing harm from severe cold. What
Medical GIS: New Uses of Mapping Technology in Public Health. Peter Hayward, PhD Department of Geography SUNY College at Oneonta
 Medical GIS: New Uses of Mapping Technology in Public Health Peter Hayward, PhD Department of Geography SUNY College at Oneonta Invited research seminar presentation at Bassett Healthcare. Cooperstown,
This report details analyses and methodologies used to examine and visualize the spatial and nonspatial
 Analysis Summary: Acute Myocardial Infarction and Social Determinants of Health Acute Myocardial Infarction Study Summary March 2014 Project Summary :: Purpose This report details analyses and methodologies
Applying Health Outcome Data to Improve Health Equity
 Applying Health Outcome Data to Improve Health Equity Devon Williford, MPH, Health GIS Specialist Lorraine Dixon-Jones, Policy Analyst CDPHE Health Equity and Environmental Justice Collaborative Mile High
Human Health in Arctic Russia: A Concept of National Monitoring Program
 Human Health in Arctic Russia: A Concept of National Monitoring Program By Northwest Public Health Research Center, St. Petersburg in collaboration with the AMAP Human Health Expert Group; Arctic policy
CHILD SAFETY COUNTRY PROFILE Slovenia
 CHILD SAFETY COUNTRY PROFILE 2012 Slovenia The Child Safety Country Profile 2012 for Slovenia highlights the burden of child and adolescent injury and examines socio-demographic determinants to provide
CHILD SAFETY COUNTRY PROFILE Croatia
 CHILD SAFETY COUNTRY PROFILE 2012 Croatia The Child Safety Country Profile 2012 for Croatia highlights the burden of child and adolescent injury and examines socio-demographic determinants to provide a
DISCRETE PROBABILITY DISTRIBUTIONS
 DISCRETE PROBABILITY DISTRIBUTIONS REVIEW OF KEY CONCEPTS SECTION 41 Random Variable A random variable X is a numerically valued quantity that takes on specific values with different probabilities The
GIS and Health Geography. What is epidemiology?
 GIS and Health Geography { What is epidemiology? TOC GIS and health geography Major applications for GIS Epidemiology What is health (and how location matters) What is a disease (and how to identify one)
Using Geospatial Methods with Other Health and Environmental Data to Identify Populations
 Using Geospatial Methods with Other Health and Environmental Data to Identify Populations Ellen K. Cromley, PhD Consultant, Health Geographer ellen.cromley@gmail.com Purpose and Outline To illustrate the
ESRI 2008 Health GIS Conference
 ESRI 2008 Health GIS Conference An Exploration of Geographically Weighted Regression on Spatial Non- Stationarity and Principal Component Extraction of Determinative Information from Robust Datasets A
Phone number: When and how did your pain begin? (a date is required for Medicare and some insurance policies) Date of onset:
 Date of onset:") C H I R O P R A C T I C O R T H O P E D I C S A N D R E H A B I L I T A T I O N ILJXAi Pain Relief Clinics Please complete all sections. Full Name: Nickname: Gender: M F Age: Race: Date of Birth: I I Family
C H I R O P R A C T I C O R T H O P E D I C S A N D R E H A B I L I T A T I O N ILJXAi Pain Relief Clinics Please complete all sections. Full Name: Nickname: Gender: M F Age: Race: Date of Birth: I I Family
London Obesity Leads Network Tuesday 6 th February 2018
 LONDON'S CHILD O BESITY TASKFORCE London Obesity Leads Network Tuesday 6 th February 2018 Matt Creamer Senior Policy Officer W H AT I S L O N D O N S C H I L D O B E S I T Y TA S K F O R C E To effect
Protocol between London MAPPA Strategic Management Board (SMB) and (Name of Borough) Local Safeguarding Children Board
 and (Name of Borough) Local Safeguarding Children Board") LONDON MULTI-AGENCY PUBLIC PROTECTION ARRANGEMENTS (MAPPA) Protocol between London MAPPA Strategic Management Board (SMB) and (Name of Borough) Local Safeguarding Children Board This protocol has been
LONDON MULTI-AGENCY PUBLIC PROTECTION ARRANGEMENTS (MAPPA) Protocol between London MAPPA Strategic Management Board (SMB) and (Name of Borough) Local Safeguarding Children Board This protocol has been
NI - INTEGRATED PUBLIC PROVISION OF HEALTH CARE SERVICES (P164452)
") LATIN AMERICA AND CARIBBEAN Nicaragua Health, Nutrition & Population Global Practice IBRD/IDA Investment Project Financing FY 2018 Seq No: 2 ARCHIVED on 26-Dec-2018 ISR35016 Implementing Agencies: Ministry
LATIN AMERICA AND CARIBBEAN Nicaragua Health, Nutrition & Population Global Practice IBRD/IDA Investment Project Financing FY 2018 Seq No: 2 ARCHIVED on 26-Dec-2018 ISR35016 Implementing Agencies: Ministry
Spatial Variation in Hospitalizations for Cardiometabolic Ambulatory Care Sensitive Conditions Across Canada
 Spatial Variation in Hospitalizations for Cardiometabolic Ambulatory Care Sensitive Conditions Across Canada CRDCN Conference November 14, 2017 Martin Cooke Alana Maltby Sarah Singh Piotr Wilk Today s
SUPPORTING A THRIVING UK LIFE SCIENCES ECOSYSTEM
 SUPPORTING A THRIVING UK LIFE SCIENCES ECOSYSTEM ABOUT THE AMERICAN PHARMACEUTICAL GROUP THE AMERICAN PHARMACEUTICAL GROUP REPRESENTS THE TEN LARGEST US RESEARCH- BASED BIO-PHARMACEUTICAL COMPANIES WITH
County Public Health Department. A practical guide, lessons learned and current projects in a small local health department
 Integrating ti GIS into the El Dorado County Public Health Department y p A practical guide, lessons learned and current projects in a small local health department Presentation Overview How we got GIS
CHAPTER 8 DECEASED (CADAVERIC) ORGAN AND TISSUE DONATION. Editor: Datin Dr Fadilah Zowyah Lela Yasmin Mansor Dr Hooi Lai Seong
 ORGAN AND TISSUE DONATION. Editor: Datin Dr Fadilah Zowyah Lela Yasmin Mansor Dr Hooi Lai Seong") CHAPTER 8 DECEASED (CADAVERIC) ORGAN AND TISSUE DONATION Editor: Datin Dr Fadilah Zowyah Lela Yasmin Mansor Dr Hooi Lai Seong Expert Panel Datin Dr Fadilah Zowyah Lela Yasmin Mansor (Chairperson) Dr Hooi
CHAPTER 8 DECEASED (CADAVERIC) ORGAN AND TISSUE DONATION Editor: Datin Dr Fadilah Zowyah Lela Yasmin Mansor Dr Hooi Lai Seong Expert Panel Datin Dr Fadilah Zowyah Lela Yasmin Mansor (Chairperson) Dr Hooi
The World Bank Health System Performance Reinforcement Project (P156679)
") Public Disclosure Authorized AFRICA Cameroon Health, Nutrition & Population Global Practice IBRD/IDA Investment Project Financing FY 2016 Seq No: 3 ARCHIVED on 14-Apr-2017 ISR27518 Implementing Agencies:
Public Disclosure Authorized AFRICA Cameroon Health, Nutrition & Population Global Practice IBRD/IDA Investment Project Financing FY 2016 Seq No: 3 ARCHIVED on 14-Apr-2017 ISR27518 Implementing Agencies:
Purpose Study conducted to determine the needs of the health care workforce related to GIS use, incorporation and training.
 GIS and Health Care: Educational Needs Assessment Cindy Gotz, MPH, CHES Janice Frates, Ph.D. Suzanne Wechsler, Ph.D. Departments of Health Care Administration & Geography California State University Long
Population, Housing and Employment Forecasts. Technical Report
 Population, Housing and Employment Forecasts Technical Report Population, Housing and Employment Forecasts Technical Report Research and Performance April 2013 A report by the Cambridgeshire County Council
National Spatial Development Perspective (NSDP) Policy Coordination and Advisory Service
 Policy Coordination and Advisory Service") National Spatial Development Perspective (NSDP) Policy Coordination and Advisory Service 1 BACKGROUND The advances made in the First Decade by far supersede the weaknesses. Yet, if all indicators were
National Spatial Development Perspective (NSDP) Policy Coordination and Advisory Service 1 BACKGROUND The advances made in the First Decade by far supersede the weaknesses. Yet, if all indicators were
General Ophthalmic Services Activity Statistics - England
 General Ophthalmic Services Activity Statistics - England Analysis of sight test patient eligibility data Copyright 2012, The Health and Social Care Information Centre, Dental and Eye Care Team. All Rights
C/W Qu: How is development measured? 13/6/12 Aim: To understand how development is typically measured/classified and the pros/cons of these
 C/W Qu: How is development measured? 13/6/12 Aim: To understand how development is typically measured/classified and the pros/cons of these Starter: Comment on this image Did you spot these? Rubbish truck
Neighborhood social characteristics and chronic disease outcomes: does the geographic scale of neighborhood matter? Malia Jones
 Neighborhood social characteristics and chronic disease outcomes: does the geographic scale of neighborhood matter? Malia Jones Prepared for consideration for PAA 2013 Short Abstract Empirical research
2011/04 LEUKAEMIA IN WALES Welsh Cancer Intelligence and Surveillance Unit
 2011/04 LEUKAEMIA IN WALES 1994-2008 Welsh Cancer Intelligence and Surveillance Unit Table of Contents 1 Definitions and Statistical Methods... 2 2 Results 7 2.1 Leukaemia....... 7 2.2 Acute Lymphoblastic
Keeping healthy when it is really hot
 Heatwave Plan for England Keeping healthy when it is really hot Easy Read version of: The Heatwave Plan for England: To protect the health of people from the effects of hot weather What is in this plan
La santé dans les villes : de l approche géographique aux collaborations entre chercheurs et décideurs
 La santé dans les villes : de l approche géographique aux collaborations entre chercheurs et décideurs Pr. Gérard Salem, Université Paris-Nanterre, ISUH-ICSu Séminaire Maladies Infectieuses Emergentes
GeoHealth Applications Platform ESRI Health GIS Conference 2013
 GeoHealth Applications Platform ESRI Health GIS Conference 2013 Authors Thomas A. Horan, Ph.D. Professor, CISAT Director April Moreno Health GeoInformatics Ph.D. Student Brian N. Hilton, Ph.D. Clinical
A STUDY OF HUMAN DEVELOPMENT APPROACH TO THE DEVELOPMENT OF NORTH EASTERN REGION OF INDIA
 ABSTRACT A STUDY OF HUMAN DEVELOPMENT APPROACH TO THE DEVELOPMENT OF NORTH EASTERN REGION OF INDIA Human development by emphasizing on capability approach differs crucially from the traditional approaches
David Rogers Health and Climate Foundation
 David Rogers Health and Climate Foundation Using environmental information Weather and Climate Informed Decisions Climate Information for Health Sector Decisions -
STAFF REPORT ACTION REQUIRED. Extreme Cold Weather Alerts in Toronto SUMMARY. Date: April 13, Board of Health. To: Medical Officer of Health
 HL3.6 STAFF REPORT ACTION REQUIRED Extreme Cold Weather Alerts in Toronto Date: April 13, 2015 To: From: Wards: Board of Health Medical Officer of Health All Reference Number: SUMMARY Cold weather can
Modelling Accessibility to General Hospitals in Ireland
 Modelling Accessibility to General Hospitals in Ireland Stamatis Kalogirou 1,*, Ronan Foley 2 1. National Centre for Geocomputation, John Hume Building, NUI Maynooth, Maynooth, Co. Kildare, Ireland, Tel:
WHO lunchtime seminar Mapping child growth failure in Africa between 2000 and Professor Simon I. Hay March 12, 2018
 WHO lunchtime seminar Mapping child growth failure in Africa between 2000 and 2015 Professor Simon I. Hay March 12, 2018 Outline Local Burden of Disease (LBD) at IHME Child growth failure From global to
Scottish Atlas of Variation
 Scottish Atlas of Variation User Guide March 2019 Contents Introduction... 3 Accessing the Atlas of Variation... 3 Dashboard... 4 Introduction... 4 Drop-down menus... 5 Explore icon... 5 Information icons...
Mapping and Health Equity Advocacy
 Mapping and Health Equity Advocacy Sarah Treuhaft PolicyLink November 7, 2008 About us PolicyLink National research and action institute that advances policies to achieve economic and social equity Center
Low-Income African American Women's Perceptions of Primary Care Physician Weight Loss Counseling: A Positive Deviance Study
 Thomas Jefferson University Jefferson Digital Commons Master of Public Health Thesis and Capstone Presentations Jefferson College of Population Health 6-25-2015 Low-Income African American Women's Perceptions
The Brimbank Spatial Map of Physical and Social Infrastructure (2017) Summary Report
 Summary Report") The Brimbank Spatial Map of Physical and Social Infrastructure (2017) Summary Report Photo: J Medallada Photography (2013) Growing Brimbank is a long-term collaborative program between Victoria University
The Brimbank Spatial Map of Physical and Social Infrastructure (2017) Summary Report Photo: J Medallada Photography (2013) Growing Brimbank is a long-term collaborative program between Victoria University
Poverty and Hazard Linkages
 Poverty and Hazard Linkages Global Risk Identification Programme Proposal Development Coordination Meeting Friday, 19 May 2006 CIESIN Earth Institute Columbia University www.ciesin.columbia.edu Data Improvements
CHAPTER 8. Editors: Dr Omar Sulaiman Dr Hooi Lai Seong
 CHAPTER 8 DECEASED (CADAVERIC) ORGAN Editors: Dr Omar Sulaiman Dr Hooi Lai Seong Expert Panel: Dr Omar Sulaiman (Chairperson) Dr Hooi Lai Seong Dr Rosnawati Yahya Dato' Dr Sharifah Suraya Syed Mohd Tahir
REPUBLIC OF ZAMBIA STATEMENT THE HONOURABLE LUCKY MULUSA, M.P., MINISTER OF NATIONAL DEVELOPMENT PLANNING,
 REPUBLIC OF ZAMBIA Permanent Mi$sion of Zambia to the United Nations, 237 East 52nd Street, New York, NY 10022 Tex: (212) 888-5770 Fax: (212) 888-5213 E-mail: zambia@un.int Please check against delivery
Spatial Trends of unpaid caregiving in Ireland
 Spatial Trends of unpaid caregiving in Ireland Stamatis Kalogirou 1,*, Ronan Foley 2 1. NCG Affiliate, Thoukididi 20, Drama, 66100, Greece; Tel: +30 6977 476776; Email: skalogirou@gmail.com; Web: http://www.gisc.gr.
Finding Common Ground Through GIS
 Finding Common Ground Through GIS Matthew Stone, MPH Special Unit for Technical Assistance Chronic Disease and Injury Control California Department of Public Health ESRI Health GIS Conference Scottsdale,
1Department of Demography and Organization Studies, University of Texas at San Antonio, One UTSA Circle, San Antonio, TX
 Well, it depends on where you're born: A practical application of geographically weighted regression to the study of infant mortality in the U.S. P. Johnelle Sparks and Corey S. Sparks 1 Introduction Infant
Designing smart & Resilient cities:
 Designing smart & Resilient cities: How can Egyptian cities learn from an emerging global practice On the Cuspof Change Professor Samer Bagaeen FRICS MRTPI FRSA AoU 1. GLOBAL CHALLENGES POPULATION GROWTH,
Measures from the Adult Social Care Outcomes Framework, England
 s from the Adult Social Care Outcomes Framework, England 2016-17 Guidance for using CSV file Published 25 October 2017 Copyright 2017 Health and Social Care Information Centre. The Health and Social Care
M e d i c a l P s y c h o l o g y U n i t, D e p a r t m e nt of C l i n i c a l N e u r o s c i e n c e s a n d M e n t a l H e a l t h Fa c u l t y
 R. Fonseca; M. Figueiredo-Braga M e d i c a l P s y c h o l o g y U n i t, D e p a r t m e nt of C l i n i c a l N e u r o s c i e n c e s a n d M e n t a l H e a l t h Fa c u l t y of M e d i c i n e,
VII APPROACHES IN SELECTING A CORE SET OF INDICATORS
 HANDBOOK ON RURAL HOUSEHOLDS LIVELIHOOD AND WELL-BEING VII APPROACHES IN SELECTING A CORE SET OF INDICATORS VII.1 Introduction In Chapters III to VI of this Handbook, and in associated annexes, numerous
Spirit Relationships - Suffering Caused By Spirit Interaction. Introduction
 Spirit Relationships - Suffering Caused By Spirit Interaction Introduction Questions to answer: Reminders about the soul and soul condition Reminders about the Law of Attraction What types of human suffering
Hot Weather Response Plan
 City of Greater Sudbury Hot Weather Response Plan For Public Release Version 1.3 July 2007 May 2009 Revised: May 2010 TABLE OF CONTENTS Introduction... 3 Essential Components... 4 Objectives... 4 Roles
Integration for Informed Decision Making
 Geospatial and Statistics Policy Intervention: Integration for Informed Decision Making Greg Scott Global Geospatial Information Management United Nations Statistics Division Department of Economic and
NHS Occupational Health Workforce Survey 2009
 NHS Occupational Health Workforce Survey 2009 Analysed by the Workforce Review Team NHS Occupational Health Workforce Survey 2009 Table of Contents 1. Foreword... 7 2. NHS Plus... 8 3. Executive summary...
May 14, MRC Capacity Gap Analysis Preliminary Results
 May 14, 2018 MRC Capacity Gap Analysis Preliminary Results Overview Determine current perceptions of the MRC program in Massachusetts Examine desired outcomes (by region) of the MRC program Supplement
Impact Evaluation of Rural Road Projects. Dominique van de Walle World Bank
 Impact Evaluation of Rural Road Projects Dominique van de Walle World Bank Introduction General consensus that roads are good for development & living standards A sizeable share of development aid and
A summary of the Local Climate Impacts Profile for Nottingham
 A summary of the Local Climate Impacts Profile for Nottingham Understanding the local impacts of extreme weather events on public services, places and people, helping us to prepare for future climate change
Developing Built Environment Indicators for Urban Oregon. Dan Rubado, MPH EPHT Epidemiologist Oregon Public Health Division
 Developing Built Environment Indicators for Urban Oregon Dan Rubado, MPH EPHT Epidemiologist Oregon Public Health Division What is the built environment? The built environment encompasses spaces and places
Geography - Grade 8. Unit A - Global Settlement: Patterns and Sustainability
 Geography - Grade 8 Geographical Thinking: Spatial Significance Patterns and Trends Interrelationships Geographic Perspective Geographic Inquiry: STEP 1 - Formulate Questions STEP 2 - Gather and Organize
TECHNICAL APPENDIX WITH ADDITIONAL INFORMATION ON METHODS AND APPENDIX EXHIBITS. Ten health risks in this and the previous study were
 Goetzel RZ, Pei X, Tabrizi MJ, Henke RM, Kowlessar N, Nelson CF, Metz RD. Ten modifiable health risk factors are linked to more than one-fifth of employer-employee health care spending. Health Aff (Millwood).
Key Indicators for Territorial Cohesion and Spatial Planning in Preparing Territorial Development Strategies
 ESPON Evidence in a North European Context Challenges and Opportunities for Territorial Development and Cohesion in a North European Macro Region, 10-11 April, 2014, Vilnius, Lithuania Key Indicators for
THEMATIC MAPPING OF HEALTH
 CO-187 THEMATIC MAPPING OF HEALTH CEDERIN K. Lund University, MALMÖ, SWEDEN Thematic mapping with GIS in social/community medicine research has quite a history in Sweden. Due to exceptional circumstances
The Church Demographic Specialists
 The Church Demographic Specialists Easy-to-Use Features Map-driven, Web-based Software An Integrated Suite of Information and Query Tools Providing An Insightful Window into the Communities You Serve Key
Street mobility and network accessibility: towards tools for overcoming barriers to walking amongst older people
 Community Severance Glossary Part 1 of this glossary contains terms used by different academic disciplines when studying the problem of community severance and related issues. Part 2 contains entries for
Public Disclosure Copy
 Public Disclosure Authorized AFRICA Malawi Transport & Digital Development Global Practice IBRD/IDA Investment Project Financing FY 2017 Seq No: 2 ARCHIVED on 23-May-2018 ISR32537 Implementing Agencies:
Sindh Enhancing Response to Reduce Stunting (P161624)
") Public Disclosure Authorized SOUTH ASIA Pakistan Health, Nutrition & Population Global Practice IBRD/IDA Investment Project Financing FY 2017 Seq No: 3 ARCHIVED on 01-Oct-2018 ISR33776 Implementing Agencies:
Public Disclosure Authorized SOUTH ASIA Pakistan Health, Nutrition & Population Global Practice IBRD/IDA Investment Project Financing FY 2017 Seq No: 3 ARCHIVED on 01-Oct-2018 ISR33776 Implementing Agencies:
Population Profiles
 U N D E R S T A N D I N G A N D E X P L O R I N G D E M O G R A P H I C C H A N G E MAPPING AMERICA S FUTURES, BRIEF 6 2000 2010 Population Profiles Atlanta, Las Vegas, Washington, DC, and Youngstown Allison
Implementation Status & Results Brazil Integrated Health and Water Management Project (SWAP) (P095171)
 (P095171)") Public Disclosure Authorized Public Disclosure Authorized The World Bank Implementation Status & Results Brazil Integrated Health and Water Management Project (SWAP) (P095171) Operation Name: Integrated
Public Disclosure Authorized Public Disclosure Authorized The World Bank Implementation Status & Results Brazil Integrated Health and Water Management Project (SWAP) (P095171) Operation Name: Integrated
A Framework for the Study of Urban Health. Abdullah Baqui, DrPH, MPH, MBBS Johns Hopkins University
 This work is licensed under a Creative Commons Attribution-NonCommercial-ShareAlike License. Your use of this material constitutes acceptance of that license and the conditions of use of materials on this
ikapa GDS White Paper Governance and Integration Department of the Premier Department of the Premier 2 December 2008
 ikapa GDS White Paper Governance and Integration Outline of presentation Western Cape Situation Strategic Framework Implementation Framework Alignment and implementation example Diversified economy Small
 Table 1. Answers to income and consumption adequacy questions Percentage of responses: less than adequate more than adequate adequate Total income 68.7% 30.6% 0.7% Food consumption 46.6% 51.4% 2.0% Clothing
KUNMING FORUM ON UNITED NATIONS GLOBAL GEOSPATIAL INFORMATION MANAGEMENT CITIES OF THE FUTURE: SMART, RESILIENT
 KUNMING FORUM ON UNITED NATIONS GLOBAL GEOSPATIAL INFORMATION MANAGEMENT CITIES OF THE FUTURE: SMART, RESILIENT and SUSTAINABLE Yunnan Zhenzhuang Guest House, Kunming, China 10 12 May 2017 BACKGROUND CONCEPT
Effective Use of Geographic Maps
 Effective Use of Geographic Maps Purpose This tool provides guidelines and tips on how to effectively use geographic maps to communicate research findings. Format This tool provides guidance on geographic
Big-Geo-Data EHR Infrastructure Development for On-Demand Analytics
 Big-Geo-Data EHR Infrastructure Development for On-Demand Analytics Sohayla Pruitt, MA Senior Geospatial Scientist Duke Medicine DUHS DHTS EIM HIRS Page 1 Institute of Medicine, World Health Organization,
The World Bank CG Rep. LISUNGI Safety Nets System Project (P145263)
") Public Disclosure Authorized AFRICA Congo, Republic of Social Protection & Labor Global Practice IBRD/IDA Investment Project Financing FY 2014 Seq No: 7 ARCHIVED on 04-Dec-2017 ISR30246 Implementing Agencies:
Public Disclosure Authorized AFRICA Congo, Republic of Social Protection & Labor Global Practice IBRD/IDA Investment Project Financing FY 2014 Seq No: 7 ARCHIVED on 04-Dec-2017 ISR30246 Implementing Agencies:
The World Bank BiH Floods Emergency Recovery Project (P151157)
") EUROPE AND CENTRAL ASIA Bosnia and Herzegovina Social, Urban, Rural and Resilience Global Practice Global Practice IBRD/IDA Investment Project Financing FY 2014 Seq No: 4 ARCHIVED on 22-Jun-2016 ISR22737
EUROPE AND CENTRAL ASIA Bosnia and Herzegovina Social, Urban, Rural and Resilience Global Practice Global Practice IBRD/IDA Investment Project Financing FY 2014 Seq No: 4 ARCHIVED on 22-Jun-2016 ISR22737
Opportunities and challenges of HCMC in the process of development
 Opportunities and challenges of HCMC in the process of development Lê Văn Thành HIDS HCMC, Sept. 16-17, 2009 Contents The city starting point Achievement and difficulties Development perspective and goals
EUROPEAN INVESTMENT BANK
 EUROPEAN INVESTMENT BANK RISC Consortium and the UNU-CRIS Summer School/ Students Research Symposium, 3 rd July 2012, Luxembourg Regional Projects good practice? Kamil Dörfler 1 Outline General background
BIRTH CHART XXXXXXXX. Date of Birth XXXXXXXX. Time of Birth XXXXXX, XXXXXX. Place of Birth. Scorpio (Vritchika) Lagna/Ascendant. Birth Star Rohini - 2
 Lagna/Ascendant. Birth Star Rohini - 2") Vedic Astrology Report HEALTH REPORT Name Date of Birth Time of Birth Place of Birth Lagna/Ascendant XXXXXX, XXXXXX Scorpio (Vritchika) Birth Star Rohini - 2 Rasi (Moon Sign) Sun Sign Gender Marital status
Vedic Astrology Report HEALTH REPORT Name Date of Birth Time of Birth Place of Birth Lagna/Ascendant XXXXXX, XXXXXX Scorpio (Vritchika) Birth Star Rohini - 2 Rasi (Moon Sign) Sun Sign Gender Marital status
Maggie M. Kovach. Department of Geography University of North Carolina at Chapel Hill
 Maggie M. Kovach Department of Geography University of North Carolina at Chapel Hill Rationale What is heat-related illness? Why is it important? Who is at risk for heat-related illness and death? Urban
Enrollment of Students with Disabilities
 Enrollment of Students with Disabilities State legislation, which requires the Board of Higher Education to monitor the participation of specific groups of individuals in public colleges and universities,
UN-GGIM: Strengthening Geospatial Capability
 Fifth Plenary Meeting of UN-GGIM: Europe Brussels, 6-7 June 2018 UN-GGIM: Strengthening Geospatial Capability Walking the talk to leave no one behind Greg Scott, UN-GGIM Secretariat Environmental Statistics
Integrated Infrastructure Planning & Spatial Mapping
 Integrated Infrastructure Planning & Spatial Mapping Presenter: Heidi Dixon, Principal Social Planner, DTPLI 23 May 2014 PART 1 PLAN MELBOURNE : Metropolitan Planning Strategy PART 2 Case Study: DTPLI
Indicators of sustainable development: framework and methodologies CSD Indicators of sustainable development 1996
 Indicators of sustainable development: framework and methodologies CSD Indicators of sustainable development 1996 Keywords: mountain areas, mountain development, natural resources management, sustainable
8 th Meeting of IAEG-SDGs 5 8 November 2018, Stockholm, Sweden. Meetings. Report
 Meetings 8 th Meeting of IAEG-SDGs Between April 2018 and November 2018, the Working Group on Geospatial Information of the IAEG- SDGs held two online meetings; presented a report to the United Nations
Healthy Cities. Lecture 4 Planning and Regeneration, Sustainable and Healthy. Opening Address
 Healthy Cities Lecture 4 Planning and Regeneration, Sustainable and Healthy Opening Address Suzanne Wylie Director of Health and Environmental Services, Belfast City Council Belfast The Past The Present
MORTALITY DIFFERENCES BETWEEN THE SUBREGIONS OF HUNGARY * ANDRÁS KLINGER
 MORTALITY DIFFERENCES BETWEEN THE SUBREGIONS OF HUNGARY * ANDRÁS KLINGER INTRODUCTION Regional differences in Hungary have long been the subject of research. Analyses have been so far either based on larger
LIVERPOOL GREEN INFRASTRUCTURE STRATEGY TECHNICAL DOCUMENT VERSION 1.0
 LIVERPOOL GREEN INFRASTRUCTURE STRATEGY TECHNICAL DOCUMENT VERSION 1.0 1 CONTENTS 1. INTRODUCTION AND BACKGROUND... 14 1.1. Introduction... 14 1.2. Project Outcomes... 16 1.3. Project Outputs... 17 2.
Maps, Graphs and Metrics: How Local Agencies Put Data to Work. Vivien Deparday Manager of the Community Information and Mapping System June 20, 2012
 Maps, Graphs and Metrics: How Local Agencies Put Data to Work Vivien Deparday Manager of the Community Information and Mapping System June 20, 2012 Social Planning Council of Ottawa Small non-profit organization
Measuring Disaster Risk for Urban areas in Asia-Pacific
 Measuring Disaster Risk for Urban areas in Asia-Pacific Acknowledgement: Trevor Clifford, Intl Consultant 1 SDG 11 Make cities and human settlements inclusive, safe, resilient and sustainable 11.1: By
Mapping the Route Identifying and Consulting with HS2 s Impacted Populations
 Tuesday 6 December 2016 Mapping the Route Identifying and Consulting with HS2 s Impacted Populations Carry Stephenson, Evelyn Robertson SYSTRA Michael Flynn HS2 Summary Study Context and Objectives Methodology
2011 Clendening Summer Fellowship Proposal. Describing the Patient Experience Using Geographic Information Systems
 2011 Clendening Summer Fellowship Proposal Describing the Patient Experience Using Geographic Information Systems Introduction The following proposal outlines my project for a 2011 Clendening Summer Fellowship.
Prof Chryssy Potsiou, FIG President
 THE VALUE OF GEOSPATIAL DATA AND ROLE OF SURVEYORS IN SUSTAINABLE DEVELOPMENT Prof Chryssy Potsiou, FIG President National Technical University of Athens School of Rural and Surveying Engineering, Greece
Supplementary Material
 1 ORIGINAL RESEARCH ARTICLE Pharmacoeconomics 2008; 26 (1): Supplementary Material 1170-7690/08/001-0001/$48.00/0 2008 Adis Data Information BV. All rights reserved. Economic Burden of Bilateral Neovascular