Spatial segregation and socioeconomic inequalities in health in major Brazilian cities. An ESRC pathfinder project
|
|
|
- Bethanie Cummings
- 6 years ago
- Views:
Transcription

1 Spatial segregation and socioeconomic inequalities in health in major Brazilian cities An ESRC pathfinder project

2 Income per head and life-expectancy: rich & poor countries Source: Wilkinson & Pickett, The Spirit Level (2009)

3 Male mortality (25-64 yrs) and income inequality in US states and Canadian provinces. Source: Ross NA, Wolfson MC, Dunn JR, Berthelot JM, Kaplan GA, Lynch JW. British Medical Journal 2000;320:
4 Life expectancy and income inequality: Brazil, 2000
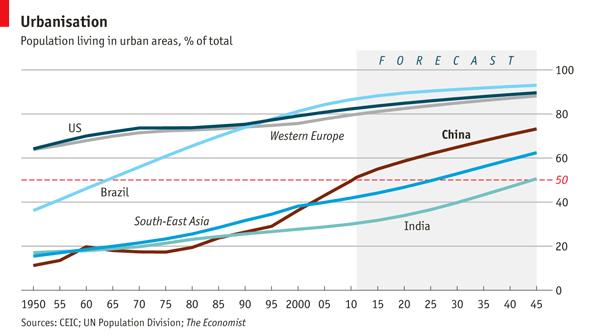
5 Increasing urbanisation in developing countries

6 Share of slum population in urban areas in selected Asian and Pacific countries 1990 and

7 In most parts of the world, the proportion of urban populations living in slums has decreased

8 At the same time, the absolute number of slum dwellers around the world is still rising
9

10 Most slum households in Brazil live in slum neighbourhoods

11 Brazil has a low Human Opportunity Index compared to other Latin American countries with similar GDP per capita The Human Opportunity Index (HOI) measures the likelihood that children from different backgrounds, or in different combinations of circumstances, will be able to access the basic services they need. Barros et al. (2006)
12 Spatial Inequalities and Development Despite having a relatively high GDP per capita, Brazilian cities are highly unequal - urbanisation and concentration of economic activity - spatial concentration of affluence reproduces privileges of the rich - spatial concentration of poverty results in segregation, involuntary clustering in ghettos Effects on population health and premature mortality/morbidity? Triple health jeopardy: being poor in a poor neighbourhood that is spatially isolated from life-enhancing opportunities Nancy A Ross
13 Socioeconomic segregation and the Spatial poverty trap - Severe job restriction - Gender disparities - Worsening living conditions - Social exclusion and marginalisation - Lack of social interaction - High incidence of crime
14 Dimensions of segregation Evenness: the unequal distribution of social groups across areal units of an urban area. Index of Dissimilarity Exposure: the degree of potential contact between groups within neighborhoods of a city. Index of Isolation and Exposure Clustering: extent to which areas inhabited by minority members adjoin one another in space. Index of clustering Centralization: the degree to which a group is located near the centre of an urban area. Index of centralisation Concentration: the relative amount of physical space occupied by a minority group in the urban environment. Index of concentration However, these indices are aspatial measures.
15 EVENNESS ISOLATION EXPOSURE CLUSTERING Dimensions of spatial segregation Sean F. Reardon & David O'Sullivan. Measures of Spatial Segregation V. 34, n.1, p , 2004 Sociological Methodology.
16 Dimensions of spatial segregation EVENNESS ISOLATION EXPOSURE CLUSTERING
17 EXPOSURE/ISOLATION DIMENSION SPATIAL EXPOSURE INDEX SPATIAL ISOLATION INDEX Feitosa, F. F.; Câmara, G.;Monteiro, A. M. V.; Koschitzki, T.; Silva, M. P. S., Global and local spatial indices of urban segregation. International Journal of Geographical Information Science; Mar2007, Vol. 21 Issue 3, p ,
18 Transform aspatial segregation measures into spatial measures Localities: An urban area has different localities where people live and exchange experiences with their neighbours. Measure the intensity of these exchanges by assuming this intensity varies by the spatial distance between population groups. Each locality has a core: geometrical centroid of an areal unit. The population characteristics of the locality are expressed by its local population intensity. Use a kernel function and a bandwidth parameter to estimate this local population intensity.
19 Spatial clustering index: -The percentage of the low income census tracts within a district that are surrounded by other low income census tracts. -The index varies from 0% to 100% -0%: there are no low income census tracts surrounded by other low income census tracts in the district -100%: all the census tracts in the district are low income census tracts surrounded by other low income census tracts

20 Brazilian regions, states and selected cities North Teresina Northeast Natal João Pessoa Recife Aracaju Central-West Campo Grande Brasília Rio de Janeiro Curitiba Southeast Porto Alegre South
21 Isolation Index Spatial Isolation Index Income groups
22 EVENNESS ISOLATION EXPOSURE CLUSTERING Dimensions of spatial segregation


23 Spatially lagged variable Spatial CLUSTERING INDEX Moran Scatter Plot Moran Cluster Map SLOPE OF THE REGRESSION LINE Variable to be lagged, standardized

24 Spatial CLUSTERING INDEX Within each district, the Spatial Clustering Index is the proportion of census tracts that are low income tracts and are surrounded by other low income tracts.
25 EVENNESS ISOLATION EXPOSURE CLUSTERING Dimensions of spatial segregation

26 Local Spatial Isolation Indexes >20 ms ms Income Groups BW:400m ms: minimum salaries <2ms 2-5 ms 5-10 ms
 Distribution of income of")

27 INCOME Moran I Index: 0.65 ( ρ< ) Distribution of income of the head of the household by district, Porto Alegre, Source: IBGE
 for 861 districts within 15 Brazilian")
28 Outcome variable: Standardised Mortality Rates (age and sex adjusted) for 861 districts within 15 Brazilian cities

29 Scatterplot of Standardised Mortality Rates by Poverty Rate in Brazilian Districts

30 Scatterplot of Spatial Clustering by Poverty Rate in Brazilian Districts

31 Scatterplot of Spatial Isolation of the poor by Poverty Rate in Brazilian Districts
32 Multiple membership models These are models where each level 1 unit is a member of more than one higher level unit. For example, Pupils change schools/classes and each school/class has an effect on pupil outcomes. Patients are seen by more than one nurse during the course of their treatment. Counties are bordered by more than one other neighbouring county
33 Multilevel Multiple Membership Model of Mortality Rate: Variance Components Model
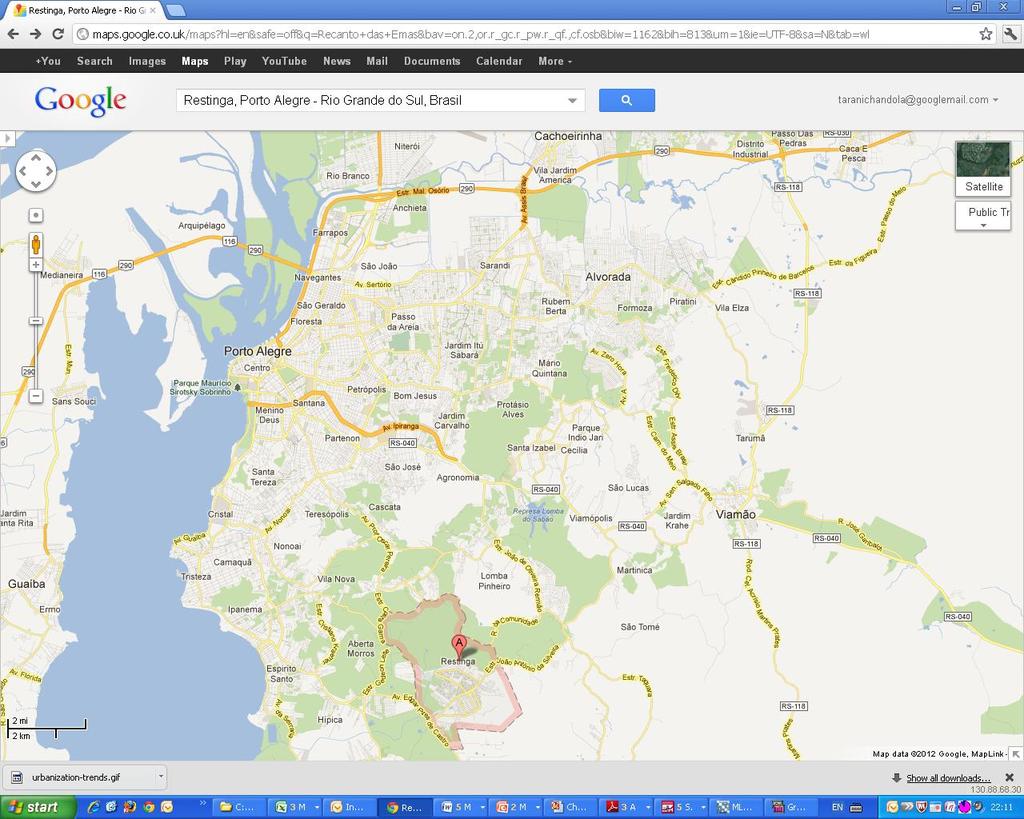
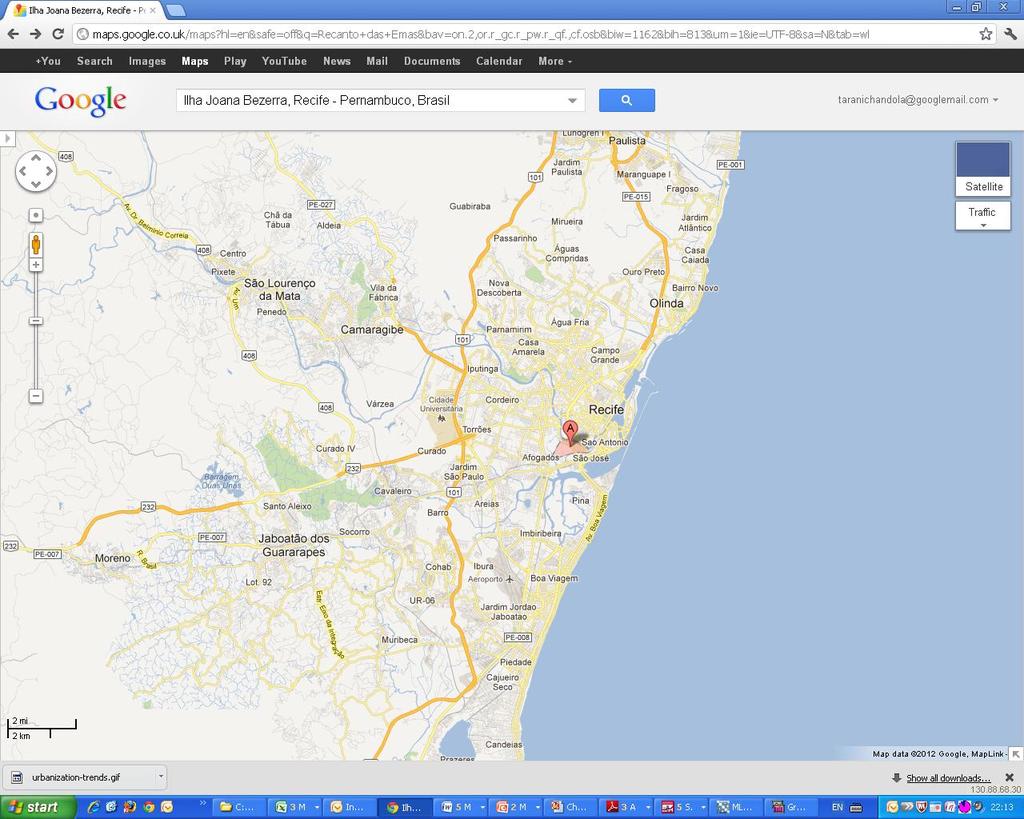
34 Predicted SMR by Spatial Clustering Index and Region South/South East and Central West Regions Restinga, Porto Alegre SMR North East Region Ilha Joana Bezerra, Recife Northern Region Paracuri, Belém Spatial clustering Index Adjusted for Population Size and Poverty Rate in the District
35
36
37
38 Discussion: - Triple health jeopardy - revisited? Living in a poor neighbourhood that is spatially segregated, in a developing city - Living in a rich city is not protective (of mortality risk) if you live in a spatially segregated neighbourhood - Implications for urban development and slum resettlement in other developing countries

39 Slum clearances in Rio de Janeiro in preparation for the Olympics
40 Summary - Districts in Brazil with higher poverty rates have higher mortality rates - Districts where the poor are clustered also have higher mortality rates - Interaction between Region and Spatial Clustering: The association of clustering with mortality is strongest in cities in the richest (Southern) regions - Increasing the spatial isolation of the poor within rich cities could result in poorer health and lower life expectancy.
Keywords: Urban segregation; income segregation, income inequality, health inequalities
 The spatial segregation of poverty is associated with higher mortality in Porto Alegre, Brazil Sergio Bassanesi, Departamento de Medicina Social, Universidade Federal do Rio Grande do Sul Michael Marmot,
Global and Local Spatial Indices of Urban Segregation
 Global and Local Spatial Indices of Urban Segregation FLÁVIA F. FEITOSA, GILBERTO CÂMARA, ANTÔNIO M. V. MONTEIRO, THOMAS KOSCHITZKI, MARCELINO P. S. SILVA INPE - Instituto Nacional de Pesquisas Espaciais.
1Department of Demography and Organization Studies, University of Texas at San Antonio, One UTSA Circle, San Antonio, TX
 Well, it depends on where you're born: A practical application of geographically weighted regression to the study of infant mortality in the U.S. P. Johnelle Sparks and Corey S. Sparks 1 Introduction Infant
To link to this article: DOI: / URL:
 This article was downloaded by:[ibict INPE] [IBICT INPE] On: 16 March 2007 Access Details: [subscription number 739752068] Publisher: Taylor & Francis Informa Ltd Registered in England and Wales Registered
Vanessa Nadalin Lucas Mation IPEA - Institute for Applied Economic Research Regional Studies Association Global Conference Fortaleza 2014
 Spatial distribution of sanitation and income inequality in Brazilian Slums Vanessa Nadalin Lucas Mation IPEA - Institute for Applied Economic Research Regional Studies Association Global Conference Fortaleza
Uneven geographies: exploring the sensitivity of spatial indices of residential segregation
 Uneven geographies: exploring the sensitivity of spatial indices of residential segregation Joana Barros 1, Flavia F. Feitosa 2 1 Department of Geography, Birkbeck, University of London, UK. Malet Street,
Links between socio-economic and ethnic segregation at different spatial scales: a comparison between The Netherlands and Belgium
 Links between socio-economic and ethnic segregation at different spatial scales: a comparison between The Netherlands and Belgium Bart Sleutjes₁ & Rafael Costa₂ ₁ Netherlands Interdisciplinary Demographic
GIS in Locating and Explaining Conflict Hotspots in Nepal
 GIS in Locating and Explaining Conflict Hotspots in Nepal Lila Kumar Khatiwada Notre Dame Initiative for Global Development 1 Outline Brief background Use of GIS in conflict study Data source Findings
Maggie M. Kovach. Department of Geography University of North Carolina at Chapel Hill
 Maggie M. Kovach Department of Geography University of North Carolina at Chapel Hill Rationale What is heat-related illness? Why is it important? Who is at risk for heat-related illness and death? Urban
Medical GIS: New Uses of Mapping Technology in Public Health. Peter Hayward, PhD Department of Geography SUNY College at Oneonta
 Medical GIS: New Uses of Mapping Technology in Public Health Peter Hayward, PhD Department of Geography SUNY College at Oneonta Invited research seminar presentation at Bassett Healthcare. Cooperstown,
Apéndice 1: Figuras y Tablas del Marco Teórico
 Apéndice 1: Figuras y Tablas del Marco Teórico FIGURA A.1.1 Manufacture poles and manufacture regions Poles: Share of employment in manufacture at least 12% and population of 250,000 or more. Regions:
Spatial index of educational opportunities: Rio de Janeiro and Belo Horizonte
 Available online at www.sciencedirect.com Procedia Social and Behavioral Sciences 21 (2011) 287 293 International Conference: Spatial Thinking and Geographic Information Sciences 2011 Spatial index of
Where Do Overweight Women In Ghana Live? Answers From Exploratory Spatial Data Analysis
 Where Do Overweight Women In Ghana Live? Answers From Exploratory Spatial Data Analysis Abstract Recent findings in the health literature indicate that health outcomes including low birth weight, obesity
Ethnic and socioeconomic segregation in Belgium A multi-scalar approach using individualised neighbourhoods
 Ethnic and socioeconomic segregation in Belgium A multi-scalar approach using individualised neighbourhoods Rafael Costa and Helga de Valk PAA 2016 Annual Meeting Extended abstract (Draft: please do not
Social Vulnerability Index. Susan L. Cutter Department of Geography, University of South Carolina
 Social Vulnerability Index Susan L. Cutter Department of Geography, University of South Carolina scutter@sc.edu Great Lakes and St. Lawrence Cities Initiative Webinar December 3, 2014 Vulnerability The
Opportunities and challenges of HCMC in the process of development
 Opportunities and challenges of HCMC in the process of development Lê Văn Thành HIDS HCMC, Sept. 16-17, 2009 Contents The city starting point Achievement and difficulties Development perspective and goals
Measuring Disaster Risk for Urban areas in Asia-Pacific
 Measuring Disaster Risk for Urban areas in Asia-Pacific Acknowledgement: Trevor Clifford, Intl Consultant 1 SDG 11 Make cities and human settlements inclusive, safe, resilient and sustainable 11.1: By
Everything is related to everything else, but near things are more related than distant things.
 SPATIAL ANALYSIS DR. TRIS ERYANDO, MA Everything is related to everything else, but near things are more related than distant things. (attributed to Tobler) WHAT IS SPATIAL DATA? 4 main types event data,
Migration Clusters in Brazil: an Analysis of Areas of Origin and Destination Ernesto Friedrich Amaral
 1 Migration Clusters in Brazil: an Analysis of Areas of Origin and Destination Ernesto Friedrich Amaral Research question and data The main goal of this research is to analyze whether the pattern of concentration
Assessing Social Vulnerability to Biophysical Hazards. Dr. Jasmine Waddell
 Assessing Social Vulnerability to Biophysical Hazards Dr. Jasmine Waddell About the Project Built on a need to understand: The pre-disposition of the populations in the SE to adverse impacts from disaster
Neighborhood social characteristics and chronic disease outcomes: does the geographic scale of neighborhood matter? Malia Jones
 Neighborhood social characteristics and chronic disease outcomes: does the geographic scale of neighborhood matter? Malia Jones Prepared for consideration for PAA 2013 Short Abstract Empirical research
Stability, Ability and Equity
 Stability, Ability and Equity Mobility and Protection in the Urban Context Arup Banerji Senior Director and Head of Global Practice, Social Protection and Labor The World Bank Group 1 ECONOMIC MOBILITY
Secondary Towns, Population and Welfare in Mexico
 Public Disclosure Authorized Public Disclosure Authorized Public Disclosure Authorized Secondary Towns, Population and Welfare in Mexico Isidro Soloaga Department of Economics, Universidad Iberoamericana,
Guilty of committing ecological fallacy?
 GIS: Guilty of committing ecological fallacy? David W. Wong Professor Geography and GeoInformation Science George Mason University dwong2@gmu.edu Ecological Fallacy (EF) Many slightly different definitions
Urban Scaling Laws: Foundations, Implications, Gaps. Somwrita Sarkar University of Sydney
 Urban Scaling Laws: Foundations, Implications, Gaps Somwrita Sarkar University of Sydney Cities as complex systems Physically, socially, economically, cities manifest as regularities, in spite of different
CRP 608 Winter 10 Class presentation February 04, Senior Research Associate Kirwan Institute for the Study of Race and Ethnicity
 CRP 608 Winter 10 Class presentation February 04, 2010 SAMIR GAMBHIR SAMIR GAMBHIR Senior Research Associate Kirwan Institute for the Study of Race and Ethnicity Background Kirwan Institute Our work Using
Does city structure cause unemployment?
 The World Bank Urban Research Symposium, December 15-17, 2003 Does city structure cause unemployment? The case study of Cape Town Presented by Harris Selod (INRA and CREST, France) Co-authored with Sandrine
Jun Tu. Department of Geography and Anthropology Kennesaw State University
 Examining Spatially Varying Relationships between Preterm Births and Ambient Air Pollution in Georgia using Geographically Weighted Logistic Regression Jun Tu Department of Geography and Anthropology Kennesaw
Climate and Health Vulnerability & Adaptation Assessment Profile Manaus - Brazil
 Climate and Health Vulnerability & Adaptation Assessment Profile Manaus - Brazil Christovam Barcellos (ICICT/Fiocruz) Diego Xavier Silva (ICICT/Fiocruz) Rita Bacuri (CPqLMD/Fiocruz) Assessment Objectives
TUESDAYS AT APA PLANNING AND HEALTH. SAGAR SHAH, PhD AMERICAN PLANNING ASSOCIATION SEPTEMBER 2017 DISCUSSING THE ROLE OF FACTORS INFLUENCING HEALTH
 SAGAR SHAH, PhD sshah@planning.org AMERICAN PLANNING ASSOCIATION SEPTEMBER 2017 TUESDAYS AT APA PLANNING AND HEALTH DISCUSSING THE ROLE OF FACTORS INFLUENCING HEALTH Outline of the Presentation PLANNING
ESRI 2008 Health GIS Conference
 ESRI 2008 Health GIS Conference An Exploration of Geographically Weighted Regression on Spatial Non- Stationarity and Principal Component Extraction of Determinative Information from Robust Datasets A
Spatial Variation in Hospitalizations for Cardiometabolic Ambulatory Care Sensitive Conditions Across Canada
 Spatial Variation in Hospitalizations for Cardiometabolic Ambulatory Care Sensitive Conditions Across Canada CRDCN Conference November 14, 2017 Martin Cooke Alana Maltby Sarah Singh Piotr Wilk Today s
Spatial Disparities and Development Policy in the Philippines
 Spatial Disparities and Development Policy in the Philippines Arsenio M. Balisacan University of the Philipppines Diliman & SEARCA Email: arsenio.balisacan@up.edu.ph World Development Report 2009 (Reshaping
(Department of Urban and Regional planning, Sun Yat-sen University, Guangzhou , China)
") DOI:10.13959/j.issn.1003-2398.2008.05.001 :1003-2398(2008)05-0061-06, (, 510275) RESIDENTIAL SEGREGATION OF FLOATING POPULATION AND DRIVING FORCES IN GUANGZHOU CITY YUAN Yuan, XU Xue-qiang (Department
DOI:10.13959/j.issn.1003-2398.2008.05.001 :1003-2398(2008)05-0061-06, (, 510275) RESIDENTIAL SEGREGATION OF FLOATING POPULATION AND DRIVING FORCES IN GUANGZHOU CITY YUAN Yuan, XU Xue-qiang (Department
Summary Article: Poverty from Encyclopedia of Geography
 Topic Page: Poverty Definition: poverty from Dictionary of Energy Social Issues. the fact of being poor; the absence of wealth. A term with a wide range of interpretations depending on which markers of
Geographical Inequalities and Population Change in Britain,
 Geographical Inequalities and Population Change in Britain, 1971-2011 Chris Lloyd, Nick Bearman, Gemma Catney Centre for Spatial Demographics Research, University of Liverpool, UK Email: c.d.lloyd@liverpool.ac.uk
Running head: GEOGRAPHICALLY WEIGHTED REGRESSION 1. Geographically Weighted Regression. Chelsey-Ann Cu GEOB 479 L2A. University of British Columbia
 Running head: GEOGRAPHICALLY WEIGHTED REGRESSION 1 Geographically Weighted Regression Chelsey-Ann Cu 32482135 GEOB 479 L2A University of British Columbia Dr. Brian Klinkenberg 9 February 2018 GEOGRAPHICALLY
National Spatial Development Perspective (NSDP) Policy Coordination and Advisory Service
 Policy Coordination and Advisory Service") National Spatial Development Perspective (NSDP) Policy Coordination and Advisory Service 1 BACKGROUND The advances made in the First Decade by far supersede the weaknesses. Yet, if all indicators were
National Spatial Development Perspective (NSDP) Policy Coordination and Advisory Service 1 BACKGROUND The advances made in the First Decade by far supersede the weaknesses. Yet, if all indicators were
GEOGRAPHY Practice Answer Paper - 2
 GEOGRAPHY Practice Answer Paper - 2 Q.1) Select the correct option and rewrite the sentence : 4 1) According to Census 2011, the average population density of India is 382 persons per sq.km. 2) The rate
Population health across space & time: geographical harmonisation of the ONS Longitudinal Study for England & Wales
 British Society for Population Studies Annual Conference, York, September 2011 Population health across space & time: geographical harmonisation of the ONS Longitudinal Study for England & Wales Paul Norman
Urban land value, Accessibility and Night Light Data: A Case Study in China
 309-Paper Urban land value, Accessibility and Night Light Data: A Case Study in China Sumeeta Srinivasan, and Deng Yu Abstract In this paper, we use night light imagery data at two scales the city and
A Case Study of Regional Dynamics of China 中国区域动态案例研究
 A Case Study of Regional Dynamics of China 中国区域动态案例研究 Shuming Bao Spatial Data Center & China Data Center University of Michigan 1:00 PM - 2:00 PM, Tue, Feb 6, 2018 EST USA A Case Study of Regional Dynamics
Developing a global, peoplebased definition of cities and settlements
 Developing a global, peoplebased definition of cities and settlements By Lewis Dijkstra, Lewis.Dijkstra@ec.europa.eu Head of the Economic Analysis Sector DG for Regional and Urban Policy, Regional & Urban
Regional and demographic determinants of poverty in Brazil
 Regional and demographic determinants of poverty in Brazil Andre P. Souza Carlos R. Azzoni Veridiana A. Nogueira University of Sao Paulo, Brazil 1. Introduction Poor areas could be so because they concentrate
Reshaping Economic Geography
 Reshaping Economic Geography Three Special Places Tokyo the biggest city in the world 35 million out of 120 million Japanese, packed into 4 percent of Japan s land area USA the most mobile country More
Modeling the Ecology of Urban Inequality in Space and Time
 Modeling the Ecology of Urban Inequality in Space and Time Corina Graif PhD Candidate, Department Of Sociology Harvard University Presentation for the Workshop on Spatial and Temporal Modeling, Center
R E SEARCH HIGHLIGHTS
 Canada Research Chair in Urban Change and Adaptation R E SEARCH HIGHLIGHTS Research Highlight No.8 November 2006 THE IMPACT OF ECONOMIC RESTRUCTURING ON INNER CITY WINNIPEG Introduction This research highlight
CONSTRUCTING THE POVERTY AND OPPORTUNITIES/PUBLIC SERVICES MAPS INFORMATION MANAGEMENT. Background: Brazil Without Extreme Poverty Plan
 INFORMATION MANAGEMENT CONSTRUCTING THE POVERTY AND OPPORTUNITIES/PUBLIC SERVICES MAPS Background: Brazil Without Extreme Poverty Plan The Brazil Without Extreme Poverty Plan (BSM), designed to overcome
Non-parametric bootstrap and small area estimation to mitigate bias in crowdsourced data Simulation study and application to perceived safety
 Non-parametric bootstrap and small area estimation to mitigate bias in crowdsourced data Simulation study and application to perceived safety David Buil-Gil, Reka Solymosi Centre for Criminology and Criminal
GIS (GEOGRAPHICAL INFORMATION SYSTEMS) AS A FACILITATION TOOL FOR SUSTAINABLE DEVELOPMENT IN AFRICA
 AS A FACILITATION TOOL FOR SUSTAINABLE DEVELOPMENT IN AFRICA") GIS (GEOGRAPHICAL INFORMATION SYSTEMS) AS A FACILITATION TOOL FOR SUSTAINABLE DEVELOPMENT IN AFRICA a presentation by Elizabeth Hicken GDEST Conference on Geospatial Sciences for Sustainable Development
GIS (GEOGRAPHICAL INFORMATION SYSTEMS) AS A FACILITATION TOOL FOR SUSTAINABLE DEVELOPMENT IN AFRICA a presentation by Elizabeth Hicken GDEST Conference on Geospatial Sciences for Sustainable Development
Environmental Analysis, Chapter 4 Consequences, and Mitigation
 Environmental Analysis, Chapter 4 4.17 Environmental Justice This section summarizes the potential impacts described in Chapter 3, Transportation Impacts and Mitigation, and other sections of Chapter 4,
Rencontres de l Hôtel Dieu Paris,12-13 mai C. Padilla, B Lalloue, D Zmirou-Navier, S Deguen
 Association of Proximity to Polluting Industries, Deprivation and Infant Mortality - A spatial analysis using census data Lille metropolitan Area France 1,2,4 1,4 1,2,3,4 1,2 C. Padilla, B Lalloue, D Zmirou-Navier,
Modeling the economic growth of Arctic regions in Russia
 Computational Methods and Experimental Measurements XVII 179 Modeling the economic growth of Arctic regions in Russia N. Didenko 1 & K. Kunze 2 1 St. Petersburg Polytechnic University, Russia 2 University
Panel data panel data set not
 Panel data A panel data set contains repeated observations on the same units collected over a number of periods: it combines cross-section and time series data. Examples The Penn World Table provides national
How the science of cities can help European policy makers: new analysis and perspectives
 How the science of cities can help European policy makers: new analysis and perspectives By Lewis Dijkstra, PhD Deputy Head of the Economic Analysis Unit, DG Regional and European Commission Overview Data
Modeling Spatial Relationships Using Regression Analysis. Lauren M. Scott, PhD Lauren Rosenshein Bennett, MS
 Modeling Spatial Relationships Using Regression Analysis Lauren M. Scott, PhD Lauren Rosenshein Bennett, MS Workshop Overview Answering why? questions Introduce regression analysis - What it is and why
In matrix algebra notation, a linear model is written as
 DM3 Calculation of health disparity Indices Using Data Mining and the SAS Bridge to ESRI Mussie Tesfamicael, University of Louisville, Louisville, KY Abstract Socioeconomic indices are strongly believed
Section III: Poverty Mapping Results
 Section III: Poverty Mapping Results Figure 5: Gewog level rural poverty map 58. The most prominent result from the poverty mapping exercise of Bhutan is the production of a disaggregated poverty headcount
Brazil Experience in SDG data production, dissemination and capacity building
 Brazil Experience in SDG data production, dissemination and capacity building Claudio Stenner Coordinator of Geography 4th Meeting of the Working Group on Geospatial Information IAEG-SDG United Nations
Geomarketing as a Marketing Planning Tool. ESRI International User Conference San Diego, June 2007
 Geomarketing as a Marketing Planning Tool ESRI International User Conference San Diego, June 2007 25 Bruno e 26 de Marsili Janeiro de 2006 0 Abstract Telecom Italia Mobile (TIM) is a major wireless operator
This report details analyses and methodologies used to examine and visualize the spatial and nonspatial
 Analysis Summary: Acute Myocardial Infarction and Social Determinants of Health Acute Myocardial Infarction Study Summary March 2014 Project Summary :: Purpose This report details analyses and methodologies
National Statistics 2001 Area Classifications
 National Statistics 2001 Area Classifications John Charlton, ONS see http://neighbourhood.statistics.gov.uk areaclassifications@ons.gov.uk Copyright ONS What are the Area Classifications Summarise 2001
HSC Geography. Year 2013 Mark Pages 10 Published Jul 4, Urban Dynamics. By James (97.9 ATAR)
") HSC Geography Year 2013 Mark 92.00 Pages 10 Published Jul 4, 2017 Urban Dynamics By James (97.9 ATAR) Powered by TCPDF (www.tcpdf.org) Your notes author, James. James achieved an ATAR of 97.9 in 2013 while
HSC Geography Year 2013 Mark 92.00 Pages 10 Published Jul 4, 2017 Urban Dynamics By James (97.9 ATAR) Powered by TCPDF (www.tcpdf.org) Your notes author, James. James achieved an ATAR of 97.9 in 2013 while
Frans Thissen Department of Geography, Planning and International Development Studies Rural Poverty in Flanders
 Frans Thissen Department of Geography, Planning and International Development Studies Rural Poverty in Flanders a diversity of poverty in a diversity of places Rural poverty research in Flanders Henk Meert
APPENDIX V VALLEYWIDE REPORT
 APPENDIX V VALLEYWIDE REPORT Page Intentionally Left Blank 1.2 San Joaquin Valley Profile Geography The San Joaquin Valley is the southern portion of the Great Central Valley of California (Exhibit 1-1).
MAKING PLANNING LOCAL
 Georgia Social Vulnerability Index 2010 Atlas MAKING PLANNING LOCAL VULNERABLE & AT-RISK POPULATIONS DATA FOR JURISDICTIONS AT THE CENSUS TRACT LEVEL Public Health Districts Regional Coordinating Hospital
Bayesian Hierarchical Models
 Bayesian Hierarchical Models Gavin Shaddick, Millie Green, Matthew Thomas University of Bath 6 th - 9 th December 2016 1/ 34 APPLICATIONS OF BAYESIAN HIERARCHICAL MODELS 2/ 34 OUTLINE Spatial epidemiology
A Comprehensive Method for Identifying Optimal Areas for Supermarket Development. TRF Policy Solutions April 28, 2011
 A Comprehensive Method for Identifying Optimal Areas for Supermarket Development TRF Policy Solutions April 28, 2011 Profile of TRF The Reinvestment Fund builds wealth and opportunity for lowwealth communities
Applying cluster analysis to 2011 Census local authority data
 Applying cluster analysis to 2011 Census local authority data Kitty.Lymperopoulou@manchester.ac.uk SPSS User Group Conference November, 10 2017 Outline Basic ideas of cluster analysis How to choose variables
HOW FAR TO THE NEAREST PHYSICIAN?
 Rural and Small Town Canada Analysis Bulletin Catalogue no. 21-006-XIE Vol. 1, No. 5 (March 1999) HOW FAR TO THE NEAREST PHYSICIAN? Edward Ng, Russell Wilkins, Jason Pole and Owen B. Adams HIGHLIGHTS In
Inclusion of Non-Street Addresses in Cancer Cluster Analysis
 Inclusion of Non-Street Addresses in Cancer Cluster Analysis Sue-Min Lai, Zhimin Shen, Darin Banks Kansas Cancer Registry University of Kansas Medical Center KCR (Kansas Cancer Registry) KCR: population-based
Spatial Trends of unpaid caregiving in Ireland
 Spatial Trends of unpaid caregiving in Ireland Stamatis Kalogirou 1,*, Ronan Foley 2 1. NCG Affiliate, Thoukididi 20, Drama, 66100, Greece; Tel: +30 6977 476776; Email: skalogirou@gmail.com; Web: http://www.gisc.gr.
Sources of Welfare Disparities Within and Between Regions in Latin America and Caribbean Countries
 Sources of Welfare Disparities Within and Between Regions in Latin America and Caribbean Countries Vol 2: Country Case Studies (Brazil, Mexico, Ecuador, Peru) Draft: November 17, 2008 Emmanuel Skoufias
Social Science Research
 Social Science Research 38 (2009) 55 70 Contents lists available at ScienceDirect Social Science Research journal homepage: www.elsevier.com/locate/ssresearch Race and space in the 1990s: Changes in the
Explaining Regional Differences in Environmental Inequality
 Explaining Regional Differences in Environmental Inequality A Multi-Level Assessment of German Cities Tobias Rüttenauer Department of Social Sciences TU Kaiserslautern November 22, 2017 Analytische Soziologie
DIFFERENT INFLUENCES OF SOCIOECONOMIC FACTORS ON THE HUNTING AND FISHING LICENSE SALES IN COOK COUNTY, IL
 DIFFERENT INFLUENCES OF SOCIOECONOMIC FACTORS ON THE HUNTING AND FISHING LICENSE SALES IN COOK COUNTY, IL Xiaohan Zhang and Craig Miller Illinois Natural History Survey University of Illinois at Urbana
BUILDING SOUND AND COMPARABLE METRICS FOR SDGS: THE CONTRIBUTION OF THE OECD DATA AND TOOLS FOR CITIES AND REGIONS
 BUILDING SOUND AND COMPARABLE METRICS FOR SDGS: THE CONTRIBUTION OF THE OECD DATA AND TOOLS FOR CITIES AND REGIONS STATISTICAL CAPACITY BUILDING FOR MONITORING OF SUSTAINABLE DEVELOPMENT GOALS Lukas Kleine-Rueschkamp
Approach to identifying hot spots for NCDs in South Africa
 Approach to identifying hot spots for NCDs in South Africa HST Conference 6 May 2016 Noluthando Ndlovu, 1 Candy Day, 1 Benn Sartorius, 2 Karen Hofman, 3 Jens Aagaard-Hansen 3,4 1 Health Systems Trust,
Lecture 11: Cash Transfers. Prof. Eduardo A. Haddad
 Lecture 11: Cash Transfers Prof. Eduardo A. Haddad Outline The realm of regional policy Lula s regional policy Pro-vote? Pro-growth? Pro-poor? 2 General indicators of regional concentration in Brazil Table
Lecture 2 Differences and Commonalities among Developing Countries
 Lecture 2 Differences and Commonalities among Developing Countries Lecture Outline I-Defining the developing world: Indicators of development A-GDP per capita: nominal, real, PPP B-Human Development Index
Lecture 1 Introduction to Multi-level Models
 Lecture 1 Introduction to Multi-level Models Course Website: http://www.biostat.jhsph.edu/~ejohnson/multilevel.htm All lecture materials extracted and further developed from the Multilevel Model course
Cluster Analysis using SaTScan
 Cluster Analysis using SaTScan Summary 1. Statistical methods for spatial epidemiology 2. Cluster Detection What is a cluster? Few issues 3. Spatial and spatio-temporal Scan Statistic Methods Probability
EXPLORATORY SPATIAL DATA ANALYSIS OF BUILDING ENERGY IN URBAN ENVIRONMENTS. Food Machinery and Equipment, Tianjin , China
 EXPLORATORY SPATIAL DATA ANALYSIS OF BUILDING ENERGY IN URBAN ENVIRONMENTS Wei Tian 1,2, Lai Wei 1,2, Pieter de Wilde 3, Song Yang 1,2, QingXin Meng 1 1 College of Mechanical Engineering, Tianjin University
Using Spatial Statistics Social Service Applications Public Safety and Public Health
 Using Spatial Statistics Social Service Applications Public Safety and Public Health Lauren Rosenshein 1 Regression analysis Regression analysis allows you to model, examine, and explore spatial relationships,
Keywords: Air Quality, Environmental Justice, Vehicle Emissions, Public Health, Monitoring Network
 NOTICE: this is the author s version of a work that was accepted for publication in Transportation Research Part D: Transport and Environment. Changes resulting from the publishing process, such as peer
São Paulo Metropolis and Macrometropolis - territories and dynamics of a recent urban transition
 São Paulo Metropolis and Macrometropolis - territories and dynamics of a recent urban transition Faculty of Architecture and Urbanism of São Paulo University Prof. Dr. Regina M. Prosperi Meyer WC2 - World
ARIC Manuscript Proposal # PC Reviewed: _9/_25_/06 Status: A Priority: _2 SC Reviewed: _9/_25_/06 Status: A Priority: _2
 ARIC Manuscript Proposal # 1186 PC Reviewed: _9/_25_/06 Status: A Priority: _2 SC Reviewed: _9/_25_/06 Status: A Priority: _2 1.a. Full Title: Comparing Methods of Incorporating Spatial Correlation in
Spatial Disparities in the Distribution of Parks and Green Spaces in the United States
 March 11 th, 2012 Active Living Research Conference Spatial Disparities in the Distribution of Parks and Green Spaces in the United States Ming Wen, Ph.D., University of Utah Xingyou Zhang, Ph.D., CDC
A s i a n J o u r n a l o f M u l t i d i m e n s i o n a l R e s e a r c h KUZNETS CURVE: THE CASE OF THE INDIAN ECONOMY
 P u b l i s h e d b y : T R A N S A s i a n R e s e a r c h J o u r n a l s AJMR: A s i a n J o u r n a l o f M u l t i d i m e n s i o n a l R e s e a r c h (A Do u b le B lind Re fe r e e d & Re v ie
Abstract Teenage Employment and the Spatial Isolation of Minority and Poverty Households Using micro data from the US Census, this paper tests the imp
 Teenage Employment and the Spatial Isolation of Minority and Poverty Households by Katherine M. O'Regan Yale School of Management and John M. Quigley University of California Berkeley I II III IV V Introduction
ANGOLA: PARTICIPATORY MAPPING OF URBAN POVERTY. By Allan Cain, Development Workshop
 ANGOLA: PARTICIPATORY MAPPING OF URBAN POVERTY By Allan Cain, Development Workshop Angola: Participatory Mapping of Urban Poverty BY ALLAN CAIN, DEVELOPMENT WORKSHOP This paper explains a method for measuring
The Emerging Southeast MegaRegion
 The Emerging Southeast MegaRegion Catherine L. Ross, Ph.D. Director, Center for Quality Growth and Regional Development presented at the Think Global, Act Regional Symposium January 30, 2006 Case Study:
BIG IDEAS. Area of Learning: SOCIAL STUDIES Urban Studies Grade 12. Learning Standards. Curricular Competencies
 Area of Learning: SOCIAL STUDIES Urban Studies Grade 12 BIG IDEAS Urbanization is a critical force that shapes both human life and the planet. The historical development of cities has been shaped by geographic,
Statistics for cities
 Statistics for cities More than statistics about cities Jean-Luc LIPATZ INSEE «Territorial studies» August 2010 An argument that started with the urban audit adventure but no offense is meant : bad examples
The Church Demographic Specialists
 The Church Demographic Specialists Easy-to-Use Features Map-driven, Web-based Software An Integrated Suite of Information and Query Tools Providing An Insightful Window into the Communities You Serve Key
EVALUATING CHANGING RESIDENTIAL SEGREGATION IN AUCKLAND, NEW ZEALAND, USING SPATIAL STATISTICS
 EVALUATING CHANGING RESIDENTIAL SEGREGATION IN AUCKLAND, NEW ZEALAND, USING SPATIAL STATISTICS RON JOHNSTON, MICHAEL POULSEN, AND JAMES FORREST THIS PAPER HAS BEEN SUBMITTED FOR PUBLICATION Not to be cited
Engagement on Strategies to Overcome Inequality
 Engagement on Strategies to Overcome Inequality Civil Society Engagement with Poverty Julian Sendin 1-2 June 2017 Kievits Kroon Country Estate, Pretoria, South Africa 1. Ndifuna Ukwazi Ndifuna Ukwazi is
A Micro-Spatial Analysis of Violent Crime
 A Micro-Spatial Analysis of Violent Crime The Experience of a Small Southern City Isaac T. Van Patten Radford University Levels of Measurement Macro-spatial analysis Crime at the state, regional, or national
Urban Inclusiveness In Theory and (Global Policy) Practice. Tim Bunnell Department of Geography National University of Singapore
 Practice. Tim Bunnell Department of Geography National University of Singapore") Urban Inclusiveness In Theory and (Global Policy) Practice Tim Bunnell Department of Geography National University of Singapore geotgb@nus.edu.sg Urban Inclusiveness In Theory and (Global Policy) Practice
Urban Inclusiveness In Theory and (Global Policy) Practice Tim Bunnell Department of Geography National University of Singapore geotgb@nus.edu.sg Urban Inclusiveness In Theory and (Global Policy) Practice
Impact of transport projects on accessibility and mobility of the urban poor Case of the Delhi Metro
 Impact of transport projects on accessibility and mobility of the urban poor Case of the Delhi Metro Presentation By: Anvita Arora TRIPP, IITD Transport Innovations (TI), Delhi Bicycle Partnership Program,