Supporting Protocol This protocol describes the construction and the force-field parameters of the non-standard residue for the Ag + -site using CNS
|
|
|
- Bartholomew Clarke
- 5 years ago
- Views:
Transcription
1 Supporting Protocol This protocol describes the construction and the force-field parameters of the non-standard residue for the Ag + -site using CNS CNS input file generatemetal.inp: remarks file generate/generatemetal.inp remarks Sample: generate protein structure with metal cluster {*Append the metal cluster*} autogenerate angles=true end {*topology. *} MASS AG ! silver 1+ {*from cns/libraries/toppar/ion.top*} RESIdue AG1 {silver 1+} GROUp ATOM AG+1 TYPE=AG+1 CHARge=+1.0 END END {AG1} {*from cns/libraries/toppar/ion.top*} {*Generate the patch topology,*} {*which will be used in the *} {*PATCh command. *} END end PREsidue AGSM parameter ADD BOND 4AG+1 1SD ADD BOND 4AG+1 2SD ADD BOND 4AG+1 3SD ADD ANGLe 1CG 1SD 4AG+1 ADD ANGLe 2CG 2SD 4AG+1 ADD ANGLe 3CG 3SD 4AG+1 ADD ANGLe 1CE 1SD 4AG+1 ADD ANGLe 2CE 2SD 4AG+1 ADD ANGLe 3CE 3SD 4AG+1 ADD ANGle 1SD 4AG+1 2SD ADD ANGle 1SD 4AG+1 3SD ADD ANGle 2SD 4AG+1 {*Append parameters for metal site*}! eps sigma eps(1:4) sigma(1:4)! (kcal/mol) (A)! NONBonded AG ! Beate, {*from cns/libraries/toppar/ion.param*} nbonds {*This statement specifies the*} atom cdie shift eps=1.0 e14fac=0.4 {*nonbonded interaction energy*} cutnb=7.5 ctonnb=6.0 ctofnb=6.5 {*options. Note the reduced *} nbxmod=5 vswitch {*nonbonding cutoff to save *} end {*CPU time. *} end {*Split the coordinate file into*}
2 {*two files, one containing the *} {*protein coordinates, the other*} {*the metal cluster *} {*coordinates. *} {*First, generate protein.*} segment name="silb_nm2" end end segment name="ag" chain end end the metal*} {*Now generate metal cluster.*} {*Now generate the *} {*covalent links between the protein and patch AGSM reference=1=( resid 34 ) reference=2=( resid 49 ) reference=3=( resid 51 ) reference=4=( resid 200 ) end write coordinates output=ag_silbnm2.pdb end write structure output=ag_silbnm2.psf end stop Associated forcefield parameters: BOND AG+1 SM {sd= 0.001} 2.53 ANGle SM AG+1 SM {sd= 0.031} !(2qcp and 3nsd as examples) ANGle CH2E SM AG {sd= 0.031} !(2qcp and 3nsd as examples) ANGle CH3E SM AG {sd= 0.031} !(2qcp and 3nsd as examples) NONBonded AG !{*from cns/libraries/toppar/ion.param*}
3 Table S1: NMR structural statistics for Ag + -SilB-NM2 (20 structures) I. Experimental constraints Distance restraints Unambiguous distance restraints total number 4065 unique atom pairs 2375 Intraresidual 1708 Sequential 1188 medium range 332 long range 837 Ambiguous distance restraints 419 Dihedral angle restraints Phi 87 Psi 87 II. Constraint violations Distances Rms Å largest violation 3.9 Å Dihedral angles Rms largest violation III. Geometry Mean deviation from ideal geometry bond lengths 5.21 E-3 Å bond angles 0.69 Impropers 1.95 Disallowed 0.3 %
4 Figure S1
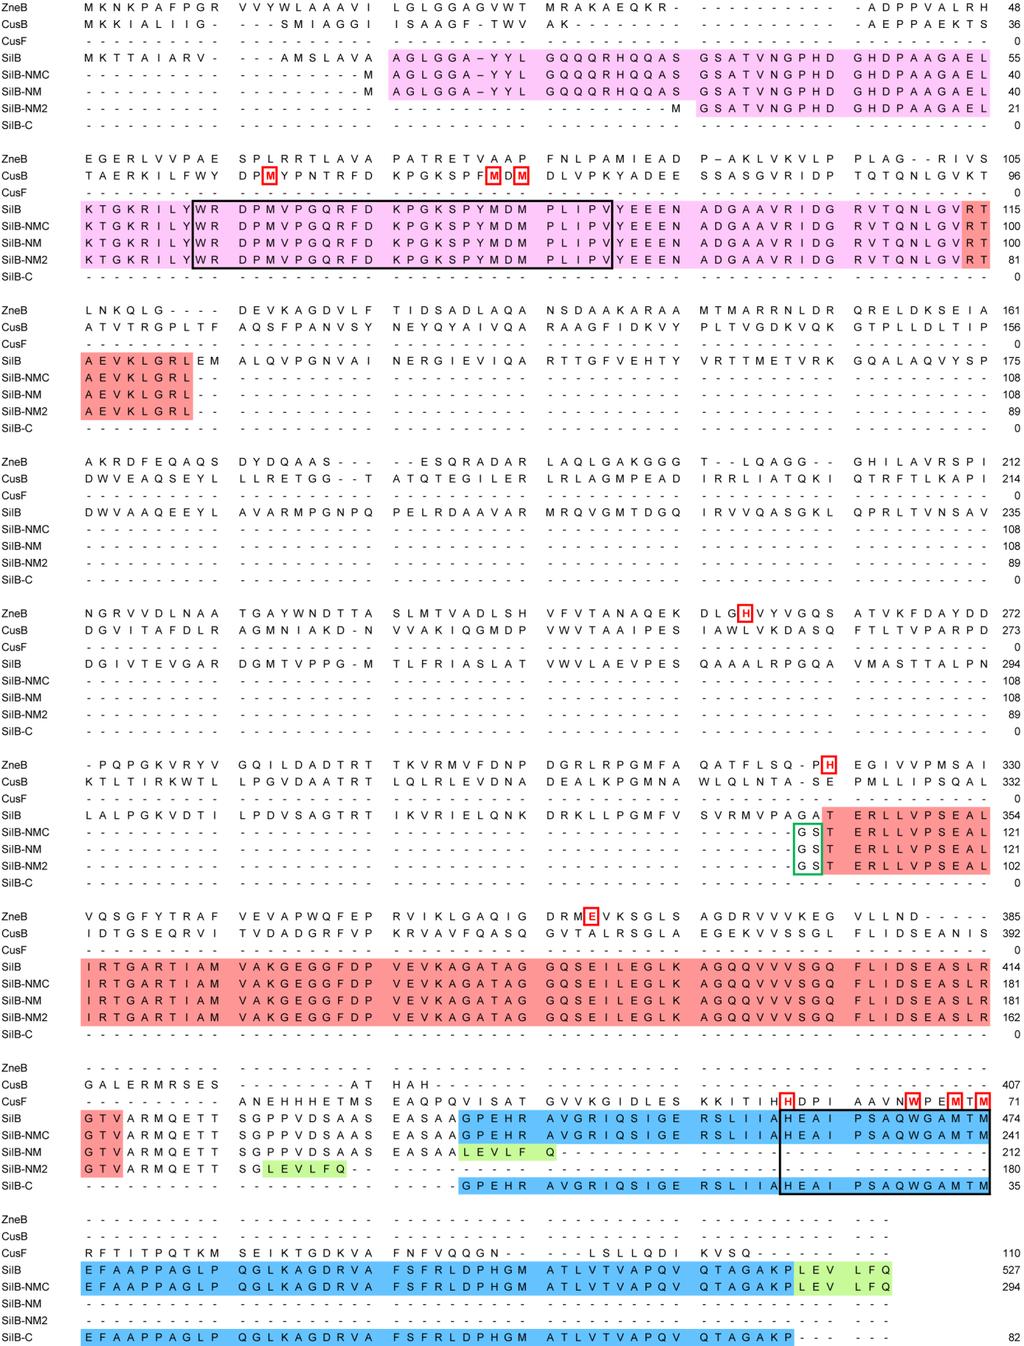
5 Figure S1 (continued) Figure S1. Multiple-sequence alignment of CusB (P77239) and CusF (P77214) from E. coli, ZneB (Q1LCD7) and SilB (Q58AF3) from C. metallidurans CH34, and the protein constructs used in this study. Based on the sequence alignment with CusB from E. coli, some functional domains were located on the SilB sequence and represented in different colors: light magenta, N-terminal domain; light red, membrane proximal domain; light blue, C-terminal CusF-like domain. The amino acid residues involved in metal ion binding in CusB, CusF, and ZneB are boxed in red. Regions around the N- and C-terminal metal binding sites in SilB are boxed in black. The additional residues forming the GS loop are boxed in green. The additional residues associated to the human rhinovirus 3C protease cleavage site are shaded in light green.
, SilB-NMC (B), SilB-NM (C) and SilB-NM2 (D). The proteins were detected by Coomassie blue (A, B, and D) or silver (C) staining.")
6 Figure S2 I. II. Figure S2. I. Separation of the purified recombinant SilB and SilB protein constructs by SDS-PAGE. Lane 1, molecular mass standards; lane 2, purified recombinant SilB (A), SilB-NMC (B), SilB-NM (C) and SilB-NM2 (D). The proteins were detected by Coomassie blue (A, B, and D) or silver (C) staining. II. Determination by mass spectrometry of the molecular masses of the purified recombinant SilB (A), SilB-NMC (B), SilB-NM (C) and SilB-NM2 (D). The insets represent the molecular mass spectra obtained after deconvolution of the raw data using the MaxEnt1 software (Waters). The experimental masses are in good agreement with the theoretical masses calculated for the recombinant proteins devoid of the N-terminal methionine residue: SilB ( Da), SilB- NMC ( Da), SilB-NM ( Da), and SilB-NM2 ( Da).
7 Figure S3 Figure S3. ESI mass spectra of the recombinant proteins in 10 mm ammonium acetate (ph 6.9) titrated with metal ions. The protein concentration was 5 µm. (A) [M + 16H] 16+ charge state of SilB in the apo form (1) and in the presence of 1 molar equiv (2) and 2 molar equiv (3) of Ag +, and 1 molar equiv (4) and 2 molar equiv (5) of Cu +. (B) [M + 11H] 11+ charge state of SilB-NMC in the apo form (1) and in the presence of 2 molar equiv of Ag + (2) and Cu + (3). (C) [M + 9H] 9+ charge state of SilB-NM in the apo form (1) and in the presence of 1 molar equiv of Ag + (2) and Cu + (3). (D) [M + 8H] 8+ charge state of SilB-NM2 in the apo form (1) and in the presence of 1 molar equiv of Ag + (2) and Cu + (3). The position of the apo form peak is depicted by a dashed line and the red arrows represent the mass shifts observed upon the binding of metal ions.
8 Figure S4 Figure S4. Isothermal titration calorimetry: Titration of AgNO 3 into SilB-NM2 (A) in MilliQ water at 25 ºC, and SilB-C (B) in 20 mm HEPES ph 7.0 at 25 ºC. Top panel, differential heating power versus time. Lower panel, integrated and normalized heat of reaction versus the molar ratio. Experimental data are represented by black squares ( ). Lines show the best fit to the binding isotherm using a single-site binding model.
9 Figure S5 Figure S5. 1 H, 13 C-HSQC spectra centred on the region in which methionine methyl correlation peaks show up. (A) Titration of SilB-NM (black: apo, green: molar equiv, cyan: molar equiv, and red: molar equiv of Ag + ions). (B) 1 H, 13 C-HSQC spectra of apo-silb-nm2 (black) and Ag + -SilB-NM2 (violet). Arrows indicate shifts that occur upon metal binding, indicating that the three labeled methionine residues are involved in binding of the Ag + ion (sequence numbering of SilB-NM2).
10 Figure S6 Figure S6. Superposition of 1 H, 15 N-HSQC spectra of SilB-NMC (blue), SilB-NM (green) and SilB- C (red) in the absence (top) and the presence of 1 molar equiv of Ag + ions per binding site (bottom). Nearly all cross-peaks of the SilB-NMC spectrum have an equivalent in one of the two other spectra. The boxed region contains side chain resonances that are refolded differently as a function of the 15 N spectral width.
11 Figure S7 Figure S7. Ag + -titration of SilB-C. Superposition of 1 H, 15 N-HSQC spectra acquired with 0 (blue), 0.5 (green) and 1 (magenta) molar equiv of Ag + ions added. Cross-peaks are labeled according to the previous NMR study of the CusF-like domain. 30
12 Figure S8 Figure S8. Weighted chemical shift differences between amide groups of the C-terminal domain of apo-silb-nmc and SilB-NMC in the presence of 1 molar equiv of AgNO 3 (half-saturated SilB- NMC) as a function of SilB sequence.
13 Figure S9 Figure S9. ESI mass spectra of a mixture of 5 µm SilB-C and 5 µm SilB-NM in 10 mm ammonium acetate (ph 6.9). (A) Multiple-charge ion mass spectrum where the peaks corresponding to apo SilB-C and SilB-NM are labeled with open squares and stars, respectively. (B) Zoom of this spectrum in regions where the [M + 6H] 6+ charge state of SilB-C and the [M + 9H] 9+ charge state of SilB-NM are detected (1). Upon addition of 5 µm of Ag +, the metal ions are mainly associated to SilB-C (2), while both proteins are fully metallated in the presence of 10 µm of Ag + (3). The metalbound forms of both proteins are represented with filled symbols.
14 Figure S10 Figure S10. Domain-domain interactions monitored by isothermal titration calorimetry. (A) Titration of apo-silb-c (100 μm) into Ag + -SilB-NM (10 μm). (B) Titration of apo-silb-nm (100 μm) into Ag + -SilB-C (10 μm). (C) Titration of apo-silb-c (100 μm) into apo-silb-nm (10 μm). (D) Titration of Ag + -SilB-C (100 μm) into Ag + -SilB-NM (10 μm). Top panel, differential heating power versus time. Lower panel, integrated and normalized heat of reaction ( ) versus the molar ratio of the two proteins.
15 Figure S11 Figure S11. (A) Metal ion transfer between Ag + -SilB-NM and apo-silb-c monitored by native mass spectrometry. The mass spectra represent the regions corresponding to the [M + 6H] 6+ charge state of SilB-C and the [M + 9H] 9+ charge state of SilB-NM as described in Figure S9. Peaks associated to SilB-C and SilB-NM are represented with open squares and stars, respectively. The metal-bound forms of both proteins are represented with filled symbols. (1) 5 µm of Ag + -SilB-NM in 10 mm ammonium acetate, ph 6.9. (2) Upon addition of 5 µm of apo-silb-c to this latter, a large amount of Ag + bound to SilB-NM is transferred to SilB-C. The transfer of metal ions between the two proteins is significantly less efficient when 5 µm of Ag + -SilB-C (3) are incubated in the presence of 5 µm apo-silb-nm (4). (B) Identical experiments realized by replacing SilB-NM with SilB-NM2. The mass spectra represent the regions corresponding to the [M + 6H] 6+ charge state of SilB-C and the [M + 8H] 8+ charge state of SilB-NM2. Peaks associated to SilB-C and SilB-NM2 are represented with open squares and circles, respectively. The metal-bound forms of both proteins are represented with filled symbols.
16 Figure S12
17 Figure S12 (continued) Figure S12. Metal exchange between Ag + -SilB-NM and apo-silb-c. (A) 1 H, 15 N-HSQC spectrum of 0.18 mm 15 N-labeled SilB-NM to which 0.1 mm AgNO 3 (compare S10B) and 0.11 mm 13 C, 15 N- labeled apo-silb-c had been added consecutively. Specific resonances of apo-silb-nm and Ag + - SilB-C are indicated by black and green arrows, respectively. (B) 1 H, 15 N-HSQC spectra of 0.18 mm SilB-NM in absence (black) and presence of 0.1 mm AgNO 3 (red). (C) Control spectrum of apo-silb-c (green) compared to Ag + -SilB-C (violet). (D) 1 H, 13 C-HSQC spectra of 13 C, 15 N-labeled apo-silb-c (green) and the mixture of 0.18 mm 15 N-labeled SilB-NM, 0.1 mm AgNO 3 and 0.11 mm 13 C, 15 N-labeled apo-silb-c (blue). Arrows indicate positions of the methyl groups of the two methionines involved in the Ag + -site. The blue spectrum shows the characteristic downfield shift indicating that Ag + ions are bound by the methionines. The spectra shown in A, B and D have been obtained with the same SilB-NM sample during a titration with AgNO 3 and apo-silb-c.
18 Figure S13 Figure S13. Quantification of slow chemical exchange rates for Ag + -SilB-NM2. (A) Extract of the two-dimensional EXSY spectra acquired with mixing times of 0 (dark grey), 50 ms (green) and 250 ms (red). (B) Result of the data analysis in which peak intensities measured as a function of mixing time were fitted to a two-site exchange model. Experimentally measured longitudinal relaxation rates were considered in the fitting process. Measured peak intensities are shown as a function of mixing time for the diagonal peaks AA (red), BB (violet) and the exchange peaks AB (blue) and BA (black). The results of the best fit obtained with p A = 0.53±0.05, p B = 0.47±0.05, k AB = 7.5±1.0 s -1, k BA = 8.4±1.1 s -1 are shown as continuous lines.
19 Figure S14 Figure S14. Absolute chemical shift differences between backbone atoms of Ag + -bound SilB-NM2 form A and form B. Carbon-α (blue triangles), carbonyl carbon (black squares), and amide nitrogen (green dots).
 (PDB code 3NE5) and C. metallidurans ZneB (violet) (PDB code 3LNN). N and C-termini of the individual domains are indicated in the corresponding colors.")
20 Figure S15 Figure S15. The structure and environment of the membrane proximal domain. (A) Comparison of the three-dimensional structures of the MP domain from SilB (red), E. coli CusB (cyan) (PDB code 3NE5) and C. metallidurans ZneB (violet) (PDB code 3LNN). N and C-termini of the individual domains are indicated in the corresponding colors. For CusB and ZneB, the neighboring -barrel domain is indicated. (B) The MP domain from CusB in the supramolecular CusAB 2 complex (PDB code 3NE5). The molecular surface of CusA is shown in blue, those of the two CusB chains from the same asymmetric unit in pink. The surface of the MP domains is colored according to the electrostatic potential ranging from -3 kt (red) to +3 kt (blue). The N- and C-termini of each MP domain are indicated. The approximate location of the membrane is indicated in green. (C) The CusA 3 B 6 complex in a different orientation.
SUPPLEMENTARY INFORMATION
 5 N 4 8 20 22 24 2 28 4 8 20 22 24 2 28 a b 0 9 8 7 H c (kda) 95 0 57 4 28 2 5.5 Precipitate before NMR expt. Supernatant before NMR expt. Precipitate after hrs NMR expt. Supernatant after hrs NMR expt.
Supporting Information
 Supporting Information Micelle-Triggered b-hairpin to a-helix Transition in a 14-Residue Peptide from a Choline-Binding Repeat of the Pneumococcal Autolysin LytA HØctor Zamora-Carreras, [a] Beatriz Maestro,
Supplementary Materials for
 advances.sciencemag.org/cgi/content/full/4/1/eaau413/dc1 Supplementary Materials for Structure and dynamics conspire in the evolution of affinity between intrinsically disordered proteins Per Jemth*, Elin
SUPPLEMENTARY FIGURES
 SUPPLEMENTARY FIGURES Supplementary Figure 1 Protein sequence alignment of Vibrionaceae with either a 40-residue insertion or a 44-residue insertion. Identical residues are indicated by red background.
SUPPLEMENTARY INFORMATION
 Supplementary materials Figure S1 Fusion protein of Sulfolobus solfataricus SRP54 and a signal peptide. a, Expression vector for the fusion protein. The signal peptide of yeast dipeptidyl aminopeptidase
Table S1. Primers used for the constructions of recombinant GAL1 and λ5 mutants. GAL1-E74A ccgagcagcgggcggctgtctttcc ggaaagacagccgcccgctgctcgg
 SUPPLEMENTAL DATA Table S1. Primers used for the constructions of recombinant GAL1 and λ5 mutants Sense primer (5 to 3 ) Anti-sense primer (5 to 3 ) GAL1 mutants GAL1-E74A ccgagcagcgggcggctgtctttcc ggaaagacagccgcccgctgctcgg
Structural basis for catalytically restrictive dynamics of a high-energy enzyme state
 Supplementary Material Structural basis for catalytically restrictive dynamics of a high-energy enzyme state Michael Kovermann, Jörgen Ådén, Christin Grundström, A. Elisabeth Sauer-Eriksson, Uwe H. Sauer
Is quantum mechanics necessary for predicting binding free energy?
 Supporting Information Is quantum mechanics necessary for predicting binding free energy? Ting Zhou, Danzhi Huang and Amedeo Caflisch* Department of Biochemistry, University of Zürich, Winterthurerstrasse
Sensitive NMR Approach for Determining the Binding Mode of Tightly Binding Ligand Molecules to Protein Targets
 Supporting information Sensitive NMR Approach for Determining the Binding Mode of Tightly Binding Ligand Molecules to Protein Targets Wan-Na Chen, Christoph Nitsche, Kala Bharath Pilla, Bim Graham, Thomas
SUPPLEMENTARY ONLINE DATA
 SUPPLEMENTARY ONLINE DATA Secreted Isoform of Human Lynx1 (SLURP-2): Spatial Structure and Pharmacology of Interaction with Different Types of Acetylcholine Receptors E.N. Lyukmanova 1,2,*, M.A. Shulepko
SUPPLEMENTARY INFORMATION
 Parallel Allostery by camp and PDE Coordinates Activation and Termination Phases in camp Signaling Srinath Krishnamurthy, 1 Nikhil Kumar Tulsian, 1 Arun Chandramohan, 1 and Ganesh S. Anand 1, * 1 Department
Acta Crystallographica Section D
 Supporting information Acta Crystallographica Section D Volume 70 (2014) Supporting information for article: Structural basis of the heterodimerization of the MST and RASSF SARAH domains in the Hippo signalling
Supplementary figure 1 Application of tmfret in LeuT. (a) To assess the feasibility of using tmfret for distance-dependent measurements in LeuT, a
 To assess the feasibility of using tmfret for distance-dependent measurements in LeuT, a") Supplementary figure 1 Application of tmfret in LeuT. (a) To assess the feasibility of using tmfret for distance-dependent measurements in LeuT, a series of tmfret-pairs comprised of single cysteine mutants
Supplementary figure 1 Application of tmfret in LeuT. (a) To assess the feasibility of using tmfret for distance-dependent measurements in LeuT, a series of tmfret-pairs comprised of single cysteine mutants
Cryo-EM data collection, refinement and validation statistics
 1 Table S1 Cryo-EM data collection, refinement and validation statistics Data collection and processing CPSF-160 WDR33 (EMDB-7114) (PDB 6BM0) CPSF-160 WDR33 (EMDB-7113) (PDB 6BLY) CPSF-160 WDR33 CPSF-30
Supplementary Materials: Localization and Spectroscopic Analysis of the Cu(I) Binding Site in Wheat Metallothionein Ec-1
 Binding Site in Wheat Metallothionein Ec-1") S1 of S8 Supplementary Materials: Localization and Spectroscopic Analysis of the Cu(I) Binding Site in Wheat Metallothionein Ec-1 Katsiaryna Tarasava, Jens Loebus and Eva Freisinger Figure S1. Deconvoluted
S1 of S8 Supplementary Materials: Localization and Spectroscopic Analysis of the Cu(I) Binding Site in Wheat Metallothionein Ec-1 Katsiaryna Tarasava, Jens Loebus and Eva Freisinger Figure S1. Deconvoluted
Supplementary Figure 1.
 a b c d e f g 1 Supplementary Figure 1. Identification of unfolded regions in the Chz1-H2A.Z-H2B complex and structure and dynamics of Chz.core-sH2B_H2A.Z. (a) 1 H- 15 N HSQC spectrum of Chz1. All backbone
Supplementary Information. The protease GtgE from Salmonella exclusively targets. inactive Rab GTPases
 Supplementary Information The protease GtgE from Salmonella exclusively targets inactive Rab GTPases Table of Contents Supplementary Figures... 2 Supplementary Figure 1... 2 Supplementary Figure 2... 3
Supporting Information
 Supporting Information Ottmann et al. 10.1073/pnas.0907587106 Fig. S1. Primary structure alignment of SBT3 with C5 peptidase from Streptococcus pyogenes. The Matchmaker tool in UCSF Chimera (http:// www.cgl.ucsf.edu/chimera)
Supporting Information
 Supporting Information Oxaliplatin binding to human copper chaperone Atox1 and protein dimerization Benny D. Belviso, 1 Angela Galliani, 2 Alessia Lasorsa, 2 Valentina Mirabelli, 1,3 Rocco Caliandro, 1
LS1a Fall 2014 Problem Set #2 Due Monday 10/6 at 6 pm in the drop boxes on the Science Center 2 nd Floor
 LS1a Fall 2014 Problem Set #2 Due Monday 10/6 at 6 pm in the drop boxes on the Science Center 2 nd Floor Note: Adequate space is given for each answer. Questions that require a brief explanation should
Supplementary Figure 1. Biochemical and sequence alignment analyses the
 Supplementary Figure 1. Biochemical and sequence alignment analyses the interaction of OPTN and TBK1. (a) Analytical gel filtration chromatography analysis of the interaction between TBK1 CTD and OPTN(1-119).
Table S1. Overview of used PDZK1 constructs and their binding affinities to peptides. Related to figure 1.
 Table S1. Overview of used PDZK1 constructs and their binding affinities to peptides. Related to figure 1. PDZK1 constru cts Amino acids MW [kda] KD [μm] PEPT2-CT- FITC KD [μm] NHE3-CT- FITC KD [μm] PDZK1-CT-
Nature Structural & Molecular Biology: doi: /nsmb Supplementary Figure 1
 Supplementary Figure 1 Identification of the ScDcp2 minimal region interacting with both ScDcp1 and the ScEdc3 LSm domain. Pull-down experiment of untagged ScEdc3 LSm with various ScDcp1-Dcp2-His 6 fragments.
Supplemental data for
 Supplemental data for A Real-Time Guanine Nucleotide Exchange Assay using NMR: Activation of RhoA by PDZ- RhoGEF. Geneviève M.C. Gasmi-Seabrook 1,3, Christopher B. Marshall 1,3, Melissa Cheung 1,3, Bryan
Protein Structure Determination from Pseudocontact Shifts Using ROSETTA
 Supporting Information Protein Structure Determination from Pseudocontact Shifts Using ROSETTA Christophe Schmitz, Robert Vernon, Gottfried Otting, David Baker and Thomas Huber Table S0. Biological Magnetic
SUPPLEMENTARY INFORMATION
 doi:10.1038/nature11054 Supplementary Fig. 1 Sequence alignment of Na v Rh with NaChBac, Na v Ab, and eukaryotic Na v and Ca v homologs. Secondary structural elements of Na v Rh are indicated above the
Nature Structural and Molecular Biology: doi: /nsmb Supplementary Figure 1. Definition and assessment of ciap1 constructs.
 Supplementary Figure 1 Definition and assessment of ciap1 constructs. (a) ciap1 constructs used in this study are shown as primary structure schematics with domains colored as in the main text. Mutations
Supplementary Figure 1. Aligned sequences of yeast IDH1 (top) and IDH2 (bottom) with isocitrate
 and IDH2 (bottom) with isocitrate") SUPPLEMENTARY FIGURE LEGENDS Supplementary Figure 1. Aligned sequences of yeast IDH1 (top) and IDH2 (bottom) with isocitrate dehydrogenase from Escherichia coli [ICD, pdb 1PB1, Mesecar, A. D., and Koshland,
SUPPLEMENTARY FIGURE LEGENDS Supplementary Figure 1. Aligned sequences of yeast IDH1 (top) and IDH2 (bottom) with isocitrate dehydrogenase from Escherichia coli [ICD, pdb 1PB1, Mesecar, A. D., and Koshland,
SUPPLEMENTARY INFORMATION
 SUPPLEMENTARY INFORMATION doi:10.1038/nature11744 Supplementary Table 1. Crystallographic data collection and refinement statistics. Wild-type Se-Met-BcsA-B SmCl 3 -soaked EMTS-soaked Data collection Space
SUPPLEMENTARY INFORMATION
 Data collection Supplementary Table 1 Statistics of data collection, phasing and refinement Native Se-MAD Space group P2 1 2 1 2 1 P2 1 2 1 2 1 Cell dimensions a, b, c (Å) 50.4, 94.2, 115.4 49.8, 94.2,
NMR, X-ray Diffraction, Protein Structure, and RasMol
 NMR, X-ray Diffraction, Protein Structure, and RasMol Introduction So far we have been mostly concerned with the proteins themselves. The techniques (NMR or X-ray diffraction) used to determine a structure
Journal Name ARTICLE. ESI for: CHARMM force field parameterization protocol for selfassembling peptide amphiphiles: The Fmoc moiety
 Electronic Supplementary Material (ESI) for Physical Chemistry Chemical Physics. This journal is the Owner Societies 2016Please do not adjust margins ESI for: Received 00th January 20xx, Accepted 00th
Supplementary Materials for
 advances.sciencemag.org/cgi/content/full/3/4/e1600663/dc1 Supplementary Materials for A dynamic hydrophobic core orchestrates allostery in protein kinases Jonggul Kim, Lalima G. Ahuja, Fa-An Chao, Youlin
Structure of the α-helix
 Structure of the α-helix Structure of the β Sheet Protein Dynamics Basics of Quenching HDX Hydrogen exchange of amide protons is catalyzed by H 2 O, OH -, and H 3 O +, but it s most dominated by base
SUPPLEMENTARY INFORMATION
 doi:10.1038/nature11085 Supplementary Tables: Supplementary Table 1. Summary of crystallographic and structure refinement data Structure BRIL-NOP receptor Data collection Number of crystals 23 Space group
SUPPLEMENTARY INFORMATION
 SUPPLEMENTARY INFORMATION doi:10.1038/nature11524 Supplementary discussion Functional analysis of the sugar porter family (SP) signature motifs. As seen in Fig. 5c, single point mutation of the conserved
NMR parameters intensity chemical shift coupling constants 1D 1 H spectra of nucleic acids and proteins
 Lecture #2 M230 NMR parameters intensity chemical shift coupling constants Juli Feigon 1D 1 H spectra of nucleic acids and proteins NMR Parameters A. Intensity (area) 1D NMR spectrum: integrated intensity
Biochemistry 530 NMR Theory and Practice. Gabriele Varani Department of Biochemistry and Department of Chemistry University of Washington
 Biochemistry 530 NMR Theory and Practice Gabriele Varani Department of Biochemistry and Department of Chemistry University of Washington 1D spectra contain structural information.. but is hard to extract:
Interpreting and evaluating biological NMR in the literature. Worksheet 1
 Interpreting and evaluating biological NMR in the literature Worksheet 1 1D NMR spectra Application of RF pulses of specified lengths and frequencies can make certain nuclei detectable We can selectively
Chapter 6. The interaction of Src SH2 with the focal adhesion kinase catalytic domain studied by NMR
 The interaction of Src SH2 with the focal adhesion kinase catalytic domain studied by NMR 103 Abstract The interaction of the Src SH2 domain with the catalytic domain of FAK, including the Y397 SH2 domain
SUPPLEMENTARY INFORMATION
 Supplementary Table S1 Kinetic Analyses of the AMSH-LP mutants AMSH-LP K M (μm) k cat x 10-3 (s -1 ) WT 71.8 ± 6.3 860 ± 65.4 T353A 76.8 ± 11.7 46.3 ± 3.7 F355A 58.9 ± 10.4 5.33 ± 0.30 proximal S358A 75.1
Introduction solution NMR
 2 NMR journey Introduction solution NMR Alexandre Bonvin Bijvoet Center for Biomolecular Research with thanks to Dr. Klaartje Houben EMBO Global Exchange course, IHEP, Beijing April 28 - May 5, 20 3 Topics
Stabilizing the CH2 domain of an Antibody by Engineering in an Enhanced Aromatic Sequon
 Stabilizing the CH2 domain of an Antibody by Engineering in an Enhanced Aromatic Sequon Wentao Chen,, Leopold Kong, Stephen Connelly, Julia M. Dendle,, Yu Liu,, Ian A. Wilson,#, Evan T. Powers, *, Jeffery
Supplemental Information
 Supplemental Information Combinatorial Readout of Unmodified H3R2 and Acetylated H3K14 by the Tandem PHD Finger of MOZ Reveals a Regulatory Mechanism for HOXA9 Transcription Yu Qiu 1, Lei Liu 1, Chen Zhao
Resonance assignments in proteins. Christina Redfield
 Resonance assignments in proteins Christina Redfield 1. Introduction The assignment of resonances in the complex NMR spectrum of a protein is the first step in any study of protein structure, function
Enhancing hydrogen production of microalgae by redirecting electrons from photosystem I to hydrogenase
 Electronic Supplementary Material (ESI) for Energy & Environmental Science. This journal is The Royal Society of Chemistry 2014 Supplementary information for Enhancing hydrogen production of microalgae
SUPPLEMENTARY INFORMATION
 Figure S1. Secondary structure of CAP (in the camp 2 -bound state) 10. α-helices are shown as cylinders and β- strands as arrows. Labeling of secondary structure is indicated. CDB, DBD and the hinge are
Supplemental Data SUPPLEMENTAL FIGURES
 Supplemental Data CRYSTAL STRUCTURE OF THE MG.ADP-INHIBITED STATE OF THE YEAST F 1 C 10 ATP SYNTHASE Alain Dautant*, Jean Velours and Marie-France Giraud* From Université Bordeaux 2, CNRS; Institut de
BIMS 503 Exam I. Sign Pledge Here: Questions from Robert Nakamoto (40 pts. Total)
") BIMS 503 Exam I September 24, 2007 _ /email: Sign Pledge Here: Questions from Robert Nakamoto (40 pts. Total) Questions 1-6 refer to this situation: You are able to partially purify an enzyme activity
BIMS 503 Exam I September 24, 2007 _ /email: Sign Pledge Here: Questions from Robert Nakamoto (40 pts. Total) Questions 1-6 refer to this situation: You are able to partially purify an enzyme activity
Supplementary Figures
 1 Supplementary Figures Supplementary Figure 1 Type I FGFR1 inhibitors (a) Chemical structures of a pyrazolylaminopyrimidine inhibitor (henceforth referred to as PAPI; PDB-code of the FGFR1-PAPI complex:
Supporting Information for. Jesinghaus, Rachael Barry, Zemer Gitai, Justin Kollman and Enoch P. Baldwin
 Supporting Information for Inhibition of E. coli CTP synthetase by NADH and other nicotinamides, and their mutual interactions with CTP and GTP Chris Habrian, Adithi Chandrasekhara, Bita Shahrvini, Brian
Nature Structural & Molecular Biology: doi: /nsmb.3194
 Supplementary Figure 1 Mass spectrometry and solution NMR data for -syn samples used in this study. (a) Matrix-assisted laser-desorption and ionization time-of-flight (MALDI-TOF) mass spectrum of uniformly-
Structural characterization of NiV N 0 P in solution and in crystal.
 Supplementary Figure 1 Structural characterization of NiV N 0 P in solution and in crystal. (a) SAXS analysis of the N 32-383 0 -P 50 complex. The Guinier plot for complex concentrations of 0.55, 1.1,
NMR study of complexes between low molecular mass inhibitors and the West Nile virus NS2B-NS3 protease
 University of Wollongong Research Online Faculty of Science - Papers (Archive) Faculty of Science, Medicine and Health 2009 NMR study of complexes between low molecular mass inhibitors and the West Nile
Supplementary Information. Overlap between folding and functional energy landscapes for. adenylate kinase conformational change
 Supplementary Information Overlap between folding and functional energy landscapes for adenylate kinase conformational change by Ulrika Olsson & Magnus Wolf-Watz Contents: 1. Supplementary Note 2. Supplementary
Supplemental Information. Molecular Basis of Spectral Diversity. in Near-Infrared Phytochrome-Based. Fluorescent Proteins
 Chemistry & Biology, Volume 22 Supplemental Information Molecular Basis of Spectral Diversity in Near-Infrared Phytochrome-Based Fluorescent Proteins Daria M. Shcherbakova, Mikhail Baloban, Sergei Pletnev,
SUPPLEMENTARY INFORMATION
 Table of Contents Page Supplementary Table 1. Diffraction data collection statistics 2 Supplementary Table 2. Crystallographic refinement statistics 3 Supplementary Fig. 1. casic1mfc packing in the R3
Examples of Protein Modeling. Protein Modeling. Primary Structure. Protein Structure Description. Protein Sequence Sources. Importing Sequences to MOE
 Examples of Protein Modeling Protein Modeling Visualization Examination of an experimental structure to gain insight about a research question Dynamics To examine the dynamics of protein structures To
NMR Resonance Assignment Assisted by Mass Spectrometry
 NMR Resonance Assignment Assisted by Mass Spectrometry This lecture talked about a NMR resonance assignment assisted by mass spectrometry [1, 2]. 1 Motivation Nuclear magnetic resonance (NMR) provides
Structure and RNA-binding properties. of the Not1 Not2 Not5 module of the yeast Ccr4 Not complex
 Structure and RNA-binding properties of the Not1 Not2 Not5 module of the yeast Ccr4 Not complex Varun Bhaskar 1, Vladimir Roudko 2,3, Jerome Basquin 1, Kundan Sharma 4, Henning Urlaub 4, Bertrand Seraphin
Understanding the determinants of selectivity in drug metabolism through modeling of dextromethorphan oxidation by cytochrome P450
 Understanding the determinants of selectivity in drug metabolism through modeling of dextromethorphan oxidation by cytochrome P450 Julianna Oláh, 1 Adrian J. Mulholland* and Jeremy N. Harvey* School of
Timescales of Protein Dynamics
 Timescales of Protein Dynamics From Henzler-Wildman and Kern, Nature 2007 Dynamics from NMR Show spies Amide Nitrogen Spies Report On Conformational Dynamics Amide Hydrogen Transverse Relaxation Ensemble
Serine-7 but not serine-5 phosphorylation primes RNA polymerase II CTD for P-TEFb recognition
 Supplementary Information to Serine-7 but not serine-5 phosphorylation primes RNA polymerase II CTD for P-TEFb recognition Nadine Czudnochowski 1,2, *, Christian A. Bösken 1, * & Matthias Geyer 1 1 Max-Planck-Institut
SUPPLEMENTARY INFORMATION
 Fig. 1 Influences of crystal lattice contacts on Pol η structures. a. The dominant lattice contact between two hpol η molecules (silver and gold) in the type 1 crystals. b. A close-up view of the hydrophobic
Supplementary Figure 1 Crystal contacts in COP apo structure (PDB code 3S0R)
") Supplementary Figure 1 Crystal contacts in COP apo structure (PDB code 3S0R) Shown in cyan and green are two adjacent tetramers from the crystallographic lattice of COP, forming the only unique inter-tetramer
Supplementary Figure 1 Crystal contacts in COP apo structure (PDB code 3S0R) Shown in cyan and green are two adjacent tetramers from the crystallographic lattice of COP, forming the only unique inter-tetramer
NMR-Structure determination with the program CNS
 NMR-Structure determination with the program CNS Blockkurs 2013 Exercise 11.10.2013, room Mango? 1 NMR-Structure determination - Overview Amino acid sequence Topology file nef_seq.mtf loop cns_mtf_atom.id
Design of a Novel Globular Protein Fold with Atomic-Level Accuracy
 Design of a Novel Globular Protein Fold with Atomic-Level Accuracy Brian Kuhlman, Gautam Dantas, Gregory C. Ireton, Gabriele Varani, Barry L. Stoddard, David Baker Presented by Kate Stafford 4 May 05 Protein
BSc and MSc Degree Examinations
 Examination Candidate Number: Desk Number: BSc and MSc Degree Examinations 2018-9 Department : BIOLOGY Title of Exam: Molecular Biology and Biochemistry Part I Time Allowed: 1 hour and 30 minutes Marking
The copper active site in CBM33 polysaccharide oxygenases
 Supporting Information for: The copper active site in CBM33 polysaccharide oxygenases Glyn R. Hemsworth, Edward J. Taylor, Robbert Q. Kim, Rebecca C. Gregory, Sally J. Lewis, Johan P. Turkenburg, Alison
THE CRYSTAL STRUCTURE OF THE SGT1-SKP1 COMPLEX: THE LINK BETWEEN
 THE CRYSTAL STRUCTURE OF THE SGT1-SKP1 COMPLEX: THE LINK BETWEEN HSP90 AND BOTH SCF E3 UBIQUITIN LIGASES AND KINETOCHORES Oliver Willhoft, Richard Kerr, Dipali Patel, Wenjuan Zhang, Caezar Al-Jassar, Tina
Timescales of Protein Dynamics
 Timescales of Protein Dynamics From Henzler-Wildman and Kern, Nature 2007 Summary of 1D Experiment time domain data Fourier Transform (FT) frequency domain data or Transverse Relaxation Ensemble of Nuclear
Pymol Practial Guide
 Pymol Practial Guide Pymol is a powerful visualizor very convenient to work with protein molecules. Its interface may seem complex at first, but you will see that with a little practice is simple and powerful
SUPPLEMENTARY INFORMATION
 Dph2 SeMet (iron-free) # Dph2 (iron-free) Dph2-[4Fe-4S] Data collection Space group P2 1 2 1 2 1 P2 1 2 1 2 1 P2 1 2 1 2 1 Cell dimensions a, b, c (Å) 58.26, 82.08, 160.42 58.74, 81.87, 160.01 55.70, 80.53,
NMR in Structural Biology
 NMR in Structural Biology Exercise session 2 1. a. List 3 NMR observables that report on structure. b. Also indicate whether the information they give is short/medium or long-range, or perhaps all three?
I690/B680 Structural Bioinformatics Spring Protein Structure Determination by NMR Spectroscopy
 I690/B680 Structural Bioinformatics Spring 2006 Protein Structure Determination by NMR Spectroscopy Suggested Reading (1) Van Holde, Johnson, Ho. Principles of Physical Biochemistry, 2 nd Ed., Prentice
Practical Manual. General outline to use the structural information obtained from molecular alignment
 Practical Manual General outline to use the structural information obtained from molecular alignment 1. In order to use the information one needs to know the direction and the size of the tensor (susceptibility,
Supplementary Figure 1 Mycobacterium tuberculosis WhiB1 expressed in Mycobacterium smegmatis possesses an O 2 -stable [4Fe-4S] cluster.
![Supplementary Figure 1 Mycobacterium tuberculosis WhiB1 expressed in Mycobacterium smegmatis possesses an O 2 -stable [4Fe-4S] cluster.](/thumbs/80/81296835.jpg "Supplementary Figure 1 Mycobacterium tuberculosis WhiB1 expressed in Mycobacterium smegmatis possesses an O 2 -stable [4Fe-4S] cluster.") Supplementary Figure 1 Mycobacterium tuberculosis WhiB1 expressed in Mycobacterium smegmatis possesses an O 2 -stable [4Fe-4S] cluster. a, Absorbance spectra of WhiB1 isolated from recombinant M. smegmatis
Supplementary Figure 1 Mycobacterium tuberculosis WhiB1 expressed in Mycobacterium smegmatis possesses an O 2 -stable [4Fe-4S] cluster. a, Absorbance spectra of WhiB1 isolated from recombinant M. smegmatis
SUPPLEMENTARY INFORMATION
 Supplementary Table 1: Data collection, phasing and refinement statistics ChbC/Ta 6 Br 12 Native ChbC Data collection Space group P4 3 2 1 2 P4 3 2 1 2 Cell dimensions a, c (Å) 132.75, 453.57 132.81, 452.95
SUPPLEMENTARY INFORMATION
 Supplementary Table 1: Amplitudes of three current levels. Level 0 (pa) Level 1 (pa) Level 2 (pa) TrkA- TrkH WT 200 K 0.01 ± 0.01 9.5 ± 0.01 18.7 ± 0.03 200 Na * 0.001 ± 0.01 3.9 ± 0.01 12.5 ± 0.03 200
Structure and Function of Neisseria gonorrhoeae MtrF Illuminates a Class of Antimetabolite Efflux Pumps
 Cell Reports Supplemental Information Structure and Function of Neisseria gonorrhoeae MtrF Illuminates a Class of Antimetabolite Efflux Pumps Chih-Chia Su, Jani Reddy Bolla, Nitin Kumar, Abhijith Radhakrishnan,
Supplemental Information. The Mitochondrial Fission Receptor MiD51. Requires ADP as a Cofactor
 Structure, Volume 22 Supplemental Information The Mitochondrial Fission Receptor MiD51 Requires ADP as a Cofactor Oliver C. Losón, Raymond Liu, Michael E. Rome, Shuxia Meng, Jens T. Kaiser, Shu-ou Shan,
LineShapeKin NMR Line Shape Analysis Software for Studies of Protein-Ligand Interaction Kinetics
 LineShapeKin NMR Line Shape Analysis Software for Studies of Protein-Ligand Interaction Kinetics http://lineshapekin.net Spectral intensity Evgenii L. Kovrigin Department of Biochemistry, Medical College
Computational Protein Design
 11 Computational Protein Design This chapter introduces the automated protein design and experimental validation of a novel designed sequence, as described in Dahiyat and Mayo [1]. 11.1 Introduction Given
Figure S1. Interaction of PcTS with αsyn. (a) 1 H- 15 N HSQC NMR spectra of 100 µm αsyn in the absence (0:1, black) and increasing equivalent
 1 H- 15 N HSQC NMR spectra of 100 µm αsyn in the absence (0:1, black) and increasing equivalent") Figure S1. Interaction of PcTS with αsyn. (a) 1 H- 15 N HSQC NMR spectra of 100 µm αsyn in the absence (0:1, black) and increasing equivalent concentrations of PcTS (100 µm, blue; 500 µm, green; 1.5 mm,
Figure S1. Interaction of PcTS with αsyn. (a) 1 H- 15 N HSQC NMR spectra of 100 µm αsyn in the absence (0:1, black) and increasing equivalent concentrations of PcTS (100 µm, blue; 500 µm, green; 1.5 mm,
7. Nuclear Magnetic Resonance
 7. Nuclear Magnetic Resonance Nuclear Magnetic Resonance (NMR) is another method besides crystallography that can be used to find structures of proteins. NMR spectroscopy is the observation of spins of
Supporting Information for. Models for the Metal Transfer Complex of the N-terminal Region of CusB and. CusF
 Supporting Information for Models for the Metal Transfer Complex of the N-terminal Region of CusB and CusF Melek N. Ucisik, Dhruva K. Chakravorty, and Kenneth M. Merz Jr. * Department of Chemistry and
SUPPLEMENTARY INFORMATION
 doi:10.1038/nature12045 Supplementary Table 1 Data collection and refinement statistics. Native Pt-SAD X-ray source SSRF BL17U SPring-8 BL41XU Wavelength (Å) 0.97947 1.07171 Space group P2 1 2 1 2 1 P2
Figure 1. Molecules geometries of 5021 and Each neutral group in CHARMM topology was grouped in dash circle.
 Project I Chemistry 8021, Spring 2005/2/23 This document was turned in by a student as a homework paper. 1. Methods First, the cartesian coordinates of 5021 and 8021 molecules (Fig. 1) are generated, in
CH 3 CH 2 OH +H 2 O CHO. 2e + 2H + + O 2 H 2 O +HCOOH
 2 4 H CH 3 2e + 2H + + 2 H 2 2 H CH 2 H 2e + 2H + + 2 H 2 2 H +H 2 CH 2e + 2H + + 2 H 2 2 H +HCH Supplemental Figure S. The three-step 4DM reaction, each step requires two reducing equivalents from ADPH
ion mobility spectrometry IR spectroscopy
 Debasmita Gho 29.10.2016 Introducti on Owing to its accuracy, sensitivity, and speed, mass spectrometry (MS) coupled to fragmentation techniques is the method of choice for determining the primary structure
Bacterial protease uses distinct thermodynamic signatures for substrate recognition
 Bacterial protease uses distinct thermodynamic signatures for substrate recognition Gustavo Arruda Bezerra, Yuko Ohara-Nemoto, Irina Cornaciu, Sofiya Fedosyuk, Guillaume Hoffmann, Adam Round, José A. Márquez,
Supplementary Figure 1 Pairing alignments, turns and extensions within the structure of the ribozyme-product complex. (a) The alignment of the G27
 The alignment of the G27") Supplementary Figure 1 Pairing alignments, turns and extensions within the structure of the ribozyme-product complex. (a) The alignment of the G27 A40 non-canonical pair stacked over the A41 (G1-C26) three-base
Supplementary Figure 1 Pairing alignments, turns and extensions within the structure of the ribozyme-product complex. (a) The alignment of the G27 A40 non-canonical pair stacked over the A41 (G1-C26) three-base
Protein Structure Determination using NMR Spectroscopy. Cesar Trinidad
 Protein Structure Determination using NMR Spectroscopy Cesar Trinidad Introduction Protein NMR Involves the analysis and calculation of data collected from multiple NMR techniques Utilizes Nuclear Magnetic
Atomic structure and handedness of the building block of a biological assembly
 Supporting Information: Atomic structure and handedness of the building block of a biological assembly Antoine Loquet, Birgit Habenstein, Veniamin Chevelkov, Suresh Kumar Vasa, Karin Giller, Stefan Becker,
Supporting Information
 Supporting Information Copyright Wiley-VCH Verlag GmbH & Co. KGaA, 69451 Weinheim, 2014 An Ensemble of Rapidly Interconverting Orientations in Electrostatic Protein Peptide Complexes Characterized by NMR
Pathogenic C9ORF72 Antisense Repeat RNA Forms a Double Helix with Tandem C:C Mismatches
 Supporting Information Pathogenic C9ORF72 Antisense Repeat RNA Forms a Double Helix with Tandem C:C Mismatches David W. Dodd, Diana R. Tomchick, David R. Corey, and Keith T. Gagnon METHODS S1 RNA synthesis.
Protein Bioinformatics Computer lab #1 Friday, April 11, 2008 Sean Prigge and Ingo Ruczinski
 Protein Bioinformatics 260.655 Computer lab #1 Friday, April 11, 2008 Sean Prigge and Ingo Ruczinski Goals: Approx. Time [1] Use the Protein Data Bank PDB website. 10 minutes [2] Use the WebMol Viewer.
Chapter 3. Dynamics in a high-affinity peptide-sh2 domain complex
 Dynamics in a high-affinity peptide-sh2 domain complex 47 Abstract The interaction between the tyrosine kinases Src and focal adhesion kinase (FAK) is a key step in signalling processes from focal adhesions.
Nitrogenase MoFe protein from Clostridium pasteurianum at 1.08 Å resolution: comparison with the Azotobacter vinelandii MoFe protein
 Acta Cryst. (2015). D71, 274-282, doi:10.1107/s1399004714025243 Supporting information Volume 71 (2015) Supporting information for article: Nitrogenase MoFe protein from Clostridium pasteurianum at 1.08
Nature Structural & Molecular Biology: doi: /nsmb Supplementary Figure 1
 Supplementary Figure 1 Resonance assignment and NMR spectra for hairpin and duplex A 6 constructs. (a) 2D HSQC spectra of hairpin construct (hp-a 6 -RNA) with labeled assignments. (b) 2D HSQC or SOFAST-HMQC