Supplementary Figure 1.
|
|
|
- Nicholas Atkins
- 5 years ago
- Views:
Transcription

1 a b c d e f g 1
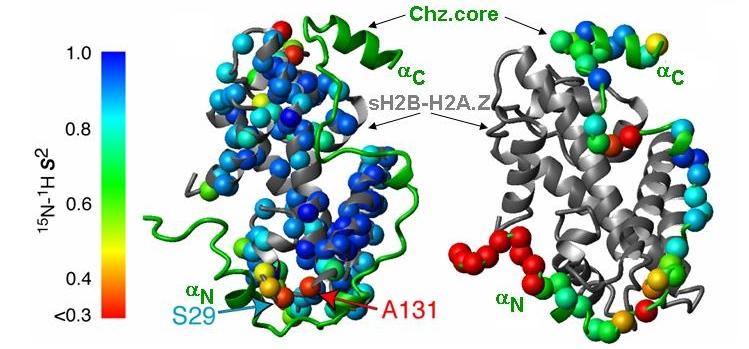
2 Supplementary Figure 1. Identification of unfolded regions in the Chz1-H2A.Z-H2B complex and structure and dynamics of Chz.core-sH2B_H2A.Z. (a) 1 H- 15 N HSQC spectrum of Chz1. All backbone amide protons are in the narrow range from 7.6 ppm to 8.8 ppm (red frame), indicating that Chz1 alone is unstructured. (b) 1 H- 15 N HSQC spectrum of Chz1-H2A.Z-H2B complex (~45 Kd) with [ 15 N, 13 C]-labeled Chz1 and nonlabeled H2A.Z-H2B. The observed peaks are also in the same narrow range as in (a), indicating they are in the unfolded regions of Chz1 in the Chz1-H2A.Z-H2B complex. The peaks that were assigned are labeled with single-letter amino acid codes followed by the residue numbers. (c) HSQC spectra of [ 15 N, 2 H]-labeled sh2b_h2a.z (red) and [ 15 N, 2 H]-labeled full-length H2A.Z-H2B (black). The peaks that disappeared in the spectrum of sh2b_h2a.z correspond to the strong peaks in the spectrum of the full-length H2A.Z- H2B. They are also in the narrow range of 1 H chemical shifts as in (a), indicating that the deleted tails are unfolded in the full-length H2A.Z-H2B. The weak peaks in the two spectra are essentially identical, indicating that the reengineering has not perturbed the folded region. (d) The amino acid sequence of Chz1, H2A.Z and H2B. (e) Ca traces of 10 NMR structures of CZB superimposed on residues in Chz.core, in H2B, and in H2A.Z. Chz.core, H2B, and H2A.Z are in green, red, and cyan, respectively. (f) Illustration of order parameters on the structure of the complex for sh2b_h2a.z. (g) Illustration of order parameters on the structure of the complex for Chz.core. Structures of H2B (gray), H2A.Z (gray), and Chz.core (green) are represented with ribbons. The order parameters for measured residues are presented with colored balls. 2

-H δ1 (Chz.core L128) or H N (H2A.Z D105)-H γ2 (Chz.core T104) or both. The L128A mutation in Chz.core affects the chemical shift of D105 H N of H2A.")
.")
3 a b c d Supplementary Figure 2. Mutation-assisted identification of intermolecular NOEs. Residues with chemical shift changes of amide 1 H larger than 0.05 ppm or amide 15 N larger than 0.5 ppm in sh2b_h2a.z were recorded as close neighbors of the mutation site. Residues in Chz.core, H2B, and H2A.Z are in green, red, and cyan, respectively. L128 H δ1 and T104 H γ2 in Chz.core have similar chemical shifts that correspond to a cross-peak with D105 H N of H2A.Z in the N 15 -edited NOE spectrum. Therefore, this cross-peak may represent the NOE of H N (H2A.Z D105)-H δ1 (Chz.core L128) or H N (H2A.Z D105)-H γ2 (Chz.core T104) or both. The L128A mutation in Chz.core affects the chemical shift of D105 H N of H2A.Z (a), supporting that these two residues are close in distance. By contrast, the I102A mutation in Chz.core, which is at the neighbor site of T104 of Chz.core, has no effect on the chemical shifts of D105 of H2A.Z or its neighbor residues (b). Moreover, the I102A mutation affects the chemical shifts of the residues in the αc and α3 of H2B (red balls in b) that are far away from D105 of H2A.Z in the structure of sh2b_h2a.z, indicating that Chz.core T104 is not close to H2A.Z D105 in space. Thus, the above mutation analyses unambiguously assign the NOE cross-peak to H N (H2A.Z D105)-H δ1 (Chz.core L128). (c) and (d) Additional two mutants as those shown in figure 1b. The residues that are affected by the mutations are shown in the following table. Chz.core a Residues in sh2b_h2a.z (secondary structure) affected by mutations Mutations M79A 41(α1), 43(α1), 60(α2) A82G 34(αN), 41(α1), 53(L1), 54(L1), 60(α2), 62(α2) L84A 40(α1), 126(αC), 39(L), 41(α1), 42(α1), 43(α1), 44(α1), 60(α2) 3
4 L87A 43(α2), 60(α2) L99A 96(α3), 99(α3), 105(α3), 119(αC), 122(αC), 124(αC), 125(αC), 126(αC), 57(L1), 60(α2), 63(α2), 65(α2), 66(α2) I102A 96(α3), 97(α3), 99(α3), 100(α3), 109(αC), 115(αC), 117(αC), 118(αC), 119(αC), 120(αC), 121(αC), 122(αC), 123(αC), 124(αC), 125(αC), 126(αC), 70(α2), 72(α2) I107A 99(α3), 109(αC), 113(αC), 115(αC), 116(αC), 118(αC), 119(αC), 120(αC), 121(αC), 122(αC), 124(αC), 128(αC), 41(α1), 43(α1), 60(α2), 62(α2) I108A 99(α3), 110(αC), 111(αC), 112(αC), 116(αC), 119(αC), 120(αC), 122(αC), 34(αN), 62(α2) T114A 77(α2), 79(α2), 81(α2), 83(α2), 84(α2), 85(α2) I119A 75(α2), 81(α2), 82(α2), 83(α2), 84(α2), 85(α2), 98(α3), 101(α3), 102(α3), 104(α3), 105(L), 109(αC) L128A 76(α2), 81(α2), 83(α2), 84(α2), 85(α2), 101(α3), 102(α3), 104(α3), 105(L), 109(αC), 110(αC) a Residues with chemical shift changes of amide 1 H larger than 0.05 ppm or amide 15 N larger than 0.5 ppm in sh2b_h2a.z. Residues in Chz.core, H2B, and H2A.Z are in green, red, and cyan, respectively. 4

5 Supplementary Figure 3. Comparison of the structures of sh2b_h2a.z in the CZB complex and H2B-H2A.Z in the nucleosome. The two structures are superimposed on their backbones and presented with ribbons. H2B and H2A.Z in sh2b_h2a.z are in red and cyan, respectively; H2B and H2A.Z in the nucleosome are in brown and blue, respectively. The arrows indicate the C-terminus of H2B and N-terminus of H2A.Z in the structure of nucleosome. The similarity of the structure of sh2b_h2a.z in the complex and the structure of H2B-H2A.Z further supports that single chain sh2b_h2a.z did not change the histone structure. A single chain histone is made for two purposes: (1) to increase the stability of the complex so that the structure determination can be performed at higher temperature (35 o C) (High temperature is good for the sensitivity of NMR experiments); (2) to reduce the number of molecules to form the complex, which saves significant amount of time and money because expensive [ 15 N, 13 C, 2 H]-labelings of protein molecules are needed. 5


6 a b C-helix α2 ~180o α1 α1 α2 N-helix α3 α1 αc c Protein A-Chz.core sh2b-h2a.z M αc d 6 α2
7 Supplementary Figure 4. Hydrophobic and electrostatic interactions between Chz.core and sh2b_h2a.z. (a) Although there are three hydrophobic residues (M79, L84, and L87) in the N-helix of Chz.core, they don not form hydrophobic interactions with histones. (b), Identifiable hydrophobic interactions between residue pairs, including L99 Chz.core -V88 H2B, I102 Chz.core -R120 H2B, and I108 Chz.core -K112 H2B, can be verified by the experimentally measured specific distance restraints. Possible hydrophobic interactions may also occur to residue pairs: V119 Chz.core -L100 H2A.Z, Y120 Chz.core -L88 H2A.Z, and L128 Chz.core -G104 H2A.Z. However, no observable specific distance restraints for these interactions could be identified and they only occur in some of the calculated structures. We note that the histone chaperone Asf1 forms complex with H3-H4 through broad interactions including electrostatic, hydrogen binding, and hydrophobic interactions, which is consistent with our emphasis that histone chaperones are not merely negatively charged molecules that are required to prevent nonproductive aggregation of histones with DNA phosphates. (c) Examination of the role of electrostatic interactions in the stablization of the CZB complex with different ionic strength (Supplementary Methods). M: molecular weight marker. Lane 1-3: Protein A-Chz.core-sH2B_H2A.Z complex was washed with 2M, 1M and 0.2 M NaCl solution, respectively. The upper arrow indicates the bands for protein A-Chz.core fusion protein. The lower arrow indicates the band for sh2b_h2a.z. These results show that the CZB complex can be dissociated easily with the increase of ionic strength, indicating that electrostatic interactions play an important role for stabilizing the complex. (d) Stabilizing role of the electrostatic interactions between the positively charged residues in Chz.core and the acidic patch in histones. The experiments were done with mononuclesome and filtration method (see Supplementary Methods). Lane M: molecular weight marker. Lanes 1 and 1 : wild type histones; Lanes 2 and 2 : corresponding acidic patch residues (D105, E106 and E107 in H2A.Z and E109 in H2B) (Fig. 2c) were mutated to Q or N; Lanes 3 and 3 : corresponding acidic patch residues (E71, D105, E106, and E107 in H2A and E109 in H2B) (Fig. 2c) were mutated to Q or N. These results showed that the Chz could bind to WT nucleosomes but not those with acidic patch mutations, suggesting that the electrostatic interactions play a critical role in stabilizing the complex. Structural analysis also indicates that the electrostatic interactions derived from the structure should stabilize the complex. In the structure of the CZB complex, three regions in Chz.core form electrostatic interactions with H2A.Z-H2B: the N-helix (Fig. 2a), the negatively charged and the positively charged regions in the Chz motif (Fig. 2b). The N- helix (Fig. 2a) and the positively charged regions (Fig. 2b) in Chz.core must have used electrostatic interactions to stabilize the complex because no large hydrophobic residues exist at the interface between these two regions and the histones. In other words, if these electrostatic interactions did not play a stabilizing role, no other forces could account for the formation of the structures of these two regions in the complex. These results are fully consistent with the CZB structure in which a large number of charged residues form complementary electrostatic interactions between Chz.core and histones, whereas only few hydrophobic residues exist at their interface. They are also consistent with the fact that truncation of any of the large hydrophobic side chains in Chz.core did not disrupt the structure of the complex at 35 o C (Fig. 1b). 7
8 Supplementary Figure 5. Structural implications for the chaperone functions of Chz1. Position of Chz.core (green) after sh2b_h2a.z (not shown) in the CZB complex is superimposed on H2B (yellow)-h2a (red) in the nucleosome. The N-helix of Chz.core occupies DNA-binding sites of H2A-H2B while the Chz motif and the C-helix sit on top of the exposed region of H2A-H2B in the nucleosome. The blue sticks in blue are Arg residues. 8
 Overlay of the 1 H- 15 N HSQC spectra of non-labeled Chz 96-132 complexed with 15 N-labeled sh2b_h2a.z at 280 µm (green) and 15 N-labeled sh2b_h2a.z alone (black).")
9 a b c d Supplementary Figure 6. Binding of Chz to sh2b_h2a.z and mononucleosomes and its implications for potential H2A-H2B eviction. (a) Overlay of the 1 H- 15 N HSQC spectra of non-labeled Chz complexed with 15 N-labeled sh2b_h2a.z at 280 µm (green) and 15 N-labeled sh2b_h2a.z alone (black). The change of peak positions in the two spectra indicates that Chz binds to sh2b_h2a.z. (b) Overlay of the 1 H- 15 N HSQC spectra of non-labeled Chz complexed with 15 N-labeled sh2b_h2a.z at 280 µm (green) and 10 µm (red). The observable peaks at 10 µm overlap with the corresponding peaks at 280 µm. The disappearance of many peaks is likely due to the 9
10 dissociation/association between sh2b_h2a.z and Chz on the time scale that causes broadening of these peaks. The red circles and lines are used to emphasize that the peaks marked by them must arise from the complex. (c) SDS page gel detection for the binding between Chz and H2A-H2B/mononucleosome at ~3 µm. Lanes 1 and 5: molecular weight markers; Lanes 2, 3, and 4: proteins retained in the microcons after the filtrations of Chz , NCP-Chz , and Chz H2A-H2B, respectively. Lanes 6, 7, and 8: flow-through of Chz , NCP-Chz , and Chz H2A-H2B, respectively. Note that no H2A-H2B eviction by Chz1 alone at a molar ratio of 1:1 between Chz1 and nucleosome was observed (data not shown). (d), Coupled folding and binding of Chz.core to H2A-H2B after DNA is presumably locally dissociated from H2A-H2B in the nucleosome by SWR1. The blue sticks in blue are Arg residues. The established in vitro H2A.Z exchange assay under limiting amount of SWR1 showed that H2A.Z could be incorporated into chromatin in the presence of Chz1 (at a level similar to histone) and also in its absence (see Figure 5C of Luk et al. Mol Cell 25: p363, 2007). The replacement was somewhat less efficient in the absence of Chz1. Although this result appears to be consistent with the potential role of Chz1 on H2A-H2B eviction, we do not consider it a conclusive test for the above model because loss of histone dimers due to precipitation in the absence of chaperone cannot be easily controlled. Moreover, even in the absence of any precipitation, such test would not allow one to make definitive conclusions about the eviction process because the outcome of the experiment (controlled by the thermodynamics) does not necessarily reflect the eviction process (kinetics). An alternative approach that can monitor the eviction process such as the time-dependent photo cross-linking method is needed to test the model conclusively. 10
11 Supplementary Table 1. NMR and refinement statistics for the CZB structures. NMR distance and dihedral constraints Distance constraints Total NOE 4280 Intra-residue 765 Inter-residue 3515 Sequential ( i j = 1) 1234 Medium-range ( i j < 4) 1201 Long-range ( i j > 5) 1008 Intermolecular 79 Hydrogen bonds 196 Total dihedral angle restraints φ 123 ψ J HN-Ca 111 Chz.coresH2B_H2A.Z Structure statistics Violations (mean ± s.d.) Distance constraints (Å) ± Dihedral angle constraints (º) ± 0.02 Max. dihedral angle violation (º) 3.55 Max. distance constraint violation (Å) 0.31 Deviations from idealized geometry Bond lengths (Å) ± Bond angles (º) 0.60 ± 0.03 Impropers (º) 0.4 ± 0.2 Average pairwise r.m.s. deviation (Å) Heavy 1.45 Backbone 0.87 Pairwise r.m.s. deviation was calculated among 20 refined structures. 11
12 Supplementary Methods Chemical shift assignments, measurements of NOEs, and structure calculations Chemical shifts ( 1 H, 15 N, and 13 C) were assigned by performing triple-resonance experiments. Intermolecular NOEs were obtained from 15 N-edited NOESY experiments on [ 15 N, 2 H]-labeled sh2b_h2a.z complexed with non-labeled Chz.core and [ 15 N, 2 H]- labeled Chz.core complexed with non-labeled sh2b_h2a.z. Samples and pulse programs are shown in the following table. No. a: Htz1-H2B b: sh2b-htz1 c: Chz1 d: Chz.core NMR experiments Notes 1 Non-labeled a 15 N c 15 N HSQC Assignments of unfolded residues in Chz1 2 Non-labeled a ( 15 N, 13 C) c HNCACB CBCACONH Assignment of unfolded residues in 3 ( 15 N, 13 C, 2 H) b Non-labeled d TRHNCACB, TRHNCOCACB, TRHNCO TRHNCOCA, TRHNCA, CCCONH 4 ( 15 N, 13 C, 70% ( 15 N, 13 C, 2 H) d HCCCONH, or 30% 2 H) b HCCH-TOCSY 15 N-edited TOCSY 5 Chz1 Backbone assignments of sh2b-htz1 Histones side chain assignments 15 N b 15 N d 15 N-edited NOESY NOE determination 6 ( 15 N, 75% 2 H) b ( 15 N, 75% 2 H) d 15 N-edited NOESY NOE determination 7 15 N b ( 15 N, 13 C, 2 H) d TRHNCACB, TRHNCOCACB, TRHNCO TRHNCOCA, TRHNCA, CCCONH 8 ( 15 N, 75% 2 H) b ( 15 N, 75% 2 H) d NNOE, HNHA 15 N-edited TOCSY 9 ( 15 N, 13 C, 75% 2 H) ( 15 N, 13 C, 75% 2 H) HCCCONH HBHACONH 10 ( 15 N, 75% 2 H) b ( 15 N, 75% 2 H) d HCCH TOCSY C-NOESYHSQC 11 (99.9% 2 H or ( 15 N, 75% 2 H N-NOESYHSQC 15 N, 75% 2 H) b or 99.9% 2 H) d (intra-protein) 12 ( 15 N, 99.9% 2 H (99.9% 2 H or 15 N-NOESYHSQC or 99.9% 2 H) b 99.9% 2 H) d (inter-protein) Backbone assignments of Chz.core Assignments and NOE determination Side chain assignment Assignments NOE determination NOE determination 12
13 (99.9% 2 H) d HCCH TOCSY HCCH TOCSY 13 ( 13 C, 75% or Assignment and NOE 25% 2 H) b C-NOESYHSQC determination 14 (99.9% 2 H) b ( 13 C, 75% or Assignment and NOE 25% 2 H) d C-NOESYHSQC determination 15 ( 13 C, 35%2H) b (99.9% 2 H) d 13 C NOESYHSQC HCCHTOCSY Assignments and NOE determination 16 (75% 2 H) b (75% 2 H) d NOESY Assignment and NOE determination 17 ( 15 N, 35% 2 H) b (99.9% 2 H) d NNOE, HNHA Assignments (99.9% HNCANNH Assignment 18 ( 15 N, 13 C, 75% 2 H or 2 H) b 2 H) d 2 H, or 99.9% 15 N, 13 C, 75% confirmation NMR data were processed with NMRPipe/NMRDraw 1, and analyzed with NMRVIEW 2. The NOE-derived restraints were subdivided into four classes, strong ( Å), medium ( Å), weak ( Å), and very weak ( Å), by comparison with NOEs of protons separated by known distances 3. An extra 0.5 Å was added to the upper distance limit for methyl protons. An extra 0.2 Å was added to the upper distance limit for NH protons if the NOEs were in the strong and medium classes. Backbone dihedral angle restraints (ϕ and ψ angles) were obtained from analysis of 1 H α, HN, 13 C α, 13 C β, 13 CO, and 15 N chemical shifts by using the program TALOS 4. Hydrogen bonds were identified on the basis of exchange rates of amide protons with 2 H 2 O. Amide protons that did not exchange significantly after the CZB complex was dissolved in 2 H 2 O for ~12 hours at 35 o C and ph 6.0 were considered to form hydrogen bonds in the complex. Two constants per hydrogen bond (d NH-O 2.2 Å and d N-O 3.2 Å) were added in the final structure calculation after initial NOE-derived structures were obtained. Structures were calculated using conjoined rigid body/torsion angle simulated annealing with the program Xplor-NIH. The quality of the structures was analyzed by using the program PROCHECK_NMR 5. Ramachandran plot statistics: most favored, 68.3%; allowed, 18.2%; generously allowed, 6.8%; disallowed, 1.5%. Dynamics of the CZB complex [ 15 N, 2 H]-labeled CZB at ~1 mm was used for the dynamics studies of the complex at ph 6.0 and 35 o C with a buffer solution containing 25 mm MES, 0.2 mm NaCl, 1 mm EDTA, and 10 % (v/v) D 2 O. Nitrogen R 1 and R 1ρ relaxation rates along with steady-state 15 N-{ 1 H} NOE values were obtained for the backbone amides at static magnetic field strengths of 18.8 T (R 1, R 1ρ, NOE); 14.1 T (R 1, NOE) and 11.7 T (R 1 ). Relaxation delays in the range from 0.01 to 1.4 sec and from to 0.1 sec were used to monitor the R 1 and R 1ρ rates, respectively. The CW field strength applied during the spin-lock period in the R 1ρ experiment was 2.0 khz. The 15 N-{ 1 H} NOEs were determined from two spectra, with and without proton pre-saturation. The spectrum with pre-saturation was recorded with a pre-scan delay of 9 seconds followed by 6 seconds of proton saturation, while the spectrum without proton pre-saturation was recorded with a 15-second pre-scan delay. 13
14 An exchange-free measure of the transverse nitrogen relaxation, R dd, was derived from the four relaxation rates R 1! (2H' z N z ), R 1! (2H z N' z ), R 1! 2 (2H' z N' z ), and R 1 (2H z N z ) that were measured at 18.8 T using pulse schemes described recently 1. Relaxation delays in the range from 2 to 25 msec were used for all experiments (same delays used for each rate measurement), along with 1 H and 15 N continuous wave CW spin-lock field strengths that varied between 11.0 khz ( 1 H) and 2.0 khz ( 15 N). A total of 10 2D data sets was recorded for each relaxation rate determination. Data sets were processed with the NMRPipe program and analyzed with Sparky (Goddard, T.D. & Kneller, D.G., UCSF). Signal intensities were determined using the program FuDA (Kristensen, S. M. and Hansen, D. F., smk@kiku.dk, available upon request) by fitting a mixed Gaussian/Lorentzian lineshape to each correlation and assuming a common line-shape for a given cross-peak during a relaxation series (i.e. lineshape and peak positions are independent of T relax ). Relaxation rates were determined by fitting a single exponential decay function [I(T relax ) = Aexp( R T relax )] to the measured intensity vs. T relax profile. The exchange-free measure of the transverse nitrogen relaxation, R dd, along with values for 15 N R 1, 1 H- 15 N NOE and the NMR structure of the CZB were used to derive the generalized order parameters of the backbone, S 2 and the diffusion parameters via the program ModelFree 4.16 (Palmer, A. G. III., agp@columbia.edu). Binding of Chz to sh2b_h2a.z and mononucleosome [ 15 N, 2 H]-labeled sh2b_h2a.z complexed with non-labeled Chz was made at 280 µm and subsequently diluted to 10 µm. The nucleosome core particle (NCP) was reconstituted using recombinant histones from Drosophila melanogaster and a 146 bp palindromic DNA fragment derived from human α satellite DNA 6. Drosophila nucleosome was used because it can be reconstituted with higher yield and the amino acid sequences of H2A-H2B in the exposed region in the nucleosome are essentially identical between Drosophila and yeast. The reconstituted NCP was purified by DEAE- 5PW HPLC column (TOSOH) and subjected to heat-shifting to localize the histone octamer to the center of DNA. NCP and Chz peptide were mixed at an equal molar ratio (measured by optical density at 280 nm) in 25 mm MES buffer solution (ph 6.0) and kept on ice for 30 minutes. The samples (200 µl, ~3.5 µm) were concentrated to about 30 µl with Microcon 100 (Amicon) with a cut-off size of 100 kda. They were diluted to 210 µl by adding 180 µl buffer and concentrated again. This procedure was repeated three times. The retentate and filtrate were collected, dried with a rotary evaporator and analyzed by SDS-PAGE (4 12 %). Effect of ionic strength on the binding between Chz.core and sh2b_h2a.z IgG-Sepharose resin 10 ul was washed extensively with wash buffer (25mM HEPES-KOH, 1mM EDTA, 10% glycerol, 0.01% NP-40, 0.2M NaCl, ph7.6). Protein A- Chz core fusion protein (final concentration is 2.5 µm) was incubated with IgG- Sepharose resin for 1 hr at 25 o C. The unbound proteins were removed by centrifuge at 2000Xg for 1 min and the resins were washed with 1 ml wash buffer for 3 times. 200 µm sh2a.z-h2b then was added with the final concentration of 0.3 µm and incubated with the resins for 1 hr at 25 o C. After removing supernatant, 1 ml wash buffers with different 14
15 concentration of NaCl were applied to wash the resins for 5 times. Resins were spun down and subsequently resuspended in 30 µl SDS loading buffer (22.5ul 1% SDS, 8M Urea, 10mM DTT, 7.5 µl dye). 1 µl of each sample was applied to SDS-PAGE. The gel was stained with Coomassie Blue. 15
16 Supplementary References 1. Delaglio, F. et al. NMRPipe: a multidimensional spectral processing system based on UNIX pipes. J. Biomol. NMR 6, (1995). 2. Johnson, B. A. & Blevins, R. A. NMR View: A computer program for the visualization and analysis of NMR data. J. Biomol. NMR 4, (1994). 3. Nguyen, B. D. et al. Solution Structure of the Carboxyl-Terminal Domain of RAP74 and NMR Characterization of the FCP1-Binding Sites of RAP74 and Human TFIIB. Biochemistry 42, (2003). 4. Cornilescu, G., Delaglio, F. & Bax, A. Protein backbone angle restraints from searching a database for chemical shift and sequence homology. J. Biomol. NMR 13, (1999). 5. Laskowski, R. A. et al. AQUA and PROCHECK-NMR: Programs for checking the quality of protein structures solved by NMR. J. Biomol. NMR 8, (1996). 6. Dyer, P. N. et al. Reconstitution of nucleosome core particles from recombinant histones and DNA. Methods Enzymol. 375, (2004). 16
SUPPLEMENTARY INFORMATION
 5 N 4 8 20 22 24 2 28 4 8 20 22 24 2 28 a b 0 9 8 7 H c (kda) 95 0 57 4 28 2 5.5 Precipitate before NMR expt. Supernatant before NMR expt. Precipitate after hrs NMR expt. Supernatant after hrs NMR expt.
Supporting Information
 Supporting Information Ellena et al. 10.1073/pnas.0908317106 SI Experimental Procedures Protein Expression and Sample Preparation. Syb(1 96) and Syb(1 116) from Rattus norvegicus were expressed in BL21(DE3)
Acta Crystallographica Section D
 Supporting information Acta Crystallographica Section D Volume 70 (2014) Supporting information for article: Structural basis of the heterodimerization of the MST and RASSF SARAH domains in the Hippo signalling
NMR in Medicine and Biology
 NMR in Medicine and Biology http://en.wikipedia.org/wiki/nmr_spectroscopy MRI- Magnetic Resonance Imaging (water) In-vivo spectroscopy (metabolites) Solid-state t NMR (large structures) t Solution NMR
Principles of NMR Protein Spectroscopy. 2) Assignment of chemical shifts in a protein ( 1 H, 13 C, 15 N) 3) Three dimensional structure determination
 Assignment of chemical shifts in a protein ( 1 H, 13 C, 15 N) 3) Three dimensional structure determination") 1) Protein preparation (>50 aa) 2) Assignment of chemical shifts in a protein ( 1 H, 13 C, 15 N) 3) Three dimensional structure determination Protein Expression overexpression in E. coli - BL21(DE3) 1
1) Protein preparation (>50 aa) 2) Assignment of chemical shifts in a protein ( 1 H, 13 C, 15 N) 3) Three dimensional structure determination Protein Expression overexpression in E. coli - BL21(DE3) 1
Supplemental Information
 Supplemental Information Combinatorial Readout of Unmodified H3R2 and Acetylated H3K14 by the Tandem PHD Finger of MOZ Reveals a Regulatory Mechanism for HOXA9 Transcription Yu Qiu 1, Lei Liu 1, Chen Zhao
Supplementary Materials for
 advances.sciencemag.org/cgi/content/full/4/1/eaau413/dc1 Supplementary Materials for Structure and dynamics conspire in the evolution of affinity between intrinsically disordered proteins Per Jemth*, Elin
BMB/Bi/Ch 173 Winter 2018
 BMB/Bi/Ch 173 Winter 2018 Homework Set 8.1 (100 Points) Assigned 2-27-18, due 3-6-18 by 10:30 a.m. TA: Rachael Kuintzle. Office hours: SFL 220, Friday 3/2 4:00-5:00pm and SFL 229, Monday 3/5 4:00-5:30pm.
Table S1. Primers used for the constructions of recombinant GAL1 and λ5 mutants. GAL1-E74A ccgagcagcgggcggctgtctttcc ggaaagacagccgcccgctgctcgg
 SUPPLEMENTAL DATA Table S1. Primers used for the constructions of recombinant GAL1 and λ5 mutants Sense primer (5 to 3 ) Anti-sense primer (5 to 3 ) GAL1 mutants GAL1-E74A ccgagcagcgggcggctgtctttcc ggaaagacagccgcccgctgctcgg
Table S1. Overview of used PDZK1 constructs and their binding affinities to peptides. Related to figure 1.
 Table S1. Overview of used PDZK1 constructs and their binding affinities to peptides. Related to figure 1. PDZK1 constru cts Amino acids MW [kda] KD [μm] PEPT2-CT- FITC KD [μm] NHE3-CT- FITC KD [μm] PDZK1-CT-
Supporting Information
 Supporting Information Micelle-Triggered b-hairpin to a-helix Transition in a 14-Residue Peptide from a Choline-Binding Repeat of the Pneumococcal Autolysin LytA HØctor Zamora-Carreras, [a] Beatriz Maestro,
Nature Structural & Molecular Biology: doi: /nsmb.3194
 Supplementary Figure 1 Mass spectrometry and solution NMR data for -syn samples used in this study. (a) Matrix-assisted laser-desorption and ionization time-of-flight (MALDI-TOF) mass spectrum of uniformly-
Protein NMR. Bin Huang
 Protein NMR Bin Huang Introduction NMR and X-ray crystallography are the only two techniques for obtain three-dimentional structure information of protein in atomic level. NMR is the only technique for
Supporting Protocol This protocol describes the construction and the force-field parameters of the non-standard residue for the Ag + -site using CNS
 Supporting Protocol This protocol describes the construction and the force-field parameters of the non-standard residue for the Ag + -site using CNS CNS input file generatemetal.inp: remarks file generate/generatemetal.inp
Introduction solution NMR
 2 NMR journey Introduction solution NMR Alexandre Bonvin Bijvoet Center for Biomolecular Research with thanks to Dr. Klaartje Houben EMBO Global Exchange course, IHEP, Beijing April 28 - May 5, 20 3 Topics
Sequential Assignment Strategies in Proteins
 Sequential Assignment Strategies in Proteins NMR assignments in order to determine a structure by traditional, NOE-based 1 H- 1 H distance-based methods, the chemical shifts of the individual 1 H nuclei
NMR in Structural Biology
 NMR in Structural Biology Exercise session 2 1. a. List 3 NMR observables that report on structure. b. Also indicate whether the information they give is short/medium or long-range, or perhaps all three?
SUPPLEMENTARY INFORMATION
 DOI: 10.1038/NCHEM.1299 Protein fold determined by paramagnetic magic-angle spinning solid-state NMR spectroscopy Ishita Sengupta 1, Philippe S. Nadaud 1, Jonathan J. Helmus 1, Charles D. Schwieters 2
Supporting Information. Copyright Wiley-VCH Verlag GmbH & Co. KGaA, Weinheim, 2009
 Supporting Information Copyright Wiley-VCH Verlag GmbH & Co. KGaA, 69451 Weinheim, 2009 Helical Hairpin Structure of a potent Antimicrobial Peptide MSI-594 in Lipopolysaccharide Micelles by NMR Anirban
Useful background reading
 Overview of lecture * General comment on peptide bond * Discussion of backbone dihedral angles * Discussion of Ramachandran plots * Description of helix types. * Description of structures * NMR patterns
Protein dynamics from NMR Relaxation data
 Protein dynamics from NMR Relaxation data Clubb 3/15/17 (S f2 ) ( e ) Nitrogen-15 relaxation ZZ-exchange R 1 = 1/T 1 Longitudinal relaxation (decay back to z-axis) R 2 = 1/T 2 Spin-spin relaxation (dephasing
Chapter 6. The interaction of Src SH2 with the focal adhesion kinase catalytic domain studied by NMR
 The interaction of Src SH2 with the focal adhesion kinase catalytic domain studied by NMR 103 Abstract The interaction of the Src SH2 domain with the catalytic domain of FAK, including the Y397 SH2 domain
Protein-protein interactions by NMR
 Protein-protein interactions by NMR Fast k on,off >> (ν free - ν bound ) A + B k on k off AB k on,off ~ (ν free - ν bound ) Slow k on,off
Protein-protein interactions and NMR: G protein/effector complexes
 Protein-protein interactions and NMR: G protein/effector complexes Helen Mott 5th CCPN Annual Conference, August 2005 Department of Biochemistry University of Cambridge Fast k on,off >> (ν free - ν bound
Using NMR to study Macromolecular Interactions. John Gross, BP204A UCSF. Nov 27, 2017
 Using NMR to study Macromolecular Interactions John Gross, BP204A UCSF Nov 27, 2017 Outline Review of basic NMR experiment Multidimensional NMR Monitoring ligand binding Structure Determination Review:
type GroEL-GroES complex. Crystals were grown in buffer D (100 mm HEPES, ph 7.5,
 Supplementary Material Supplementary Materials and Methods Structure Determination of SR1-GroES-ADP AlF x SR1-GroES-ADP AlF x was purified as described in Materials and Methods for the wild type GroEL-GroES
I690/B680 Structural Bioinformatics Spring Protein Structure Determination by NMR Spectroscopy
 I690/B680 Structural Bioinformatics Spring 2006 Protein Structure Determination by NMR Spectroscopy Suggested Reading (1) Van Holde, Johnson, Ho. Principles of Physical Biochemistry, 2 nd Ed., Prentice
1. 3-hour Open book exam. No discussion among yourselves.
 Lecture 13 Review 1. 3-hour Open book exam. No discussion among yourselves. 2. Simple calculations. 3. Terminologies. 4. Decriptive questions. 5. Analyze a pulse program using density matrix approach (omonuclear
Resonance assignments in proteins. Christina Redfield
 Resonance assignments in proteins Christina Redfield 1. Introduction The assignment of resonances in the complex NMR spectrum of a protein is the first step in any study of protein structure, function
Sequential resonance assignments in (small) proteins: homonuclear method 2º structure determination
 proteins: homonuclear method 2º structure determination") Lecture 9 M230 Feigon Sequential resonance assignments in (small) proteins: homonuclear method 2º structure determination Reading resources v Roberts NMR of Macromolecules, Chap 4 by Christina Redfield
Lecture 9 M230 Feigon Sequential resonance assignments in (small) proteins: homonuclear method 2º structure determination Reading resources v Roberts NMR of Macromolecules, Chap 4 by Christina Redfield
Timescales of Protein Dynamics
 Timescales of Protein Dynamics From Henzler-Wildman and Kern, Nature 2007 Summary of 1D Experiment time domain data Fourier Transform (FT) frequency domain data or Transverse Relaxation Ensemble of Nuclear
Timescales of Protein Dynamics
 Timescales of Protein Dynamics From Henzler-Wildman and Kern, Nature 2007 Dynamics from NMR Show spies Amide Nitrogen Spies Report On Conformational Dynamics Amide Hydrogen Transverse Relaxation Ensemble
Molecular Modeling lecture 2
 Molecular Modeling 2018 -- lecture 2 Topics 1. Secondary structure 3. Sequence similarity and homology 2. Secondary structure prediction 4. Where do protein structures come from? X-ray crystallography
PROTEIN'STRUCTURE'DETERMINATION'
 PROTEIN'STRUCTURE'DETERMINATION' USING'NMR'RESTRAINTS' BCMB/CHEM'8190' Programs for NMR Based Structure Determination CNS - Brünger, A. T.; Adams, P. D.; Clore, G. M.; DeLano, W. L.; Gros, P.; Grosse-Kunstleve,
Sensitive NMR Approach for Determining the Binding Mode of Tightly Binding Ligand Molecules to Protein Targets
 Supporting information Sensitive NMR Approach for Determining the Binding Mode of Tightly Binding Ligand Molecules to Protein Targets Wan-Na Chen, Christoph Nitsche, Kala Bharath Pilla, Bim Graham, Thomas
Supplemental Information
 Supplemental Information Neutralizing positive charges at the surface of a protein lowers its rate of amide hydrogen exchange without altering its structure or increasing its thermostability. Bryan F.
Protein Structure Determination Using NMR Restraints BCMB/CHEM 8190
 Protein Structure Determination Using NMR Restraints BCMB/CHEM 8190 Programs for NMR Based Structure Determination CNS - Brünger, A. T.; Adams, P. D.; Clore, G. M.; DeLano, W. L.; Gros, P.; Grosse-Kunstleve,
Protein Structure Determination using NMR Spectroscopy. Cesar Trinidad
 Protein Structure Determination using NMR Spectroscopy Cesar Trinidad Introduction Protein NMR Involves the analysis and calculation of data collected from multiple NMR techniques Utilizes Nuclear Magnetic
Triple Resonance Experiments For Proteins
 Triple Resonance Experiments For Proteins Limitations of homonuclear ( 1 H) experiments for proteins -the utility of homonuclear methods drops quickly with mass (~10 kda) -severe spectral degeneracy -decreased
Magnetic Resonance Lectures for Chem 341 James Aramini, PhD. CABM 014A
 Magnetic Resonance Lectures for Chem 341 James Aramini, PhD. CABM 014A jma@cabm.rutgers.edu " J.A. 12/11/13 Dec. 4 Dec. 9 Dec. 11" " Outline" " 1. Introduction / Spectroscopy Overview 2. NMR Spectroscopy
SUPPLEMENTARY ONLINE DATA
 SUPPLEMENTARY ONLINE DATA Secreted Isoform of Human Lynx1 (SLURP-2): Spatial Structure and Pharmacology of Interaction with Different Types of Acetylcholine Receptors E.N. Lyukmanova 1,2,*, M.A. Shulepko
Supplementary Figure 1. Stability constants of metal monohydroxides. The log K values are summarized according to the atomic number of each element
 Supplementary Figure 1. Stability constants of metal monohydroxides. The log K values are summarized according to the atomic number of each element as determined in a previous study 1. The log K value
Longitudinal-relaxation enhanced fast-pulsing techniques: New tools for biomolecular NMR spectroscopy
 Longitudinal-relaxation enhanced fast-pulsing techniques: New tools for biomolecular NMR spectroscopy Bernhard Brutscher Laboratoire de Résonance Magnétique Nucléaire Institut de Biologie Structurale -
Biochemistry Quiz Review 1I. 1. Of the 20 standard amino acids, only is not optically active. The reason is that its side chain.
 Biochemistry Quiz Review 1I A general note: Short answer questions are just that, short. Writing a paragraph filled with every term you can remember from class won t improve your answer just answer clearly,
PROTEIN NMR SPECTROSCOPY
 List of Figures List of Tables xvii xxvi 1. NMR SPECTROSCOPY 1 1.1 Introduction to NMR Spectroscopy 2 1.2 One Dimensional NMR Spectroscopy 3 1.2.1 Classical Description of NMR Spectroscopy 3 1.2.2 Nuclear
1) NMR is a method of chemical analysis. (Who uses NMR in this way?) 2) NMR is used as a method for medical imaging. (called MRI )
 NMR is a method of chemical analysis. (Who uses NMR in this way?) 2) NMR is used as a method for medical imaging. (called MRI )") Uses of NMR: 1) NMR is a method of chemical analysis. (Who uses NMR in this way?) 2) NMR is used as a method for medical imaging. (called MRI ) 3) NMR is used as a method for determining of protein, DNA,
Uses of NMR: 1) NMR is a method of chemical analysis. (Who uses NMR in this way?) 2) NMR is used as a method for medical imaging. (called MRI ) 3) NMR is used as a method for determining of protein, DNA,
NMR Assay of Purity and Folding
 NMR Assay of Purity and Folding Don t Need Resonance Assignments or Labeling 1D requires only 10-50 µm protein concentration 2D Provides A More Detailed Assay 15 N- 1 H HSQC 1 H COSY 13 C HSQC also! Analyze
SUPPLEMENTARY INFORMATION
 Supplementary materials Figure S1 Fusion protein of Sulfolobus solfataricus SRP54 and a signal peptide. a, Expression vector for the fusion protein. The signal peptide of yeast dipeptidyl aminopeptidase
Labelling strategies in the NMR structure determination of larger proteins
 Labelling strategies in the NMR structure determination of larger proteins - Difficulties of studying larger proteins - The effect of deuteration on spectral complexity and relaxation rates - NMR expts
Supplementary Figure 1. Biochemical and sequence alignment analyses the
 Supplementary Figure 1. Biochemical and sequence alignment analyses the interaction of OPTN and TBK1. (a) Analytical gel filtration chromatography analysis of the interaction between TBK1 CTD and OPTN(1-119).
Supplementary figure 1 Application of tmfret in LeuT. (a) To assess the feasibility of using tmfret for distance-dependent measurements in LeuT, a
 To assess the feasibility of using tmfret for distance-dependent measurements in LeuT, a") Supplementary figure 1 Application of tmfret in LeuT. (a) To assess the feasibility of using tmfret for distance-dependent measurements in LeuT, a series of tmfret-pairs comprised of single cysteine mutants
Supplementary figure 1 Application of tmfret in LeuT. (a) To assess the feasibility of using tmfret for distance-dependent measurements in LeuT, a series of tmfret-pairs comprised of single cysteine mutants
Electronic Supplemental Information
 Electronic Supplementary Material (ESI) for ChemComm. This journal is The Royal Society of Chemistry 2018 1 Electronic Supplemental Information Coexisting Order and Disorder Within a Common 40-Residue
Biological Sciences 11 Spring Experiment 4. Protein crosslinking
 Biological Sciences 11 Spring 2000 Experiment 4. Protein crosslinking = C - CH 2 - CH 2 - CH 2 - C = H H GA Cl - H 2 N N H 2 Cl - C - CH 2 - CH 2 - CH 2 - CH 2 - CH 2 - CH 2 - C DMS CH 3 CH 3 N - - C -
Interpreting and evaluating biological NMR in the literature. Worksheet 1
 Interpreting and evaluating biological NMR in the literature Worksheet 1 1D NMR spectra Application of RF pulses of specified lengths and frequencies can make certain nuclei detectable We can selectively
Biochemistry 530 NMR Theory and Practice
 Biochemistry 530 NMR Theory and Practice Gabriele Varani Department of Biochemistry and Department of Chemistry University of Washington 1D spectra contain structural information.. but is hard to extract:
Theory and Applications of Residual Dipolar Couplings in Biomolecular NMR
 Theory and Applications of Residual Dipolar Couplings in Biomolecular NMR Residual Dipolar Couplings (RDC s) Relatively new technique ~ 1996 Nico Tjandra, Ad Bax- NIH, Jim Prestegard, UGA Combination of
SUPPLEMENTARY INFORMATION
 doi:10.1038/nature10458 Active Site Remodeling in the Bifunctional Fructose-1,6- bisphosphate aldolase/phosphatase Juan Du, Rafael F. Say, Wei Lü, Georg Fuchs & Oliver Einsle SUPPLEMENTARY FIGURES Figure
BMB/Bi/Ch 173 Winter 2018
 BMB/Bi/Ch 173 Winter 2018 Homework Set 8.1 (100 Points) Assigned 2-27-18, due 3-6-18 by 10:30 a.m. TA: Rachael Kuintzle. Office hours: SFL 220, Friday 3/2 4-5pm and SFL 229, Monday 3/5 4-5:30pm. 1. NMR
Supplementary Information
 Electronic Supplementary Material (ESI) for Chemical Communications. This journal is The Royal Society of Chemistry 2017 Supplementary Information Probing the excited-state chemical shifts and exchange
THE CRYSTAL STRUCTURE OF THE SGT1-SKP1 COMPLEX: THE LINK BETWEEN
 THE CRYSTAL STRUCTURE OF THE SGT1-SKP1 COMPLEX: THE LINK BETWEEN HSP90 AND BOTH SCF E3 UBIQUITIN LIGASES AND KINETOCHORES Oliver Willhoft, Richard Kerr, Dipali Patel, Wenjuan Zhang, Caezar Al-Jassar, Tina
Name: BCMB/CHEM 8190, BIOMOLECULAR NMR FINAL EXAM-5/5/10
 Name: BCMB/CHEM 8190, BIOMOLECULAR NMR FINAL EXAM-5/5/10 Instructions: This is an open book, limited time, exam. You may use notes you have from class and any text book you find useful. You may also use
SUPPLEMENTARY INFORMATION
 Figure S1. Secondary structure of CAP (in the camp 2 -bound state) 10. α-helices are shown as cylinders and β- strands as arrows. Labeling of secondary structure is indicated. CDB, DBD and the hinge are
Jeff Grinstead SB 2006/2007. NMR Spectroscopy. NMR Spectroscopy JG/1 07
 NMR Spectroscopy Jeff Grinstead NMR Spectroscopy NMR for structural biology Challenges for determining protein structures using NMR Proteins have thousands of signals Assign the specific signal for each
LS1a Fall 2014 Problem Set #2 Due Monday 10/6 at 6 pm in the drop boxes on the Science Center 2 nd Floor
 LS1a Fall 2014 Problem Set #2 Due Monday 10/6 at 6 pm in the drop boxes on the Science Center 2 nd Floor Note: Adequate space is given for each answer. Questions that require a brief explanation should
SUPPLEMENTARY INFORMATION
 doi:10.1038/nature10955 Supplementary Figures Supplementary Figure 1. Electron-density maps and crystallographic dimer structures of the motor domain. (a f) Stereo views of the final electron-density maps
Figure S1. Interaction of PcTS with αsyn. (a) 1 H- 15 N HSQC NMR spectra of 100 µm αsyn in the absence (0:1, black) and increasing equivalent
 1 H- 15 N HSQC NMR spectra of 100 µm αsyn in the absence (0:1, black) and increasing equivalent") Figure S1. Interaction of PcTS with αsyn. (a) 1 H- 15 N HSQC NMR spectra of 100 µm αsyn in the absence (0:1, black) and increasing equivalent concentrations of PcTS (100 µm, blue; 500 µm, green; 1.5 mm,
Figure S1. Interaction of PcTS with αsyn. (a) 1 H- 15 N HSQC NMR spectra of 100 µm αsyn in the absence (0:1, black) and increasing equivalent concentrations of PcTS (100 µm, blue; 500 µm, green; 1.5 mm,
Introduction to Comparative Protein Modeling. Chapter 4 Part I
 Introduction to Comparative Protein Modeling Chapter 4 Part I 1 Information on Proteins Each modeling study depends on the quality of the known experimental data. Basis of the model Search in the literature
LineShapeKin NMR Line Shape Analysis Software for Studies of Protein-Ligand Interaction Kinetics
 LineShapeKin NMR Line Shape Analysis Software for Studies of Protein-Ligand Interaction Kinetics http://lineshapekin.net Spectral intensity Evgenii L. Kovrigin Department of Biochemistry, Medical College
Residual Dipolar Couplings BCMB/CHEM 8190
 Residual Dipolar Couplings BCMB/CHEM 8190 Recent Reviews Prestegard, A-Hashimi & Tolman, Quart. Reviews Biophys. 33, 371-424 (2000). Bax, Kontaxis & Tjandra, Methods in Enzymology, 339, 127-174 (2001)
Nature Structural & Molecular Biology: doi: /nsmb Supplementary Figure 1
 Supplementary Figure 1 Identification of the ScDcp2 minimal region interacting with both ScDcp1 and the ScEdc3 LSm domain. Pull-down experiment of untagged ScEdc3 LSm with various ScDcp1-Dcp2-His 6 fragments.
SUPPLEMENTARY INFORMATION
 SUPPLEMENTARY INFORMATION doi:10.1038/nature12242 C. thermophilum 666 RPAVLDNVYIRPALE-GKRVPGKVEIHQNGIRYQSPLSTTQRVDVLFSNIRHLFFQPCQN S. pombe 659 RPAHINDVYVRPAID-GKRLPGFIEIHQNGIRYQSPLRSDSHIDLLFSNMKHLFFQPCEG
Macromolecular X-ray Crystallography
 Protein Structural Models for CHEM 641 Fall 07 Brian Bahnson Department of Chemistry & Biochemistry University of Delaware Macromolecular X-ray Crystallography Purified Protein X-ray Diffraction Data collection
BSc and MSc Degree Examinations
 Examination Candidate Number: Desk Number: BSc and MSc Degree Examinations 2018-9 Department : BIOLOGY Title of Exam: Molecular Biology and Biochemistry Part I Time Allowed: 1 hour and 30 minutes Marking
Cryo-EM data collection, refinement and validation statistics
 1 Table S1 Cryo-EM data collection, refinement and validation statistics Data collection and processing CPSF-160 WDR33 (EMDB-7114) (PDB 6BM0) CPSF-160 WDR33 (EMDB-7113) (PDB 6BLY) CPSF-160 WDR33 CPSF-30
Nature Structural & Molecular Biology: doi: /nsmb Supplementary Figure 1
 Supplementary Figure 1 Resonance assignment and NMR spectra for hairpin and duplex A 6 constructs. (a) 2D HSQC spectra of hairpin construct (hp-a 6 -RNA) with labeled assignments. (b) 2D HSQC or SOFAST-HMQC
Supplementary Information. Overlap between folding and functional energy landscapes for. adenylate kinase conformational change
 Supplementary Information Overlap between folding and functional energy landscapes for adenylate kinase conformational change by Ulrika Olsson & Magnus Wolf-Watz Contents: 1. Supplementary Note 2. Supplementary
Supporting Information
 Supporting Information German Edition: DOI: Sampling of Glycan-Bound Conformers by the Anti-HIV Lectin Oscillatoria agardhii agglutinin in the Absence of Sugar** Marta G. Carneiro, Leonardus M. I. Koharudin,
ml. ph 7.5 ph 6.5 ph 5.5 ph 4.5. β 2 AR-Gs complex + GDP β 2 AR-Gs complex + GTPγS
 a UV28 absorption (mau) 9 8 7 5 3 β 2 AR-Gs complex β 2 AR-Gs complex + GDP β 2 AR-Gs complex + GTPγS β 2 AR-Gs complex dissociated complex excess nucleotides b 9 8 7 5 3 β 2 AR-Gs complex β 2 AR-Gs complex
Supplementary Figures
 Supplementary Figures Supplementary Figure 1. The asymmetric unit in para-iodio-phenylalanine crystal. The 50% probability ellipsoid representation was prepared using the Mercury Software. Colors are as
Supporting information for. Towards automatic protein backbone assignment using proton-detected 4D solid-state NMR data
 Supporting information for Towards automatic protein backbone assignment using proton-detected 4D solid-state NMR data Shengqi Xiang 1, Veniamin Chevelkov 1,2, Stefan Becker 1, Adam Lange 1,2,3 * 1 Max
Supporting Information
 Supporting Information Arai et al. 10.1073/pnas.15179911 SI Text Protein Expression and Purification. Myb3 (mouse, residues 84 315) was expressed in Escherichia coli as a fusion with the B1 domain of protein
According to the manufacture s direction (Pierce), RNA and DNA
, RNA and DNA") Supplementary method Electrophoretic Mobility-shift assay (EMSA) According to the manufacture s direction (Pierce), RNA and DNA oligonuleotides were firstly labeled by biotin. TAVb (1pM) was incubated
Supplementary method Electrophoretic Mobility-shift assay (EMSA) According to the manufacture s direction (Pierce), RNA and DNA oligonuleotides were firstly labeled by biotin. TAVb (1pM) was incubated
Bis sulfone Reagents. Figure 1.
 Bis sulfone Reagents An intact IgG molecule has four accessible inter chain disulfide bonds that can be reduced to form eight free cysteine thiols, which can serve as sites for conjugation. The reaction
Chapter 3. Dynamics in a high-affinity peptide-sh2 domain complex
 Dynamics in a high-affinity peptide-sh2 domain complex 47 Abstract The interaction between the tyrosine kinases Src and focal adhesion kinase (FAK) is a key step in signalling processes from focal adhesions.
Table 1. Crystallographic data collection, phasing and refinement statistics. Native Hg soaked Mn soaked 1 Mn soaked 2
 Table 1. Crystallographic data collection, phasing and refinement statistics Native Hg soaked Mn soaked 1 Mn soaked 2 Data collection Space group P2 1 2 1 2 1 P2 1 2 1 2 1 P2 1 2 1 2 1 P2 1 2 1 2 1 Cell
NMR study of complexes between low molecular mass inhibitors and the West Nile virus NS2B-NS3 protease
 University of Wollongong Research Online Faculty of Science - Papers (Archive) Faculty of Science, Medicine and Health 2009 NMR study of complexes between low molecular mass inhibitors and the West Nile
3D NMR 3D NMR 3D NMR. Visualising 3D NMR spectra. strip plots. preparation mixing mixing t1 t2 t3 I S T I
 3D NMR 3D NMR Chris Waudby c.waudby@ucl.ac.uk 3D NMR Visualising 3D NMR spectra preparation mixing mixing t1 t2 t3 I S T I 2 indirect dimensions, independently incremented evolution times Much longer acquisition
SUPPLEMENTARY INFORMATION
 SUPPLEMENTARY INFORMATION doi:10.1038/nature11524 Supplementary discussion Functional analysis of the sugar porter family (SP) signature motifs. As seen in Fig. 5c, single point mutation of the conserved
Effects of Chemical Exchange on NMR Spectra
 Effects of Chemical Exchange on NMR Spectra Chemical exchange refers to any process in which a nucleus exchanges between two or more environments in which its NMR parameters (e.g. chemical shift, scalar
Experimental Techniques in Protein Structure Determination
 Experimental Techniques in Protein Structure Determination Homayoun Valafar Department of Computer Science and Engineering, USC Two Main Experimental Methods X-Ray crystallography Nuclear Magnetic Resonance
Orientational degeneracy in the presence of one alignment tensor.
 Orientational degeneracy in the presence of one alignment tensor. Rotation about the x, y and z axes can be performed in the aligned mode of the program to examine the four degenerate orientations of two
Supplementary materials. Crystal structure of the carboxyltransferase domain. of acetyl coenzyme A carboxylase. Department of Biological Sciences
 Supplementary materials Crystal structure of the carboxyltransferase domain of acetyl coenzyme A carboxylase Hailong Zhang, Zhiru Yang, 1 Yang Shen, 1 Liang Tong Department of Biological Sciences Columbia
SUPPLEMENTARY INFORMATION
 In the format provided by the authors and unedited. SUPPLEMENTARY INFORMATION DOI: 10.1038/NCHEM.2720 1 2 3 Tuning underwater adhesion with cation-π interactions Matthew A. Gebbie, Wei Wei, Alex M. Schrader,
Finding Bonds, H-bonds
 Finding Bonds, H-bonds A hydrogen bond (HB) allows chunks of peptide relatively far away from each other to come close together. They are all over the place in globular proteins, so if we could identify
SUPPLEMENTARY FIGURES
 SUPPLEMENTARY FIGURES Supplementary Figure 1 Protein sequence alignment of Vibrionaceae with either a 40-residue insertion or a 44-residue insertion. Identical residues are indicated by red background.
HSQC spectra for three proteins
 HSQC spectra for three proteins SH3 domain from Abp1p Kinase domain from EphB2 apo Calmodulin What do the spectra tell you about the three proteins? HSQC spectra for three proteins Small protein Big protein
Filtered/edited NOESY spectra
 Filtered/edited NOESY spectra NMR Seminar HS 207 Nina Ripin 22..7 Overview NMR of biomolecular complexes Problems and Solutions Filtered/edited nomenclature Experimental elements NOESY vs filtered pulse
Basic principles of multidimensional NMR in solution
 Basic principles of multidimensional NMR in solution 19.03.2008 The program 2/93 General aspects Basic principles Parameters in NMR spectroscopy Multidimensional NMR-spectroscopy Protein structures NMR-spectra
Solution Structure of Syrian Hamster Prion Protein rprp(90-231)
") 5362 Biochemistry 1999, 38, 5362-5377 Solution Structure of Syrian Hamster Prion Protein rprp(90-231) He Liu, Shauna Farr-Jones, Nikolai B. Ulyanov, Manuel Llinas, Susan Marqusee, Darlene Groth, Fred E.
5362 Biochemistry 1999, 38, 5362-5377 Solution Structure of Syrian Hamster Prion Protein rprp(90-231) He Liu, Shauna Farr-Jones, Nikolai B. Ulyanov, Manuel Llinas, Susan Marqusee, Darlene Groth, Fred E.
SUPPLEMENTARY INFORMATION
 doi:10.1038/nature11054 Supplementary Fig. 1 Sequence alignment of Na v Rh with NaChBac, Na v Ab, and eukaryotic Na v and Ca v homologs. Secondary structural elements of Na v Rh are indicated above the