Everglades National Park
|
|
|
- Junior McKenzie
- 6 years ago
- Views:
Transcription

1 National Park Service U.S. Department of the Interior Water Budget, Climate Variability, and Predicting Salinity for Eastern Florida Bay Erik Stabenau and Kevin Kotun National Park Service Office:
2 Overview Salinity regime sets the ecological environment in Florida Bay Extreme events lead to shifts in ecological communities Salinity is variable and trending upward in Florida Bay Sea level rise (SLR) is expected to play an increasingly important role in coastal ecosystems In Florida Bay, the rate of SLR relative to changes in bank height has an effect on mixing between basins Salinity responds to other climate factors (rain, temperature) as well Monitoring data is available but the period of record is short for climate related analysis

3 Salinity management for maintaining critical habitats


4 Factors affecting salinity in Florida Bay Freshwater budget Sources: precipitation, freshwater flow from coast (stream, sheet, ground) Sinks: evaporation Mixing: tide and wind driven across complex boundaries

5 Sea Level Rise in Florida Bay Impact primarily based on changes in mixing Hypothesis: salinity regime will become more marine-like with reduced variance Reduced frequency and extent of extreme high/low salinity conditions Tipping points are unknown but could include; Changes in freshwater discharge if sea level breaches the coastal ridge. Changes in connectivity across basins Event based changes related to tropical storms causing mass movement of coasts or sediments

6 Sea-level rise Data from Little Madeira Bay Rate = +2.6 cm/decade Key West observed rate = +2.2 cm/decade

7 Sea-level rise Data from Little Madeira Bay Rate = +2.6 cm/decade Key West observed rate = +2.2 cm/decade Key West; 2.24 ± 0.16 mm/yr Station LM; 2.58 ± 0.47 mm/yr

8 What s at Risk?

9 What s at Risk?
10 Is sea level rise affecting salinity? Clear signal of sea level rise in the coastal zones of Florida Bay Station LM; 2.58 ± 0.47 mm/yr Salinity highly variable but has been increasing since Is this a trend or cycle? Is salinity predictable? Salinity
11 Developed by B. Cosby, W. Nuttle & F. Marshall with other contributors

12 Fathom basins and boundaries


13 Fathom: Flow to salinity relationships Model run: Existing conditions Monthly Salinity in coastal basins dependent on flow rates and mixing Evaporation Simulate trends and review results
14 Fathom: Marine influence and variability Marine influenced regions have smaller range and increased mean relative to freshwater influenced stations *Graphic from Fathom Model Structure and Salinity report
15 Fathom: Predicting Salinity Changes due to Sea Level Rise Using CESI base conditions Set SLR at 2.2 mm/yr Monthly Simulation Model result: Sea levels increase in Eastern Florida Bay
16 Fathom: Predicting Salinity Changes due to Sea Level Rise Using CESI base conditions Set SLR at 2.2 mm/yr Monthly Simulation Model results: Reduce seasonal variability Increase annual minimums
17 Fathom: Salinity and Accelerated Sea Level Rise Hypothetical for model evaluation purposes only Using CESI base conditions Set total SLR to reach 20 cm by end of simulated run Similar to SLR observed at Key West since 1910 Simulation run strictly for comparison of end point Model results: Reduce seasonal variability Increase annual minimums Hypothetical set of years Conditions moving away from estuarine goals for Florida Bay
18 Marine monitoring network 17 stations collecting hourly or higher resolution data in Stage Salinity Rain Water temperature Subset of those stations collect: Chlorophyll A Turbidity Dissolved oxygen Wind speed & direction Data available Live at: Validated: EVER_data_request@nps.gov
19 Observed: Salinity Time-series Central Zone Eastern Zone Year-to-year variability in salinity reflecting changes in precipitation, management, other long-term trends including climate.
20 Salinity variability Station WB Station LB Mean salinity values change by season and year No trend in salinity variability** - what about cycles?
21 Observed: ENSO influences dry season rainfall Data from Royal Palm station (marsh) or Florida Bay stations (marine) shows similar trend higher dry season totals in marsh ENSO index is categorized as being in a positive or negative phase when; (X < -0.5) or (X > +0.5) ENSO duration is variable 9 12 months ENSO cycle length is variable 3 5 years on average
22 ENSO influences dry season rainfall in Florida Bay ENSO phase effects relative amount of dry season rain Changes in dry season rainfall should affect salinity *Dry season rain analysis by Hagemeyer, NWS, produced for NOAA in 2006

23 ENSO variation of rain & flow expected to influence salinity in coastal basins Graph shows relationship between flow rate and salinity response Station LS (red) Station BS (blue) Result: Indicates salinity in coastal basins is very sensitive to relatively low flow rates during peak salinity time periods ENSO influences dry season rain, influencing flow during peak salinity periods
24 Frequency analysis on salinity observations WB Annual cycle present LB WB ENSO cycle was not detected in salinity data. LB
25 Discussion Detected sea level rise at rates equivalent to those observed in Key West ENSO related changes in dry season rain were observed Did not detect more marine-like conditions, with reduced salinity variation, in the bay ENSO related cycles in salinity were not observed Is this a trend or cycle? Is salinity predictable?
26 Discussion Detected sea level rise at rates equivalent to those observed in Key West ENSO related changes in dry season rain were observed Did not detect more marine-like conditions, with reduced salinity variation, in the bay ENSO related cycles in salinity were not observed Next steps: Targeted monitoring and modeling efforts to predict climate and management affects on salinity in Florida Bay. Continue: Time series of flow, rain, salinity, temperature, and wind Improve: Evaporation and groundwater data Fathom: Efforts aimed at understanding impact of sea level rise and changing bank heights on mixing and salinity Analysis of impact of climate cycles on salinity
27 Acknowledgements: This presentation contains coastal discharge data from the USGS (M. Zucker, J. Ward), Fathom model results (developed by B. Cosby, F. Marshall, and W. Nuttle), and data from the National Park Service s marine monitoring network. Data available at: EVER_data_request@nps.gov Questions or further discussion: Erik_Stabenau@nps.gov
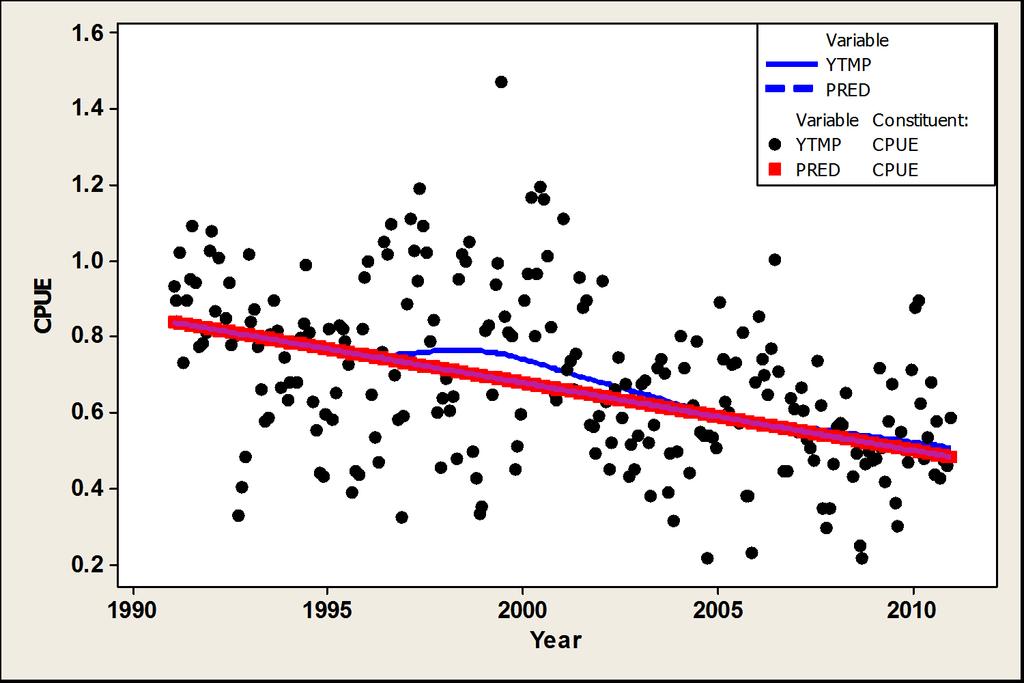
28 ABSTRACT Water Budget, Climate Variability, and Predicting Salinity for Eastern Florida Bay Erik Stabenau 1, Kevin Kotun 1 1 National Park Service, Homestead, FL, USA An increase in upstream freshwater flow to the marine transition zone of Florida Bay to reduce salinity levels in the coastal basins is an important goal of the Comprehensive Everglades Restoration Plan (CERP). CERP salinity performance measures for the coastal system are useful to evaluate the impacts of upstream flow restoration on seasonal salinity levels within the basins of Florida Bay. However, predicting the success of such projects is challenging, since cycles and trends in salinity in the natural system may be larger than salinity changes attributed to restoration alternatives being evaluated. The goal of this analysis is to determine the drivers of the seasonal variation and long-term trends in salinity and predicting how those drivers may influence salinity through the projected timeframe for CERP implementation. Since 1990, salinity values in eastern Florida Bay have shown wide variations on annual to interannual time scales. Prior to 1995, salinity ranged from euhaline to hypersaline conditions, while in , eastern Florida Bay experienced mesohaline conditions likely due to greater precipitation and freshwater discharge. While salinities were higher on average in 1990 than today, from 1994 through the present there has been an increasing trend in mean salinity. In addition, there is larger interannual variation in the range of salinity observed during the tropical wet or dry season cycles. Extensive monitoring in the region has allowed the development of a water budget which was then used to investigate the relative importance of the individual components on salinity in eastern Florida Bay. One critical issue is to determine if the increase in salinity is a secular trend or part of a cyclical process, and the likely outcome of each scenario. Trend related features, such as long-term changes in canal operations in the C-111 and related structures in the marsh or sea level rise in the marine environment may affect residence time within and exchange rates between basins and affect salinity. Cyclical features, such as annual cycles in precipitation and freshwater flow, experience changes in magnitude and timing due to connections with multi-year climate cycles. Recent advances in the understanding of these global drivers of local sea-level and regional precipitation patterns may improve our ability to understand the relative importance of the individual drivers of salinity variation. We will present predictions for the future salinity conditions in eastern Florida Bay, identify features that may be used to improve those predictions, and discuss their limitations. Contact information: Erik Stabenau,, National Park Service, 950 N. Krome Ave., Homestead, FL, , USA, Phone: , Erik_Stabenau@nps.gov
29 Fathom: Freshwater flow to salinity relationship paleosalinity flow targets Paleosalinity estimate * circa ± 5.5 PSU Current observations 36.6 ± 7.8 PSU Result: variable flow yet monthly salinity at WB is never less than 30 PSU Relationship between salinity and flow isn t well defined Model reflects observed conditions in the semi-isolated central region of the bay * Paleo target data from USGS Open File Report (Marshall & Wingard, 2012)
Everglades National Park
 National Park Service U.S. Department of the Interior Climate Variability and the Coastal Physical Environment (Florida Bay) Presented by: Erik Stabenau - National Park Service Contributions from: Christina
9 th INTECOL Orlando, Florida June 7, 2012
 Restoration of the Everglades Saline Wetlands and Florida Bay: Responses Driven from Land and Sea David Rudnick 1, Colin Saunders 2, Carlos Coronado 2, Fred Sklar 2 Erik Stabenau 1, Vic Engel 1, Rene Price
Physical Processes: What have we learned about Florida Bay in the past five years, and how is that useful to CERP planning and SFER management?
 Physical Processes: What have we learned about Florida Bay in the past five years, and how is that useful to CERP planning and SFER management? Peter B. Ortner, UM/RSMAS/CIMAS Modeling Progress Statistical
Frank Marshall CLF. Lynn Wingard, USGS Patrick Pitts, USFWS. Evelyn Gaiser, FIU Ania Wachnicka, FIU
 Pre-drainage Everglades Hydrology and Florida Bay Salinity Based on Paleoecology and Statistical Models Florida Bay and Adjacent Marine Systems Science Conference 2008 Frank Marshall CLF Lynn Wingard,
Ecosystem History of Florida Bay and the Southern Estuaries Five Year Update. G. Lynn Wingard (USGS)
") Ecosystem History of Florida Bay and the Southern Estuaries Five Year Update G. Lynn Wingard (USGS) Progress since 2003 Florida Bay Science Conference Expansion of Ecosystem History Research into surrounding
Ecosystem History of Florida Bay and the Southern Estuaries Five Year Update G. Lynn Wingard (USGS) Progress since 2003 Florida Bay Science Conference Expansion of Ecosystem History Research into surrounding
Water Management and Hydrology of Northeast Shark River Slough from 1940 to 2015
 Water Management and Hydrology of Northeast Shark River Slough from 1940 to 2015 Greater Everglades Ecosystem Restoration Conference April 2015 Kevin Kotun, Hydrologist Physical Resources Branch South
Estuarine Response in Northeastern Florida Bay to Major Hurricanes in 2005
 Estuarine Response in Northeastern Florida Bay to Major s in 25 By Jeff Woods and Mark Zucker s and tropical storms are critical components of the south Florida hydrologic cycle. These storms cause dramatic
Mangrove Restoration and Migration in a Changing Climate: Climatic Drivers and Shifting Ecotones
 Mangrove Restoration and Migration in a Changing Climate: Climatic Drivers and Shifting Ecotones Michael J. Osland & Richard H. Day U.S. Geological Survey, National Wetlands Research Center U.S. Department
Climate Outlook through 2100 South Florida Ecological Services Office Vero Beach, FL September 9, 2014
 Climate Outlook through 2100 South Florida Ecological Services Office Vero Beach, FL September 9, 2014 Short Term Drought Map: Short-term (
Climate Outlook through 2100 South Florida Ecological Services Office Vero Beach, FL January 13, 2015
 Climate Outlook through 2100 South Florida Ecological Services Office Vero Beach, FL January 13, 2015 Short Term Drought Map: Short-term (
Connectivity Between the Mangrove Ecotone Region and Florida Bay: Current Understanding in Carbon and Nutrient Fluxes
 Connectivity Between the Mangrove Ecotone Region and Florida Bay: Current Understanding in Carbon and Nutrient Fluxes Victor H. Rivera-Monroy, Stephen E. Davis III, Robert R. Twilley, Daniel L. Childers,
Chiang Rai Province CC Threat overview AAS1109 Mekong ARCC
 Chiang Rai Province CC Threat overview AAS1109 Mekong ARCC This threat overview relies on projections of future climate change in the Mekong Basin for the period 2045-2069 compared to a baseline of 1980-2005.
Sea-Level Rise Impacts on South Florida
 Sea-Level Rise Impacts on South Florida Keren Prize Bolter, PhD Science Director, Coastal Risk Consulting. LLC 5/3/16 FAQ list What is happening? What impacts are we already seeing? Just how vulnerable
Hurricanes, Sea Level Rise, and South Florida s Challenging Future
 Hurricanes, Sea Level Rise, and South Florida s Challenging Future Brian McNoldy Senior Research Associate University of Miami Tropical Weather Expert Washington Post Scientific Advisor Coastal Risk Consulting
Long-Term Patterns of Coastal Response to Changing Land Use and Climate: Examples from the Atlantic and Gulf Coastal Plains
 Long-Term Patterns of Coastal Response to Changing Land Use and Climate: Examples from the Atlantic and Gulf Coastal Plains Debra Willard, Christopher Bernhardt, and Miriam Jones U.S. Geological Survey,
Sea Level Rise in Miami-Dade County Florida Implications for Management of Coastal Wetlands and the Everglades
 Sea Level Rise in Miami-Dade County Florida Implications for Management of Coastal Wetlands and the Everglades Peter W. Harlem Dr. John F. Meeder Florida International University Southeast Environmental
The Role of the Mangrove Ecotone Region in Regulating Nutrient Cycling and Wetland Productivity in South Florida
 The Role of the Mangrove Ecotone Region in Regulating Nutrient Cycling and Wetland Productivity in South Florida Victor H. Rivera-Monroy, Stephen E. Davis III, Robert R. Twilley, Daniel L. Childers, Marc
The Science of Sea Level Rise and the Impact of the Gulf Stream
 Old Dominion University ODU Digital Commons July 29, 2016: The Latest in Sea Level Rise Science Hampton Roads Sea Level Rise/Flooding Adaptation Forum 7-29-2016 The Science of Sea Level Rise and the Impact
Restored oyster reefs enhance estuarine ecosystem services by altering nearshore salinity
 Restored oyster reefs enhance estuarine ecosystem services by altering nearshore salinity Photo: UF/IFAS David Kaplan, Maitane Olabarrieta, Peter Frederick, and Arnoldo Valle-Levinson Globally: Most Threatened
The Global Scope of Climate. The Global Scope of Climate. Keys to Climate. Chapter 8
 The Global Scope of Climate Chapter 8 The Global Scope of Climate In its most general sense, climate is the average weather of a region, but except where conditions change very little during the course
1. Oceans. Example 2. oxygen.
 1. Oceans a) Basic facts: There are five oceans on earth, making up about 72% of the planet s surface and holding 97% of the hydrosphere. Oceans supply the planet with most of its oxygen, play a vital
Climate. Annual Temperature (Last 30 Years) January Temperature. July Temperature. Average Precipitation (Last 30 Years)
 January Temperature. July Temperature. Average Precipitation (Last 30 Years)") Climate Annual Temperature (Last 30 Years) Average Annual High Temp. (F)70, (C)21 Average Annual Low Temp. (F)43, (C)6 January Temperature Average January High Temp. (F)48, (C)9 Average January Low Temp.
Climate Annual Temperature (Last 30 Years) Average Annual High Temp. (F)70, (C)21 Average Annual Low Temp. (F)43, (C)6 January Temperature Average January High Temp. (F)48, (C)9 Average January Low Temp.
Thomas N. Lee, Nelson Melo, Elizabeth Johns, Chris Kelble, Ryan H. Smith, and Peter Ortner
 BULLETIN OF MARINE SCIENCE, 82(1): 83 105, 2008 On water renewal and salinity variability in the northeast subregion of Florida Bay Thomas N. Lee, Nelson Melo, Elizabeth Johns, Chris Kelble, Ryan H. Smith,
Semi-enclosed seas. Estuaries are only a particular type of semi-enclosed seas which are influenced by tides and rivers
 Semi-enclosed seas Estuaries are only a particular type of semi-enclosed seas which are influenced by tides and rivers Other semi-enclosed seas vary from each other, mostly by topography: Separated from
The World Ocean. Pacific Ocean 181 x 10 6 km 2. Indian Ocean 74 x 10 6 km 2. Atlantic Ocean 106 x 10 6 km 2
 The World Ocean The ocean and adjacent seas cover 70.8% of the surface of Earth, an area of 361,254,000 km 2 Pacific Ocean 181 x 10 6 km 2 Indian Ocean 74 x 10 6 km 2 Atlantic Ocean 106 x 10 6 km 2 Oceanic
Ocean Circulation. In partnership with Dr. Zafer Top
 Ocean Circulation In partnership with Dr. Zafer Top Samantha Hampton Honors Science December 15, 2014 Ocean Circulation is the large scale movement of waters in the ocean basins. Dr. Zafer Top studies
Table 1. August average temperatures and departures from normal ( F) for selected cities.
 for selected cities.") Climate Summary for Florida August 2016 Prepared by Lydia Stefanova and David Zierden Florida Climate Center, The Florida State University, Tallahassee, Florida Online at: http://climatecenter.fsu.edu/products-services/summaries
Climate Summary for Florida August 2016 Prepared by Lydia Stefanova and David Zierden Florida Climate Center, The Florida State University, Tallahassee, Florida Online at: http://climatecenter.fsu.edu/products-services/summaries
New Zealand Climate Update No 223, January 2018 Current climate December 2017
 New Zealand Climate Update No 223, January 2018 Current climate December 2017 December 2017 was characterised by higher than normal sea level pressure over New Zealand and the surrounding seas. This pressure
Drought Impacts in the Southern Great Plains. Mark Shafer University of Oklahoma Norman, OK
 Drought Impacts in the Southern Great Plains Mark Shafer University of Oklahoma Norman, OK Causes of Drought: Large-Scale, Stationary High Pressure Air rotates clockwise around high pressure steers storms
Adopt a Drifter Lesson Plan by Mary Cook, Middle School Science Teacher, Ahlf Jr. High School, Searcy, Arkansas
 Adopt a Drifter Lesson Plan by Mary Cook, Middle School Science Teacher, Ahlf Jr. High School, Searcy, Arkansas Do Ocean Surface Currents Influence Climate? Objectives Students will construct climographs
SEA LEVEL RISE IN THE 2017 COASTAL MASTER PLAN
 SEA LEVEL RISE IN THE 2017 COASTAL MASTER PLAN James W. Pahl, Ph.D. Coastal Resources Scientist, Senior Presentation to the Barataria-Terrebonne National Estuary Program Management Conference Meeting Nicholls
Rainfall Observations in the Loxahatchee River Watershed
 Rainfall Observations in the Loxahatchee River Watershed Richard C. Dent Loxahatchee River District September 1997 Introduction Rain is a common occurrence in south Florida, yet its presence or absence
UNIT 5: ECOLOGY Chapter 15: The Biosphere
 CORNELL NOTES Directions: You must create a minimum of 5 questions in this column per page (average). Use these to study your notes and prepare for tests and quizzes. Notes will be stamped after each assigned
Current Climate Science and Climate Scenarios for Florida
 Current Climate Science and Climate Scenarios for Florida Daniel Bader and Vivien Gornitz Water Utilities and Climate Change Workshop Palm Beach County Water Utilities/ Water Research Foundation June 10,
Nearshore Benthic Habitats Program
 Nearshore Benthic Habitats Program Travis Thyberg, Diego Lirman, Greg Deangelo, Joe Serafy, Sarah Bellmund, Ligia Collado, Joan Browder Rosenstiel School of Marine & Atmospheric Science University of Miami
NRC Workshop - Probabilistic Flood Hazard Assessment Jan 2013
 Regional Precipitation-Frequency Analysis And Extreme Storms Including PMP Current State of Understanding/Practice Mel Schaefer Ph.D. P.E. MGS Engineering Consultants, Inc. Olympia, WA NRC Workshop - Probabilistic
A System View of Water Level Processes in the Lower Columbia River
 A System View of Water Level Processes in the Lower Columbia River David Jay Department of Civil & Environmental Engineering Portland State University, Portland, OR Amy Borde and Heida Diefenderfer Pacific
Keys to Climate Climate Classification Low Latitude Climates Midlatitude Climates High Latitude Climates Highland Climates Our Changing Climate
 Climate Global Climates Keys to Climate Climate Classification Low Latitude Climates Midlatitude Climates High Latitude Climates Highland Climates Our Changing Climate Keys to Climate Climate the average
Name: Date: Hour: Comparing the Effects of El Nino & La Nina on the Midwest (E4.2c)
") Purpose: Comparing the Effects of El Nino & La Nina on the Midwest (E4.2c) To compare the effects of El Nino and La Nina on the Midwest United States. Background Knowledge: The El Nino-Southern Oscillation
Purpose: Comparing the Effects of El Nino & La Nina on the Midwest (E4.2c) To compare the effects of El Nino and La Nina on the Midwest United States. Background Knowledge: The El Nino-Southern Oscillation
What is happening to the Jamaican climate?
 What is happening to the Jamaican climate? Climate Change and Jamaica: Why worry? Climate Studies Group, Mona (CSGM) Department of Physics University of the West Indies, Mona Part 1 RAIN A FALL, BUT DUTTY
 Page 1 of 5 Home research global climate enso effects Research Effects of El Niño on world weather Precipitation Temperature Tropical Cyclones El Niño affects the weather in large parts of the world. The
Weather & Ocean Currents
 Weather & Ocean Currents Earth is heated unevenly Causes: Earth is round Earth is tilted on an axis Earth s orbit is eliptical Effects: Convection = vertical circular currents caused by temperature differences
Energy Systems, Structures and Processes Essential Standard: Analyze patterns of global climate change over time Learning Objective: Differentiate
 Energy Systems, Structures and Processes Essential Standard: Analyze patterns of global climate change over time Learning Objective: Differentiate between weather and climate Global Climate Focus Question
Meteorology. Chapter 15 Worksheet 1
 Chapter 15 Worksheet 1 Meteorology Name: Circle the letter that corresponds to the correct answer 1) The Tropic of Cancer and the Arctic Circle are examples of locations determined by: a) measuring systems.
3) What is the difference between latitude and longitude and what is their affect on local and world weather and climate?
 What is the difference between latitude and longitude and what is their affect on local and world weather and climate?") www.discoveryeducation.com 1) Describe the difference between climate and weather citing an example of each. Describe how water (ocean, lake, river) has a local effect on weather and climate and provide
www.discoveryeducation.com 1) Describe the difference between climate and weather citing an example of each. Describe how water (ocean, lake, river) has a local effect on weather and climate and provide
Rising Sea Levels: Time for Proactive Action in Florida and the Caribbean?
 Rising Sea Levels: Time for Proactive Action in Florida and the Caribbean? Dr. Alan Fyall and Dr. Thomas Wahl National Center for Integrated Coastal Research, University of Central Florida Dr. Roberta
RAINFALL AVERAGES AND SELECTED EXTREMES FOR CENTRAL AND SOUTH FLORIDA. Thomas K. MacVicar
 TECHNICAL PUBLICATION #83-2 March 1983 RAINFALL AVERAGES AND SELECTED EXTREMES FOR CENTRAL AND SOUTH FLORIDA by Thomas K. MacVicar "This public document was promulgated at an annual cost of $136.74, or
Salinity Gradients in the Mission-Aransas National Estuarine Research Reserve. Kimberly Bittler GIS and Water Resources Fall 2011
 Salinity Gradients in the Mission-Aransas National Estuarine Research Reserve Kimberly Bittler GIS and Water Resources Fall 2011 INTRODUCTION Freshwater inflow has a widely recognized influence on estuary
Module 3. Basic Ecological Principles
 Module 3. Basic Ecological Principles Ecosystem Components Abiotic Biotic Species & Habitat The Biomes of North America Communities Energy & Matter Cycles in Ecosystems Primary Productivity Simple Ecosystem
MIAMI-SOUTH FLORIDA National Weather Service Forecast Office
 MIAMI-SOUTH FLORIDA National Weather Service Forecast Office http://www.weather.gov/miami June 2015 South Florida Weather Summary Dry East, Wet West...Drought Remains SE Florida July 3, 2015: Depending
8.1.2 Climate Projections
 Chapter 8 Nauru 167 8.1 Climate Summary 8.1.1 Current Climate Over the past half century it is likely that there has been a warming air temperature trend at Nauru which is partly associated with warming
Name Date Class. growth rings of trees, fossilized pollen, and ocean. in the northern hemisphere.
 Lesson Outline LESSON 2 A. Long-Term Cycles 1. A(n) climate cycle takes much longer than a lifetime to complete. a. To learn about long-term climate cycles, scientists study natural records, such as growth
Properties of the Ocean NOAA Tech Refresh 20 Jan 2012 Kipp Shearman, OSU
 Properties of the Ocean NOAA Tech Refresh 20 Jan 2012 Kipp Shearman, OSU Kipp Shearman T ( C) May 05 10, 2006 Physical Oceanographer I am interested in all things coastal Lots of observations: big boats,
Appendix D. Model Setup, Calibration, and Validation
 . Model Setup, Calibration, and Validation Lower Grand River Watershed TMDL January 1 1. Model Selection and Setup The Loading Simulation Program in C++ (LSPC) was selected to address the modeling needs
Marine Ecoregions. Marine Ecoregions. Slide 1. Robert G. Bailey. USDA Forest Service Rocky Mountain Research Station
 Slide 1 Marine Ecoregions Robert G. Bailey Marine Ecoregions Robert G. Bailey USDA Forest Service Rocky Mountain Research Station rgbailey@fs.fed.us Draft of 7/20/2006 8:44 PM Abstract: Oceans occupy some
Chapter 3 East Timor (Timor-Leste)
") Chapter 3 East Timor (Timor-Leste) 49 3.1 Climate Summary 3.1.1 Current Climate Despite missing temperature records for Dili Airport, it is probable that over the past half century there has been a warming
Chapter 3 East Timor (Timor-Leste) 49 3.1 Climate Summary 3.1.1 Current Climate Despite missing temperature records for Dili Airport, it is probable that over the past half century there has been a warming
Climate Change Impacts, Adaptation and Vulnerability: Small Islands - South West Pacific
 Climate Change Impacts, Adaptation and Vulnerability: Small Islands - South West Pacific Penehuro F. Lefale Lead Author (LA), Chapter 16 Manager, International Cooperation & Development NZ Meteorological
Investigation of Rainfall Trend in Jorhat Town, Assam, India
 EUROPEAN ACADEMIC RESEARCH Vol. II, Issue 7/ October 2014 ISSN 2286-4822 www.euacademic.org Impact Factor: 3.1 (UIF) DRJI Value: 5.9 (B+) Investigation of Rainfall Trend in Jorhat Town, MAYURAKSHI BHUYAN
A process-based approach toward assessing the coastal impact of projected sea level rise and severe storms
 A process-based approach toward assessing the coastal impact of projected sea level rise and severe storms Patrick Barnard 1, Cheryl Hapke 2, Li Erikson 1, Amy Foxgrover 1, and Maarten van Ormondt 3 1
Great Lakes Update. Background
 Great Lakes Update Background The U.S. Army Corps of Engineers, Detroit District, monitors and forecasts the water levels of the Great Lakes. This report summarizes the hydrologic conditions of the Great
Warm Up Vocabulary Check
 Warm Up Vocabulary Check Surface current Coriolis Effect global winds upwelling Gulf Stream deep current climate El Nino convection current continental deflection 1.The apparent curving of the path of
NOAA National Centers for Environmental Information State Summaries 149-FL. Observed and Projected Temperature Change
 19-FL FLORIDA Key Messages Under a higher emissions pathway, historically unprecedented warming is projected by the end of the 1st century. Rising temperatures will likely increase the intensity of naturally-occurring
Tropical Moist Rainforest
 Tropical or Lowlatitude Climates: Controlled by equatorial tropical air masses Tropical Moist Rainforest Rainfall is heavy in all months - more than 250 cm. (100 in.). Common temperatures of 27 C (80 F)
Climate Risk Profile for Samoa
 Climate Risk Profile for Samoa Report Prepared by Wairarapa J. Young Samoa Meteorology Division March, 27 Summary The likelihood (i.e. probability) components of climate-related risks in Samoa are evaluated
sea levels 100 year/ payments. FIGURE 1
 MIAMI DADE COUNTY CLIMATE INDICATORS RAINFALL SUMMARY Much of Miami Dade County is susceptible to localized flooding, particularly during the rainy season of June through October. The County s flat terrain
Overview of a Changing Climate in Rhode Island
 Overview of a Changing Climate in Rhode Island David Vallee, Hydrologist in Charge, National Weather Service Northeast River Forecast Center, NOAA Lenny Giuliano, Air Quality Specialist, Rhode Island Department
Percentage of normal rainfall for August 2017 Departure from average air temperature for August 2017
 New Zealand Climate Update No 219, August 2017 Current climate August 2017 Overall, mean sea level pressure was lower than normal over and to the west of New Zealand during August while higher than normal
Analysis of Tides and Storm Surge from Observational Records in the Delaware Inland Bays
 Analysis of Tides and Storm Surge from Observational Records in the Delaware Inland Bays John Callahan Delaware Geological Survey Coastal GeoTools Conference March 30 April 2, 2015 Charleston, SC Outline
NOAA/OAR Observing Systems
 NOAA/OAR Observing Systems Dr. Christopher L. Sabine Director NOAA s Pacific Marine Environmental Laboratory Workshop on Hydroclimate Monitoring Systems and Measurement Needs June, 2014 Global Ocean Observing
Great Lakes Update. Volume 194: 2015 Annual Summary
 Great Lakes Update Volume 194: 2015 Annual Summary Background The U.S. Army Corps of Engineers (USACE) tracks and forecasts the water levels of each of the Great Lakes. This report summarizes the hydrologic
Current and future climate of the Cook Islands. Pacific-Australia Climate Change Science and Adaptation Planning Program
 Pacific-Australia Climate Change Science and Adaptation Planning Program Penrhyn Pukapuka Nassau Suwarrow Rakahanga Manihiki N o r t h e r n C o o k I s l a nds S o u t h e Palmerston r n C o o k I s l
Draft for Discussion 11/11/2016
 Coastal Risk Consulting (CRC) Climate Vulnerability Assessment for Village of Key Biscayne Deliverable 1.1 in Statement of Work. Preliminary Vulnerability Assessment Identifying Flood Hotspots Introduction...
Modeling Salinity Distribution in Apalachicola Bay, Florida
 Modeling Salinity Distribution in Apalachicola Bay, Florida Factors Affecting Salinity Distribution in Apalachicola Bay: Freshwater Inflow Apalachicola River Lake Lanier Precipitation Wind Hurricane Climate
Weather briefing Strong Coastal Nor easter November 7 th -8 th, 2012
 Weather briefing Strong Coastal Nor easter November 7 th -8 th, 2012 Prepared 1245 PM EDT Tuesday November 6, 2012 Gary Szatkowski NOAA s NJ Forecast Office Weather.gov/phi Purpose of Briefing Briefing
Residents Emergency Response Checklist
 COMMUNITY RESILIENCE PLAN Residents Emergency Response Checklist A helpful guide in the event of extreme weather or bushfire events. < PREVIOUS I NEXT > 02 Purchasing an existing property or building a
Analysis of the USGS Coastal Gradient Real-time Gaging Network
 Analysis of the USGS Coastal Gradient Real-time Gaging Network Paul Conrads, USGS, SC Water Science Center Kenneth Odom, USGS, CO Water Science Center Greater Everglades Ecosystem Restoration Conference
New Zealand Climate Update No 226, April 2018 Current climate March 2018
 New Zealand Climate Update No 226, April 2018 Current climate March 2018 March 2018 was characterised by significantly higher pressure than normal to the east of New Zealand. This pressure pattern, in
Visualizing Upper Trophic and Ecosystem Modeling Outputs with EverVIEW to Inform the Decision Process in Coastal Louisiana.
 Visualizing Upper Trophic and Ecosystem Modeling Outputs with EverVIEW to Inform the Decision Process in Coastal Louisiana 2012 Master Plan Craig Conzelmann Carol Parsons Richards Kevin Suir COMPREHENSIVE
Hurricane Wilma Post Storm Data Acquisition Estimated Peak Wind Analysis and Storm Tide Data. December 27, 2005
 Hurricane Wilma Post Storm Data Acquisition Estimated Peak Wind Analysis and Storm Tide Data December 27, 2005 Hurricane Wilma was the sixth major hurricane of the record-breaking 2005 Atlantic hurricane
NWS HURRICANES June 3, 2015
 NWS HURRICANES June 3, 2015 Hurricane Season June 1 November 30 2 What s the concern? All tropical systems passing within 125nm of central Maryland since 1950 Mid-Atlantic Hurricanes Greatest Risk: August
Earth Science Lesson Plan Quarter 2, Week 6, Day 1
 Earth Science Lesson Plan Quarter 2, Week 6, Day 1 1 Outcomes for Today Standard Focus: Earth Sciences 5.f students know the interaction of wind patterns, ocean currents, and mountain ranges results in
The oceans: Sea level rise & gulf stream
 Lecture Climate Change Lesson 10 The oceans: Sea level rise & gulf stream Rene Orth rene.orth@bgc-jena.mpg.de 1 Course webpage https://www.bgc-jena.mpg.de/bgi/index.php/lectures/hydrobioclimclimatechange
Alaska Ocean Observing System 101 Anchorage, Alaska
 Alaska Ocean Observing System 101 Anchorage, Alaska Molly McCammon, Director Alaska Ocean Observing System (AOOS) A Regional Observing System within the Integrated Ocean Observing System www.aoos.org IOOS
Current and future climate of Vanuatu. Pacific-Australia Climate Change Science and Adaptation Planning Program
 Pacific-Australia Climate Change Science and Adaptation Planning Program Hiu Torres Islands Vanua Lava Gaua Banks Islands Espiritu Santo Malekula Ambae Épi Maéwo Pentecost Ambrym Shepherd Islands Éfate
Seasonal Climate Watch January to May 2016
 Seasonal Climate Watch January to May 2016 Date: Dec 17, 2015 1. Advisory Most models are showing the continuation of a strong El-Niño episode towards the latesummer season with the expectation to start
NOAA s National Ocean Service. Center for Operational Oceanographic Products and Services
 NOAA s National Ocean Service Center for Operational Oceanographic Products and Services Richard Edwing, CO-OPS Acting Director January 27, 2010 Outline CO-OPS Overview Programs Observing Systems PORTS
Flow estimations through spillways under submerged tidal conditions
 Computational Methods and Experimental Measurements XIII 137 Flow estimations through spillways under submerged tidal conditions P. D. Scarlatos 1, M. Ansar 2 & Z. Chen 2 1 Department of Civil Engineering
L.O Students will learn about factors that influences the environment
 Name L.O Students will learn about factors that influences the environment Date 1. At the present time, glaciers occur mostly in areas of A) high latitude or high altitude B) low latitude or low altitude
Talk Overview. Concepts. Climatology. Monitoring. Applications
 Atmospheric Rivers Talk Overview Concepts Climatology Monitoring Applications Satellite View Where is the storm? Where is the impact? Atmospheric Rivers Plume or fire hose of tropical moisture Heavy precipitation
Stream Discharge and the Water Budget
 Regents Earth Science Unit 6: Water Cycle & Climate Name: Lab # Stream Discharge and the Water Budget Introduction: The United States Geological Survey (USGS) measures and publishes values for the daily
David R. Vallee Hydrologist-in-Charge NOAA/NWS Northeast River Forecast Center
 David R. Vallee Hydrologist-in-Charge NOAA/NWS Northeast River Forecast Center Record flooding along the Shawsheen River during the 2006 Mother s Day Floods Calibrate and implement a variety of hydrologic
Effect of El Niño Southern Oscillation (ENSO) on the number of leaching rain events in Florida and implications on nutrient management
 on the number of leaching rain events in Florida and implications on nutrient management") Effect of El Niño Southern Oscillation (ENSO) on the number of leaching rain events in Florida and implications on nutrient management C. Fraisse 1, Z. Hu 1, E. H. Simonne 2 May 21, 2008 Apopka, Florida
Effect of El Niño Southern Oscillation (ENSO) on the number of leaching rain events in Florida and implications on nutrient management C. Fraisse 1, Z. Hu 1, E. H. Simonne 2 May 21, 2008 Apopka, Florida
Potential Impact of climate change and variability on the Intra-Americas Sea (IAS)
") Potential Impact of climate change and variability on the Intra-Americas Sea (IAS) Sang-Ki Lee 1, Yanyun Liu 1 and Barbara Muhling 2 1 CIMAS-University of Miami and AOML-NOAA 2 Princeton University and
Potential Impact of climate change and variability on the Intra-Americas Sea (IAS) Sang-Ki Lee 1, Yanyun Liu 1 and Barbara Muhling 2 1 CIMAS-University of Miami and AOML-NOAA 2 Princeton University and
MAURITIUS METEOROLOGICAL SERVICES
 MAURITIUS METEOROLOGICAL SERVICES CLIMATE NOVEMBER 2018 Introduction Climatologically speaking, November is a relatively dry month for Mauritius with a long term monthly mean rainfall of 78 mm. However,
Ellen L. Mecray NOAA Regional Climate Services Director, Eastern Region Taunton, MA
 Ellen L. Mecray NOAA Regional Climate Services Director, Eastern Region Taunton, MA Regions of the US National Climate Assessment What we Observe: Climate changes and impacts Increasing temperature Increasingly
Winds and Global Circulation
 Winds and Global Circulation Atmospheric Pressure Winds Global Wind and Pressure Patterns Oceans and Ocean Currents El Nino How is Energy Transported to its escape zones? Both atmospheric and ocean transport
Jill Key. Chapter 6 Kiribati
 Jill Key Chapter 6 Kiribati 113 6.1 Climate Summary 6.1.1 Current Climate Warming trends are evident in both annual and half-year mean air temperatures at Tarawa from 1950. At Kiritmati, in eastern Kiribati,
Tropical Weather Briefing
 Tropical Weather Briefing August 28, 2012 700 AM CDT National Weather Service Weather Forecast Office Slidell, LA Current Satellite Tropical Storm Isaac Watches/Warnings Tropical Storm Isaac Track Guidance
Hurricane Matthew Threats and Impacts Briefing for Eastern NC
 Hurricane Matthew Threats and Impacts Briefing for Eastern NC October 6 th, 2016 Date/Time Created: 10/6/2016, Noon EDT National Weather Service Newport/Morehead City, NC Hurricane Matthew Key Points Changes
REDWOOD VALLEY SUBAREA
 Independent Science Review Panel Conceptual Model of Watershed Hydrology, Surface Water and Groundwater Interactions and Stream Ecology for the Russian River Watershed Appendices A-1 APPENDIX A A-2 REDWOOD