Nearshore Benthic Habitats Program
|
|
|
- Violet Richardson
- 5 years ago
- Views:
Transcription


1 Nearshore Benthic Habitats Program Travis Thyberg, Diego Lirman, Greg Deangelo, Joe Serafy, Sarah Bellmund, Ligia Collado, Joan Browder Rosenstiel School of Marine & Atmospheric Science University of Miami NOAA / National Geodetic Survey NOAA / National Marine Fisheries Service Biscayne National Park Florida International University


2 What? Where? When? SAV abundance, diversity, distribution Matheson Hammock to Manatee Bay, < 1000 m from shore Dry Season, Wet Season How Long? 2003, 2005, 2008, 2009, 2010-?? Why? How? Nearshore Habitats and SAV are Restoration Targets Photographic and Visual Surveys, Tissue Collections
 Critical nursery habitats Their location makes them susceptible to changes in")
3 Why monitor nearshore benthic habitats?? These habitats have been under-represented in monitoring efforts due to limited boat access ( < 1m in depth ) Critical nursery habitats Their location makes them susceptible to changes in freshwater deliveries These habitats are explicit CERP Restoration Targets CERP SAV Restoration Goals for Southern Biscayne Bay: 1) increase cover of seagrass, primarily Halodule and Ruppia, in nearshore areas; 2) Reduce dominance of Thalassia 3) increase the abundance and diversity of fish and macroinvertebrates associated with SAV.
4 Nearshore Benthic Habitats Program: Core Components 1. GeoSpatial SAV surveys (Shallow Water Positioning System, SWaPS) Large-scale (Matheson Hammock Manatee Bay) Seasonal Surveys (Dry Season, Wet Season) Stratified Random Site Selection (5 buffers, 4 zones) Inshore-Offshore Continuous Transects Products: Spatially and seasonally resolved patterns of SAV abundance, distribution, and diversity Geo-tagged High-resolution digital images of the benthos WQ parameters at each survey site (WQ-SAV correlations) SWaPS website:
5 Nearshore Benthic Habitats Program: Value Added Components Projects: a) High Frequency SAV surveys (focus on Macroalgae) Bi-monthly surveys and tissue collections (Black Point, Deering Estate) b) SAV surveys at BISC s WQ permanent sites c) SAV surveys at Browder (epibenthic) and Serafy (mangrove fish) sites d) Remote Sensing of SAV communities
 Seagrass abundance, diversity, distribution, morphometrics Landscape Structure and connectivity, Weeks Months Years Years")
6 CHANGE INDICATORS Macroalgal abundance, diversity, distribution, morphometrics Epiphyte Community (encrusting, filamentous, bacterial) Seagrass abundance, diversity, distribution, morphometrics Landscape Structure and connectivity, Weeks Months Years Years - Decades
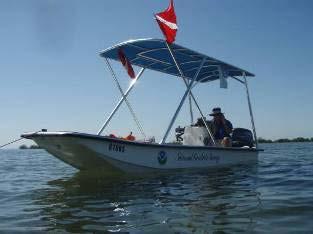
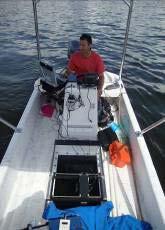
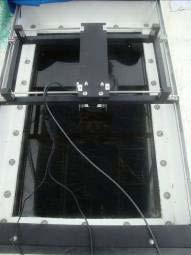
7 Survey Methodology : SWaPS
 Black Pt Turkey Pt Manatee Bay Card Sound Barnes")
8 Matheson Survey Area / Design 4 survey regions (salinity, hydrodynamics) 5 cross-shelf buffers (100 m) Black Pt Turkey Pt Manatee Bay Card Sound Barnes Sound
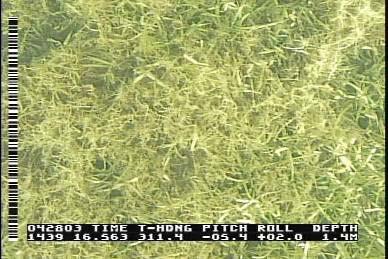
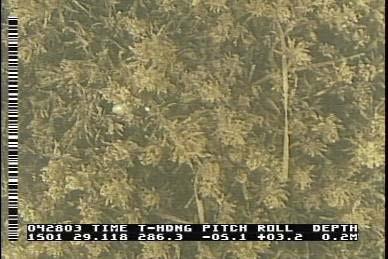
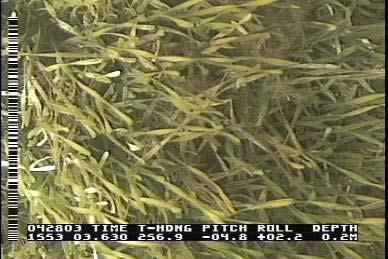
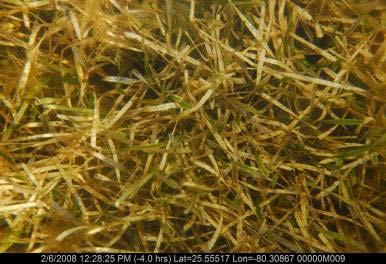
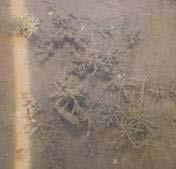
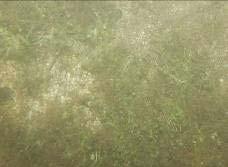
9 Geo-tagged Images Scored to assess percent cover of SAV
10 SAV Cover Mean % Cover Macroalgae Thalassia Halodule Syringodium 0 Dry 2003 Dry 2005 Wet 2005 Dry 2008 Wet 2008 Dry 2009 Wet 2009 Dry 2010 Decline in Tt Stability of Hw, Sf MA highly dynamic (good indicator)


11 SEAGRASS DISTRIBUTION. CANAL INFLUENCES % cover % cover Max Max Min Min Seagrass distribution related to freshwater discharges
12 Seagrass-Salinity Relationships 1.00 Probability of Occurrence (p) Mean Salinity (psu) Thalassia Halodule Syringodium Seagrasses are good indicators of salinity changes at annual scales
13 CHANGE INDICATORS Macroalgal abundance, diversity, distribution, morphometrics Epiphyte Community (encrusting, filamentous, bacterial) Seagrass abundance, diversity, distribution, morphometrics Landscape Structure and connectivity, Weeks Months Years Years - Decades
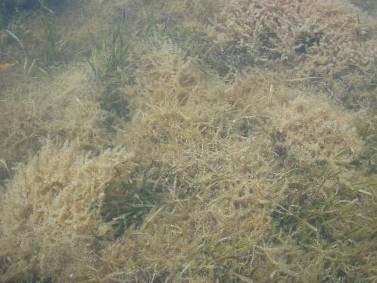
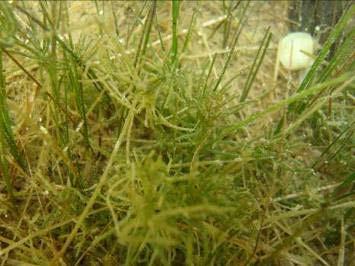
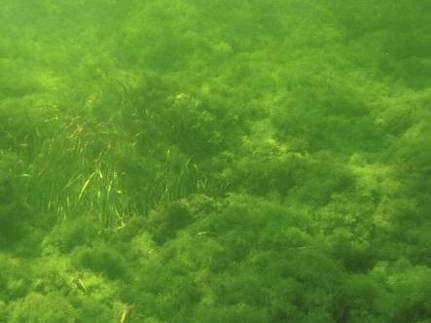
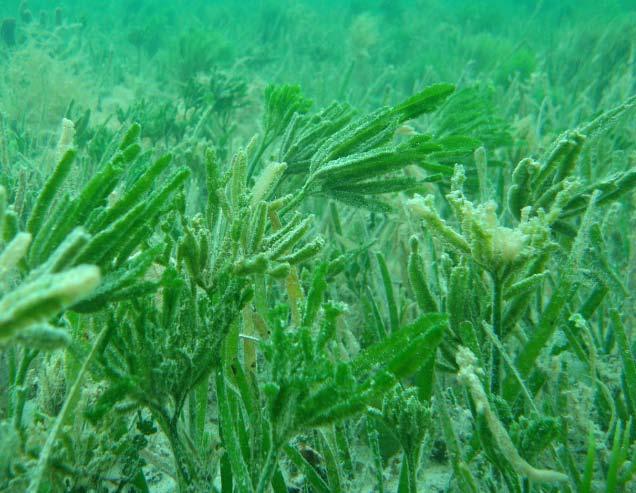
14 Macroalgae are key components of SAV communities

15 Salinity Patterns in Black Point Salinity (psu) 35 N of Jetty S of Jetty Distinct Salinity Patterns on different sides of the Jetty Mar Apr May Jun Jul Aug Sep Oct Nov Dec Lower salinity S of the jetty

16 Macroalgae of Black Point Distinct Macroalgal Communities on different sides of the Jetty 20 Similarity Estuarine Group: Chara, Acetabularia, Batophora Transitional Group: Laurencia, Penicillus, Palisada Marine Group: Anadyomene, Halimeda Macroalgae are a good, dynamic indicator of salinity patterns!
17 CHANGE INDICATORS Macroalgal abundance, diversity, distribution, morphometrics Epiphyte Community (encrusting, filamentous, bacterial) Seagrass abundance, diversity, distribution, morphometrics Landscape Structure and connectivity, Weeks Months Years Years - Decades
 in relation to WQ patterns Aerial Image")
18 Landscape SAV Indicators of Salinity Patterns Goal: Explore patterns of habitat structure (patchiness, fragmentation) in relation to WQ patterns Aerial Image Classified Image


19 Seagrass landscapes can be divided into fragmented and continuous SAV habitats Fragmented SAV habitats have higher density of small SAV patches and more complex shapes than continuous SAV habitats

20 Fragmented SAV landscapes are found in areas influenced by freshwater deliveries Continuous SAV landscapes are found in areas with high and constant salinity, removed from freshwater canals Pulsed release of freshwater creates landscapelevel fragmentation of SAV habitats!!! Fragmented habitats have been shown to be more prone to mortality and may have lower habitat value for associated species.
21 Nearshore Benthic Habitats Program: Summary SAV (seagrasses and macroalgae) components are good indicators of salinity patterns (e.g., distribution presently influenced by salinity regime) Seagrasses are the principal component of the nearshore SAV community during the Dry season (mean cover = 25.5 %), while macroalgae dominate during the Wet season (33.4 %). The distribution and abundance of SAV are directly related to the tolerance of each taxon to salinity patterns. Need a nested suite of indicators that work at different spatial and temporal scales Provide direct input into modeling efforts Need to establish a long-term baseline comparable to that of other components

22 ACNOWLEDGEMENTS Funding National Geodetic Survey DOI NPS CESI Program NOAA NMFS CERP RECOVER Program US ACoE NGS Gerry Mader NOAA Erick Buck Tom Jackson NPS Richard Curry Lirman Lab James Herlan Britt Huntington Steph Schopmeyer Caitlin Hill Ford Drury
Nearshore Pink Shrimp Densities and Habitat Limitations in Biscayne Bay: A Saptiotemporal Analysis of 10 Years of Data
 Nearshore Pink Shrimp Densities and Habitat Limitations in Biscayne Bay: A Saptiotemporal Analysis of 10 Years of Data Ian C. Zink 1,2, Joan A. Browder 2, Diego Lirman 1, Joseph E. Serafy 1,2 GEER 2017
LINKING EVERGLADES RESTORATION EFFECTS TO FISHERIES HABITAT: INFLUENCE OF SAV SEASCAPE STRUCTURE AND FISH PREDATION RISK IN BISCAYNE BAY
 LINKING EVERGLADES RESTORATION EFFECTS TO FISHERIES HABITAT: INFLUENCE OF SAV SEASCAPE STRUCTURE AND FISH PREDATION RISK IN BISCAYNE BAY Rolando O. Santos*, Diego Lirman, James McCullars, Dominick Dusseau
Salinity Sampling in Biscayne Bay ( )
") Annual Report Salinity Sampling in Biscayne Bay (2009-2010) Biscayne National Park A Report to the United States Army Corps of Engineers for the Monitoring and Assessment Plan of the Comprehensive Everglades
Annual Report Salinity Sampling in Biscayne Bay (2009-2010) Biscayne National Park A Report to the United States Army Corps of Engineers for the Monitoring and Assessment Plan of the Comprehensive Everglades
Everglades National Park
 National Park Service U.S. Department of the Interior Climate Variability and the Coastal Physical Environment (Florida Bay) Presented by: Erik Stabenau - National Park Service Contributions from: Christina
MAINTENANCE DREDGE BENTHIC ASSESSMENT SUNSET POINT FARM LLC LONG POINT KEY MONROE COUNTY, FLORIDA. Prepared by:
 MAINTENANCE DREDGE BENTHIC ASSESSMENT SUNSET POINT FARM LLC LONG POINT KEY MONROE COUNTY, FLORIDA Prepared by: December 11, 2016 INTRODUCTION The owners of the Sunset Point Farms LLC, located on the northern
Habitat Suitability for Forage Fishes in Chesapeake Bay
 Habitat Suitability for Forage Fishes in Chesapeake Bay Aug 2017 Jul 2019 Mary C Fabrizio Troy D Tuckey Aaron J Bever Michael L MacWilliams 21 June 2018 Photo: Chesapeake Bay Program Motivation Production
Everglades National Park
 National Park Service U.S. Department of the Interior Water Budget, Climate Variability, and Predicting Salinity for Eastern Florida Bay Erik Stabenau and Kevin Kotun National Park Service Erik_Stabenau@nps.gov
GAMINGRE 8/1/ of 7
 FYE 09/30/92 JULY 92 0.00 254,550.00 0.00 0 0 0 0 0 0 0 0 0 254,550.00 0.00 0.00 0.00 0.00 254,550.00 AUG 10,616,710.31 5,299.95 845,656.83 84,565.68 61,084.86 23,480.82 339,734.73 135,893.89 67,946.95
Investigating the contribution of allochthonous subsidies to kelp forests in central California
 Investigating the contribution of allochthonous subsidies to kelp forests in central California melissa m foley UCSC Institute of Marine Science and Center for Ocean Solutions system connectivity rivers
Physical Processes: What have we learned about Florida Bay in the past five years, and how is that useful to CERP planning and SFER management?
 Physical Processes: What have we learned about Florida Bay in the past five years, and how is that useful to CERP planning and SFER management? Peter B. Ortner, UM/RSMAS/CIMAS Modeling Progress Statistical
Ecosystem History of Florida Bay and the Southern Estuaries Five Year Update. G. Lynn Wingard (USGS)
") Ecosystem History of Florida Bay and the Southern Estuaries Five Year Update G. Lynn Wingard (USGS) Progress since 2003 Florida Bay Science Conference Expansion of Ecosystem History Research into surrounding
Ecosystem History of Florida Bay and the Southern Estuaries Five Year Update G. Lynn Wingard (USGS) Progress since 2003 Florida Bay Science Conference Expansion of Ecosystem History Research into surrounding
Restored oyster reefs enhance estuarine ecosystem services by altering nearshore salinity
 Restored oyster reefs enhance estuarine ecosystem services by altering nearshore salinity Photo: UF/IFAS David Kaplan, Maitane Olabarrieta, Peter Frederick, and Arnoldo Valle-Levinson Globally: Most Threatened
Long term change in the abundances of northern Gulf of Mexico scyphomedusae Chrysaora sp. and Aurelia spp. with links to climate variability
 Long term change in the abundances of northern Gulf of Mexico scyphomedusae Chrysaora sp. and Aurelia spp. with links to climate variability Kelly L. Robinson William M. Graham U. Southern Mississippi
Spatial variation in the abundance of eelgrass (Zostera marina) at eight sites in western Newfoundland, Canada 5/5/2015 V2.0
 at eight sites in western Newfoundland, Canada 5/5/2015 V2.0") Spatial variation in the abundance of eelgrass (Zostera marina) at eight sites in western Newfoundland, Canada 5/5/2015 V2.0 1 Summary The abundance of eelgrass (Zostera marina) was quantified at eight
Spatial variation in the abundance of eelgrass (Zostera marina) at eight sites in western Newfoundland, Canada 5/5/2015 V2.0 1 Summary The abundance of eelgrass (Zostera marina) was quantified at eight
Seagrass and algal abundance in the Whitsundays region. Status Report
 Seagrass and algal abundance in the Whitsundays region. Status Report March 21 Stuart J. Campbell Len J. McKenzie Marine Plant Ecology Group Northern Fisheries Centre Department of Primary Industries,
IV. Distribution and Abundance of Acropora Corals
 IV. Distribution and Abundance of Acropora Corals Background The declines in abundance of two of the principal Caribbean reef-building corals, staghorn coral (Acropora cervicornis) and elkhorn coral (A.
Long-term Water Quality Monitoring in Estero Bay
 Long-term Water Quality Monitoring in Estero Bay Keith Kibbey Laboratory Director Lee County Environmental Laboratory Division of Natural Resource Management Estero Bay Monitoring Programs Three significant
PROGRESS ACCOMPLISHED THIS PERIOD
 Semi-Annual Report Period Covered: September 1, 21 through February 28, 217 Prepared By: Richard Radigan Title: Monitoring of a Constructed Oyster Reef in the St. Lucie Estuary Agency: Florida Fish & Wildlife
Introduction: The Gulf of Mexico Alliance. The Gulf GAME project MERMAid and PHINS Results & Conclusions What s next? Examples
 AAG Las Vegas March 25, 2009 Introduction: Ocean governance and Ecosystem-Based Management The Gulf of Mexico Alliance Habitat Identification and Characterization The Gulf GAME project MERMAid and PHINS
FLORIDA BAY SCALLOP 2015 ANNUAL REPORT
 FLORIDA BAY SCALLOP 2015 ANNUAL REPORT Florida Fish and Wildlife Conservation Commission Fish and Wildlife Research Institute 100 Eighth Avenue SE St. Petersburg, Florida 33701-5095 2015 Molluscan Fisheries
Estuarine Response in Northeastern Florida Bay to Major Hurricanes in 2005
 Estuarine Response in Northeastern Florida Bay to Major s in 25 By Jeff Woods and Mark Zucker s and tropical storms are critical components of the south Florida hydrologic cycle. These storms cause dramatic
Identifying risks of geoduck aquaculture: the role of larval transport
 Material intended for presentation only. Please do not cite, copy or distribute Bivalve life cycle: a simplified view however: High fecundities (female geoduck 50 million eggs/year) High larval mortalities
III. Distribution and Abundance of Acropora Corals
 III. Distribution and Abundance of Acropora Corals Background The declines in abundance of two of the principal Caribbean reef-building corals, staghorn coral (Acropora cervicornis) and elkhorn coral (A.
Population Dynamics of Seagrass Communities in Biscayne Bay, Florida: Exploring the Influence of Salinity on Seascape Fragmentation
 University of Miami Scholarly Repository Open Access Theses Electronic Theses and Dissertations 2018-12-05 Population Dynamics of Seagrass Communities in Biscayne Bay, Florida: Exploring the Influence
Drought in Southeast Colorado
 Drought in Southeast Colorado Nolan Doesken and Roger Pielke, Sr. Colorado Climate Center Prepared by Tara Green and Odie Bliss http://climate.atmos.colostate.edu 1 Historical Perspective on Drought Tourism
Persistence of prey hot spots in southeast Alaska
 Persistence of prey hot spots in southeast Alaska Scott M. Gende National Park Service, Glacier Bay Field Station, 3100 National Park, Juneau, Alaska, USA; Scott_Gende Gende@nps.gov Michael Sigler National
Setting Priorities for Eelgrass Conservation and Restoration. Robert Buchsbaum Massachusetts Audubon Society
 Setting Priorities for Eelgrass Conservation and Restoration Robert Buchsbaum Massachusetts Audubon Society Eelgrass habitat values A rich, productive habitat for many marine organisms Nursery habitat
over the Northern West Florida Shelf from SeaWinds and ASCAT
 Interannual Variability of Synoptic Scale Winds over the Northern West Florida Shelf from SeaWinds and ASCAT Steve Morey Mark Bourassa Austin Todd COAPS/FSU This work is sponsored by the NASA Ocean Vector
Frank Marshall CLF. Lynn Wingard, USGS Patrick Pitts, USFWS. Evelyn Gaiser, FIU Ania Wachnicka, FIU
 Pre-drainage Everglades Hydrology and Florida Bay Salinity Based on Paleoecology and Statistical Models Florida Bay and Adjacent Marine Systems Science Conference 2008 Frank Marshall CLF Lynn Wingard,
SEAGRASS COVERAGE TRENDS IN THE INDIAN RIVER LAGOON SYSTEM
 Biological Sciences SEAGRASS COVERAGE TRENDS IN THE INDIAN RIVER LAGOON SYSTEM R. W. VIRNSTEIN *,J.S.STEWARD, AND L. J. MORRIS St. Johns River Water Management District, Palatka, FL 32178 ABSTRACT: We
Spatial Dynamics of Vegetated Seascapes and the Influence on Fish and Crustaceans
 University of Miami Scholarly Repository Open Access Dissertations Electronic Theses and Dissertations 2014-12-12 Spatial Dynamics of Vegetated Seascapes and the Influence on Fish and Crustaceans Rolando
Edwin A. Hernández-Delgado*
 Long-term Coral Reef Ecological Change Monitoring Program of the Luis Peña Channel Marine Fishery Reserve, Culebra Island, Puerto Rico: I. Status of the coral reef epibenthic communities (1997-2002). Edwin
Enhancing and Combining Complex Numerical Models of Coastal Southern Florida
 Enhancing and Combining Complex Numerical Models of Coastal Southern Florida Eric Swain, Melinda Lohmann, and Jeremy Decker U.S. Geological Survey Florida Bay and Adjacent Marine Systems Science Conference,
3.0 TECHNICAL FEASIBILITY
 3.0 TECHNICAL FEASIBILITY 3.1 INTRODUCTION To enable seasonal storage and release of water from Lake Wenatchee, an impoundment structure would need to be constructed on the lake outlet channel. The structure
SARSIM Model Output for the Distribution of Sardine in Canadian, US and Mexican Waters. Richard Parrish October 13, 2015
 SARSIM Model Output for the Distribution of Sardine in Canadian, US and Mexican Waters. Richard Parrish October 13, 2015 Agenda Item H.1.c The information presented below was taken from a model that I
WIND EFFECTS ON CHEMICAL SPILL IN ST ANDREW BAY SYSTEM
 WIND EFFECTS ON CHEMICAL SPILL IN ST ANDREW BAY SYSTEM PETER C. CHU, PATRICE PAULY Naval Postgraduate School, Monterey, CA93943 STEVEN D. HAEGER Naval Oceanographic Office, Stennis Space Center MATHEW
Chiang Rai Province CC Threat overview AAS1109 Mekong ARCC
 Chiang Rai Province CC Threat overview AAS1109 Mekong ARCC This threat overview relies on projections of future climate change in the Mekong Basin for the period 2045-2069 compared to a baseline of 1980-2005.
Changes in spatial distribution of chub mackerel under climate change: the case study using Japanese purse seine fisheries data in the East China Sea
 Changes in spatial distribution of chub mackerel under climate change: the case study using Japanese purse seine fisheries data in the East China Sea Tohya Yasuda, Ryuji Yukami, Seiji Ohshimo Seikai National
The Refugia Concept: Using Watershed Analysis to Prioritize Salmonid Habitat for Conservation and Restoration
 The Refugia Concept: Using Watershed Analysis to Prioritize Salmonid Habitat for Conservation and Restoration Christopher May Battelle & UW Cumulative Impacts of Urbanization Landscape Alterations Loss
Restoration Goals TFG Meeting. Agenda
 San Joaquin River Restoration Program Restoration Goals TFG Meeting Reach 2B Update April 28, 2010 Agenda 1. Introductions 2. Program Restoration Goal Context 3. Program Update a) Interim Flows b) EIS/EIR
Weather and Climate of the Rogue Valley By Gregory V. Jones, Ph.D., Southern Oregon University
 Weather and Climate of the Rogue Valley By Gregory V. Jones, Ph.D., Southern Oregon University The Rogue Valley region is one of many intermountain valley areas along the west coast of the United States.
PROJECT DOCUMENT ACHIEVEMENTS FOR YEAR 2018 AND PROPOSED ACTIVITY FOR YEAR 2019
 Forty-first Meeting of the Program Committee Southeast Asian Fisheries Development Center Bayview Hotel, Langkawi, Malaysia 5-7 November 2018 WP03.1.1.15 PROJECT DOCUMENT ACHIEVEMENTS FOR YEAR 2018 AND
Satellite-derived environmental drivers for top predator hotspots
 Satellite-derived environmental drivers for top predator hotspots Peter Miller @PeterM654 South West Marine Ecosystems 2017 21 Apr. 2017, Plymouth University Satellite environmental drivers for hotspots
Coastal and Marine Ecological Classification Standard (CMECS)
") Coastal and Marine Ecological Classification Standard (CMECS) Kathy Goodin, NatureServe EMECS, August 2011 Baltimore, MD 1 Outline Objectives & Process Classification Content Questions 2 Objectives Develop
Coastal and Marine Ecological Classification Standard (CMECS) Kathy Goodin, NatureServe EMECS, August 2011 Baltimore, MD 1 Outline Objectives & Process Classification Content Questions 2 Objectives Develop
PRELIMINARY DRAFT FOR DISCUSSION PURPOSES
 Memorandum To: David Thompson From: John Haapala CC: Dan McDonald Bob Montgomery Date: February 24, 2003 File #: 1003551 Re: Lake Wenatchee Historic Water Levels, Operation Model, and Flood Operation This
2003 Moisture Outlook
 2003 Moisture Outlook Nolan Doesken and Roger Pielke, Sr. Colorado Climate Center Prepared by Tara Green and Odie Bliss http://climate.atmos.colostate.edu Through 1999 Through 1999 Fort Collins Total Water
Variability and trends in daily minimum and maximum temperatures and in diurnal temperature range in Lithuania, Latvia and Estonia
 Variability and trends in daily minimum and maximum temperatures and in diurnal temperature range in Lithuania, Latvia and Estonia Jaak Jaagus Dept. of Geography, University of Tartu Agrita Briede Dept.
ENGINE SERIAL NUMBERS
 ENGINE SERIAL NUMBERS The engine number was also the serial number of the car. Engines were numbered when they were completed, and for the most part went into a chassis within a day or so. However, some
Application of Paleoecologic Methods to Coastal Resource Management: An Example from Biscayne National Park
 Application of Paleoecologic Methods to Coastal Resource Management: An Example from Biscayne National Park G. Lynn Wingard Introduction THE NATION S COASTAL ECOSYSTEMS HAVE CHANGED PROFOUNDLY during the
Climatography of the United States No
 Climate Division: ND 8 NWS Call Sign: BIS Month (1) Min (2) Month(1) Extremes Lowest (2) Temperature ( F) Lowest Month(1) Degree s (1) Base Temp 65 Heating Cooling 100 Number of s (3) Jan 21.1 -.6 10.2
Climatography of the United States No
 Climate Division: AK 5 NWS Call Sign: ANC Month (1) Min (2) Month(1) Extremes Lowest (2) Temperature ( F) Lowest Month(1) Degree s (1) Base Temp 65 Heating Cooling 90 Number of s (3) Jan 22.2 9.3 15.8
Characterizing the Physical Oceanography of Coastal Waters Off Rhode Island
 Characterizing the Physical Oceanography of Coastal Waters Off Rhode Island Dan Codiga and Dave Ullman Graduate School of Oceanography University of Rhode Island RI OSAMP Stakeholder Meeting January 5,
Juvenile Sportfish Monitoring in Florida Bay, Everglades National Park
 Juvenile Sportfish Monitoring in Florida Bay, Everglades National Park Christopher R. Kelble Joan Browder Allyn Powell I. Introduction The spotted seatrout, Cynoscion nebulosus, is an important recreational
Colorado s 2003 Moisture Outlook
 Colorado s 2003 Moisture Outlook Nolan Doesken and Roger Pielke, Sr. Colorado Climate Center Prepared by Tara Green and Odie Bliss http://climate.atmos.colostate.edu How we got into this drought! Fort
Algae and Dissolved Oxygen Dynamics of Landa Lake and the Upper Spring Run
 Algae and Dissolved Oxygen Dynamics of Landa Lake and the Upper Spring Run Why study algae and dissolved oxygen dynamics of Landa Lake and the Upper Spring Run? During low-flow conditions, extensive algal
Average temperature ( F) World Climate Zones. very cold all year with permanent ice and snow. very cold winters, cold summers, and little rain or snow
 World Climate Zones. very cold all year with permanent ice and snow. very cold winters, cold summers, and little rain or snow") P r e v i e w Look carefully at the climagraph of Mumbai, India. What is the wettest month (or months) in Mumbai? What is the driest month (or months) in Mumbai? What effects might this city s climate
P r e v i e w Look carefully at the climagraph of Mumbai, India. What is the wettest month (or months) in Mumbai? What is the driest month (or months) in Mumbai? What effects might this city s climate
Effect of El Niño Southern Oscillation (ENSO) on the number of leaching rain events in Florida and implications on nutrient management
 on the number of leaching rain events in Florida and implications on nutrient management") Effect of El Niño Southern Oscillation (ENSO) on the number of leaching rain events in Florida and implications on nutrient management C. Fraisse 1, Z. Hu 1, E. H. Simonne 2 May 21, 2008 Apopka, Florida
Effect of El Niño Southern Oscillation (ENSO) on the number of leaching rain events in Florida and implications on nutrient management C. Fraisse 1, Z. Hu 1, E. H. Simonne 2 May 21, 2008 Apopka, Florida
Technical note on seasonal adjustment for M0
 Technical note on seasonal adjustment for M0 July 1, 2013 Contents 1 M0 2 2 Steps in the seasonal adjustment procedure 3 2.1 Pre-adjustment analysis............................... 3 2.2 Seasonal adjustment.................................
Computing & Telecommunications Services Monthly Report January CaTS Help Desk. Wright State University (937)
") January 215 Monthly Report Computing & Telecommunications Services Monthly Report January 215 CaTS Help Desk (937) 775-4827 1-888-775-4827 25 Library Annex helpdesk@wright.edu www.wright.edu/cats/ Last
January 215 Monthly Report Computing & Telecommunications Services Monthly Report January 215 CaTS Help Desk (937) 775-4827 1-888-775-4827 25 Library Annex helpdesk@wright.edu www.wright.edu/cats/ Last
Faisal S. Syed, Shahbaz M.,Nadia R.,Siraj I. K., M. Adnan Abid, M. Ashfaq, F. Giorgi, J. Pal, X. Bi
 ICTP NCP International Conference on Global Change 15-19 November, 2006, Islamabad Climate Change Studies over South Asia Region Using Regional Climate Model RegCM3 (Preliminary Results) Faisal S. Syed,
Analysis of Historical Pattern of Rainfall in the Western Region of Bangladesh
 24 25 April 214, Asian University for Women, Bangladesh Analysis of Historical Pattern of Rainfall in the Western Region of Bangladesh Md. Tanvir Alam 1*, Tanni Sarker 2 1,2 Department of Civil Engineering,
Computing & Telecommunications Services
 Computing & Telecommunications Services Monthly Report September 214 CaTS Help Desk (937) 775-4827 1-888-775-4827 25 Library Annex helpdesk@wright.edu www.wright.edu/cats/ Table of Contents HEAT Ticket
Global Climates. Name Date
 Global Climates Name Date No investigation of the atmosphere is complete without examining the global distribution of the major atmospheric elements and the impact that humans have on weather and climate.
Climatography of the United States No
 Month (1) Min (2) Month(1) Extremes Lowest (2) Temperature ( F) Lowest Month(1) Degree s (1) Base Temp 65 Heating Cooling 100 Number of s (3) 42.6 24.2 33.4 79 1950 25 44.2 1974-16 1994 19 18.8 1977 977
The Climate of Oregon Climate Zone 5 High Plateau
 105 E55 Unbound issue i". 9 13oes not circulate CZe Special Report 917 May 1993 The Climate of Oregon Climate Zone 5 Property of OREGON STATE UNIVERSITY Library Serials Corvallis, OR 97331-4503 Agricultural
Climatography of the United States No
 Month (1) Min (2) Month(1) Extremes Lowest (2) Temperature ( F) Lowest Month(1) Degree s (1) Base Temp 65 Heating Cooling 100 Number of s (3) Jan 54.3 40.1 47.2 75 1998 17 53.0 1995 18 1949 11 41.7 1972
Mapping and Valuing Pelagic Ecosystem Services in the Lesser Sunda Ecoregion Preliminary Results on the Manta Rays Pelagic Fisheries for Tourism
 Mapping and Valuing Pelagic Ecosystem Services in the Lesser Sunda Ecoregion Preliminary Results on the Manta Rays Pelagic Fisheries for Tourism Luky Adrianto. Yudi Wahyudin, Alan F Koropitan and Benny
Climatography of the United States No
 Month (1) Min (2) Month(1) Extremes Lowest (2) Temperature ( F) Lowest Month(1) Degree s (1) Base Temp 65 Heating Cooling 100 Number of s (3) Jan 63.9 39.3 51.6 86 1976 16 56.6 1986 20 1976 2 47.5 1973
Climatography of the United States No
 Temperature ( F) Month (1) Min (2) Month(1) Extremes Lowest (2) Lowest Month(1) Degree s (1) Base Temp 65 Heating Cooling 100 Number of s (3) Jan 32.8 21.7 27.3 62 1918 1 35.8 1983-24 1950 29 10.5 1979
Analysis of Environmental Impacts from the Port of Miami Expansion. Julienne Beblo
 Analysis of Environmental Impacts from the Port of Miami Expansion Julienne Beblo 6.28.16 The Port of Miami One of the most prominent ports for global tourism and commerce Contributes $28 billion/yr to
Climate also has a large influence on how local ecosystems have evolved and how we interact with them.
 The Mississippi River in a Changing Climate By Paul Lehman, P.Eng., General Manager Mississippi Valley Conservation (This article originally appeared in the Mississippi Lakes Association s 212 Mississippi
Climatography of the United States No
 Climate Division: CA 2 NWS Call Sign: Month (1) Min (2) Month(1) Extremes Lowest (2) Temperature ( F) Lowest Month(1) Degree s (1) Base Temp 65 Heating Cooling 100 Number of s (3) 53.3 31.8 42.6 74+ 1975
Climatography of the United States No
 Climate Division: CA 2 NWS Call Sign: Month (1) Min (2) Month(1) Extremes Lowest (2) Temperature ( F) Lowest Month(1) Degree s (1) Base Temp 65 Heating Cooling 100 Number of s (3) 53.7 32.7 43.2 79 1962
Climatography of the United States No
 Climate Division: CA 6 NWS Call Sign: Month (1) Min (2) Month(1) Extremes Lowest (2) Temperature ( F) Lowest Month(1) Degree s (1) Base Temp 65 Heating Cooling 100 Number of s (3) 68.5 45.7 57.1 90 1971
Climatography of the United States No
 Climate Division: CA 5 NWS Call Sign: Month (1) Min (2) Month(1) Extremes Lowest (2) Temperature ( F) Lowest Month(1) Degree s (1) Base Temp 65 Heating Cooling 100 Number of s (3) 59.3 31.5 45.4 80 1976
Climatography of the United States No
 Climate Division: CA 7 NWS Call Sign: Month (1) Min (2) Month(1) Extremes Lowest (2) Temperature ( F) Lowest Month(1) Degree s (1) Base Temp 65 Heating Cooling 100 Number of s (3) 44.5 29.3 36.9 69 1951
Climatography of the United States No
 Climate Division: CA 7 NWS Call Sign: Month (1) Min (2) Month(1) Extremes Lowest (2) Temperature ( F) Lowest Month(1) Degree s (1) Base Temp 65 Heating Cooling 100 Number of s (3) 56.0 35.7 45.9 83 1975
Climatography of the United States No
 Climate Division: CA 7 NWS Call Sign: Month (1) Min (2) Month(1) Extremes Lowest (2) Temperature ( F) Lowest Month(1) Degree s (1) Base Temp 65 Heating Cooling 1 Number of s (3) 64.8 45.4 55.1 85 1971
Climatography of the United States No
 Climate Division: CA 7 NWS Call Sign: Month (1) Min (2) Month(1) Extremes Lowest (2) Temperature ( F) Lowest Month(1) Degree s (1) Base Temp 65 Heating Cooling 1 Number of s (3) 65.5 38.7 52.1 87 1962
Climatography of the United States No
 Climate Division: CA 2 NWS Call Sign: Month (1) Min (2) Month(1) Extremes Lowest (2) Temperature ( F) Lowest Month(1) Degree s (1) Base Temp 65 Heating Cooling 100 Number of s (3) 53.3 37.1 45.2 77 1962
Climatography of the United States No
 Climate Division: CA 7 NWS Call Sign: Month (1) Min (2) Month(1) Extremes Lowest (2) Temperature ( F) Lowest Month(1) Degree s (1) Base Temp 65 Heating Cooling 100 Number of s (3) 58.8 34.3 46.6 81+ 1948
Climatography of the United States No
 Climate Division: CA 7 NWS Call Sign: Month (1) Min (2) Month(1) Extremes Lowest (2) Temperature ( F) Lowest Month(1) Degree s (1) Base Temp 65 Heating Cooling 100 Number of s (3) 70.4 44.2 57.3 95 1971
Progress Report: Assessment of Existing Information
 Progress Report: Assessment of Existing Information Atlantic Coastal Fish Habitat Partnership (ACFHP) Steering Committee Rehoboth Beach, Delaware, October 22, 2008 David Moe Nelson Tom McGrath Adam Zitello
Climatography of the United States No
 Climate Division: CA 4 NWS Call Sign: Month (1) Min (2) Month(1) Extremes Lowest (2) Temperature ( F) Lowest Month(1) Degree s (1) Base Temp 65 Heating Cooling 100 Number of s (3) Jan 56.4 43.6 50.0 77
Climatic and Ecological Conditions in the Klamath Basin of Southern Oregon and Northern California: Projections for the Future
 Climatic and Ecological Conditions in the Klamath Basin of Southern Oregon and Northern California: Projections for the Future A Collaborative Effort by: CLIMATE LEADERSHIP INITIATIVE INSTITUTE FOR A SUSTAINABLE
BRADSHAW'S RAILWAY GUIDE : accessible copies
 BRADSHAW'S RAILWAY GUIDE : accessible copies Y = copy held; YS = copy held with supplement; R = reprint held; I = incomplete copy held; F = fragile copy (not available for general public - access limited);
Climatography of the United States No
 Climate Division: CA 1 NWS Call Sign: Month (1) Min (2) Month(1) Extremes Lowest (2) Temperature ( F) Lowest Month(1) Degree s (1) Base Temp 65 Heating Cooling 100 Number of s (3) Jan 57.9 38.9 48.4 85
SoFLA-HYCOM (South Florida HYCOM) Regional Model around Florida Straits, Florida Bay and the Florida Keys: An overview FLORIDA.
 Regional Model around Florida Straits, Florida Bay and the Florida Keys: An overview FLORIDA.") SoFLA-HYCOM (South Florida HYCOM) Regional Model around Florida Straits, Florida Bay and the Florida Keys: An overview SW Florida shelf FLORIDA Florida Current B A H A M A S 25N CUBA 83W 79W Villy KOURAFALOU
SoFLA-HYCOM (South Florida HYCOM) Regional Model around Florida Straits, Florida Bay and the Florida Keys: An overview SW Florida shelf FLORIDA Florida Current B A H A M A S 25N CUBA 83W 79W Villy KOURAFALOU
Climatography of the United States No
 Climate Division: CA 4 NWS Call Sign: Month (1) Min (2) Month(1) Extremes Lowest (2) Temperature ( F) Lowest Month(1) Degree s (1) Base Temp 65 Heating Cooling 100 Number of s (3) Jan 49.4 37.5 43.5 73
Climatography of the United States No
 Climate Division: CA 5 NWS Call Sign: Month (1) Min (2) Month(1) Extremes Lowest (2) Temperature ( F) Lowest Month(1) Degree s (1) Base Temp 65 Heating Cooling 100 Number of s (3) Jan 56.6 36.5 46.6 81
Climatography of the United States No
 Climate Division: CA 4 NWS Call Sign: Month (1) Min (2) Month(1) Extremes Lowest (2) Temperature ( F) Lowest Month(1) Degree s (1) Base Temp 65 Heating Cooling 100 Number of s (3) Jan 55.6 39.3 47.5 77
Climatography of the United States No
 Climate Division: CA 5 NWS Call Sign: Month (1) Min (2) Month(1) Extremes Lowest (2) Temperature ( F) Lowest Month(1) Degree s (1) Base Temp 65 Heating Cooling 100 Number of s (3) Jan 44.8 25.4 35.1 72
Climatography of the United States No
 Climate Division: CA 6 NWS Call Sign: Month (1) Min (2) Month(1) Extremes Lowest (2) Temperature ( F) Lowest Month(1) Degree s (1) Base Temp 65 Heating Cooling 100 Number of s (3) Jan 69.4 46.6 58.0 92
Climatography of the United States No
 Climate Division: CA 4 NWS Call Sign: Month (1) Min (2) Month(1) Extremes Lowest (2) Temperature ( F) Lowest Month(1) Degree s (1) Base Temp 65 Heating Cooling 1 Number of s (3) Jan 58.5 38.8 48.7 79 1962
Climatography of the United States No
 Climate Division: CA 1 NWS Call Sign: Month (1) Min (2) Month(1) Extremes Lowest (2) Temperature ( F) Lowest Month(1) Degree s (1) Base Temp 65 Heating Cooling 1 Number of s (3) Jan 57.8 39.5 48.7 85 1962
Climatography of the United States No
 Climate Division: CA 6 NWS Call Sign: Month (1) Min (2) Month(1) Extremes Lowest (2) Temperature ( F) Lowest Month(1) Degree s (1) Base Temp 65 Heating Cooling 1 Number of s (3) Jan 67.5 42. 54.8 92 1971
UPPLEMENT A COMPARISON OF THE EARLY TWENTY-FIRST CENTURY DROUGHT IN THE UNITED STATES TO THE 1930S AND 1950S DROUGHT EPISODES
 UPPLEMENT A COMPARISON OF THE EARLY TWENTY-FIRST CENTURY DROUGHT IN THE UNITED STATES TO THE 1930S AND 1950S DROUGHT EPISODES Richard R. Heim Jr. This document is a supplement to A Comparison of the Early
The Blob, El Niño, and the Drought in Puget Sound
 The Blob, El Niño, and the Drought in Puget Sound Christopher Krembs, Marine Monitoring Unit, EAP, Ecology The Drought The Blob El Niño Warmest first four months since 1981, (Source: NASA's Goddard Institute
"The Relationship Between Seagrass Cover and Species- richness of Invertebrates"
 "The Relationship Between Seagrass Cover and Species- richness of Invertebrates" SCIE 2204: Marine Systems The Cottesloe Marine Ecosystem Research Project 2014 By Baronie Shaw, K., Bortoloso, T., Cargill,
TASMANIAN SEAGRASS COMMUNITIES
 TASMANIAN SEAGRASS COMMUNITIES by Christopher Grant Rees, B.Ed (}Ions.) Submitted in partial fulfilment of the requirement for the degree of Master of Environmental Studies (By Coursework) Centre for Environmental