RAINFALL AVERAGES AND SELECTED EXTREMES FOR CENTRAL AND SOUTH FLORIDA. Thomas K. MacVicar
|
|
|
- Basil Anthony Chapman
- 5 years ago
- Views:
Transcription


1 TECHNICAL PUBLICATION #83-2 March 1983 RAINFALL AVERAGES AND SELECTED EXTREMES FOR CENTRAL AND SOUTH FLORIDA by Thomas K. MacVicar "This public document was promulgated at an annual cost of $136.74, or $.25 per copy to inform the public regarding water resource studies of the District." RP 83-2 R Water Resources Division Resource Planning Department South Florida Water Management District West Palm Beach, Florida


2 TABLE OF CONTENTS Page Acknowledgments... ii Introduction... 1 Contour Mapping Procedure... 2 Selected Rainfall Occurrences... 3 Special Notes... 5 FIGURES Figure 1 Average Annual Rainfall... 7 Figure 2 Average Wet Season Rainfall... 8 Figure 3 Average Dry Season Rainfall... 9 Figures 4-15 Monthly Average Rainfall Figure Annual Rainfall Figure Annual Rainfall Figure Wet Season Figure Wet Season Figure Dry Season Figure Wet Season Figure Dry Season Figure Wet Season Figure Dry Season Figure Wet Season i


3 ACKNOWLEDGMENTS The production of this report was made possible by the existence of a computer data base facility for daily rainfall measurements. The engineering technicians of the Water Resources Division have been responsible for maintaining and updating the data base with recorded rainfall amounts from hundreds of gages throughout the District. Gaye Lathrop handled the task of compiling and checking the data sets required for each of these maps, and for running the programs to produce the computergenerated rough drafts of the contour maps. All the maps contained in this report were produced on the Computervision system in the Technical Services Department. The staff of the Land Resources Division, especially Louis Isern, deserves all the credit for the excellent graphical quality of the map series.

 depicts historical rainfall averages for the wet season, dry season, calendar year, and each calendar month.")
4 RAINFALL AVERAGES AND SELECTED EXTREMES FOR CENTRAL AND SOUTH FLORIDA I. Introduction The purpose of this document is to present a graphic summary of historical rainfall activity in that portion of Florida now under the jurisdiction of the South Florida Water Management District. The data are presented through a series of isohyetal maps in which the contour lines (isohyets) indicate rainfall amounts in inches. The first group of maps (Figures 1 through 15) depicts historical rainfall averages for the wet season, dry season, calendar year, and each calendar month. The wet season includes May 1 through October 31, and the dry season is November 1 through April 30. Data were analyzed for all stations within or near the District for which a minimum of 20 years of data were available. The period of record at individual gages varied from 20 to 100 years with an average of about 35 years of record at each gage. The number of stations used for each map varied from 141 to 165 for the maps of average rainfall. Figures 1 through 3 were taken directly from District Publication 81-3, Frequency Analysis of Rainfall Maximums for Central and South Florida. The second group of maps (Figures 16 through 25), illustrates a few of the more significant deviations from average conditions which have been recorded in the District area. While the average maps give a good idea of the general conditions which have prevailed for the past 40 years, it is the extreme events which dictate the design of the Central and South Florida Flood Control Project and the development of the opera 1


5 tional criteria which govern its management. Although some of the events such as the flood of 1947 and the droughts of 1971 and 1981, have considerable historical significance, the group as a whole was chosen to demonstrate the degree of variability that is common in southern Florida. II. Contour Mapping Procedure A two-step procedure using mathematical and manual contour locating techniques was used to produce the maps. The first step utilized a computer plotting routine to provide rough drafts of the maps based solely on a mathematical analysis of the data. A square grid system with a spacing of 3.8 miles between points was superimposed over the District area. The location of each gage and the rainfall amount were used to estimate a rainfall value at each grid point. These grid point values were determined using a reciprocal distance squared (RDS) interpolation scheme among a fixed number of gages closest to the point. From four to eight gage values, depending on the total number of stations available for a specific map, were used to estimate each grid point. A computer contouring routine was then used to draw a set of curves throughout the grid at the specified contour levels. Using the computer generated maps as a guide, smooth curves were drawn ignoring the numerical distortions inherent in the computer technique and considering the details about individual stations or areas that could not be directly incorporated into the mathematical formulation. Where individual station values were noticeably different from surrounding stations, the specific data were checked to determine the cause of the difference and to reflect it in the final form of the contours. In this way, stations with longer record or more reliable measuring and reporting facilities could be given more weight. 2


6 III. Selected Rainfall Occurrences Figure 16 - Annual Rainfall 1947 This was the wettest year on record in southern Florida. Two hurricanes struck the Lower East Coast at the end of a summer that had already experienced higher than average rainfall. The flood of 1947 led to the creation of the Central and South Florida Flood Control District. A total of 86 gages were available for this map. National Weather Service gages with more than 50 years of record that list 1947 as the wettest year, include Homestead, Everglades City, Ft. Lauderdale, Hypoluxo, Ft. Pierce, Belle Glade, Canal Point, La Belle, Punta Gorda, and Arcadia. The 80.2 inches measured at Ft. Myers in 1947 is second only to the 82.6 inches recorded in Key West is the only other station in southern Florida with records for Neither 1852 nor 1947 were extreme rainfall years for Key West. Figure 17 - Annual Rainfall 1955 This was a low rainfall year for most of the District. The eastern portions of Palm Beach, Broward, and north Dade Counties received less than 65% of average rainfall. The Kissimmee valley received about 75% of normal, while the rest of the District recorded amounts ranging from 80% to 95% of average. There were 105 gages reporting data for this map. Figure 18 - Wet Season 1961 The 1961 wet season was one of the driest "wet seasons" on record. The Lower East Coast and the Kissimmee valley recorded about two-thirds of their historical average rainfall. Only isolated areas near Ft. Myers and Clewiston received the average for the season. A total of 182 gages were used in the analysis. 3


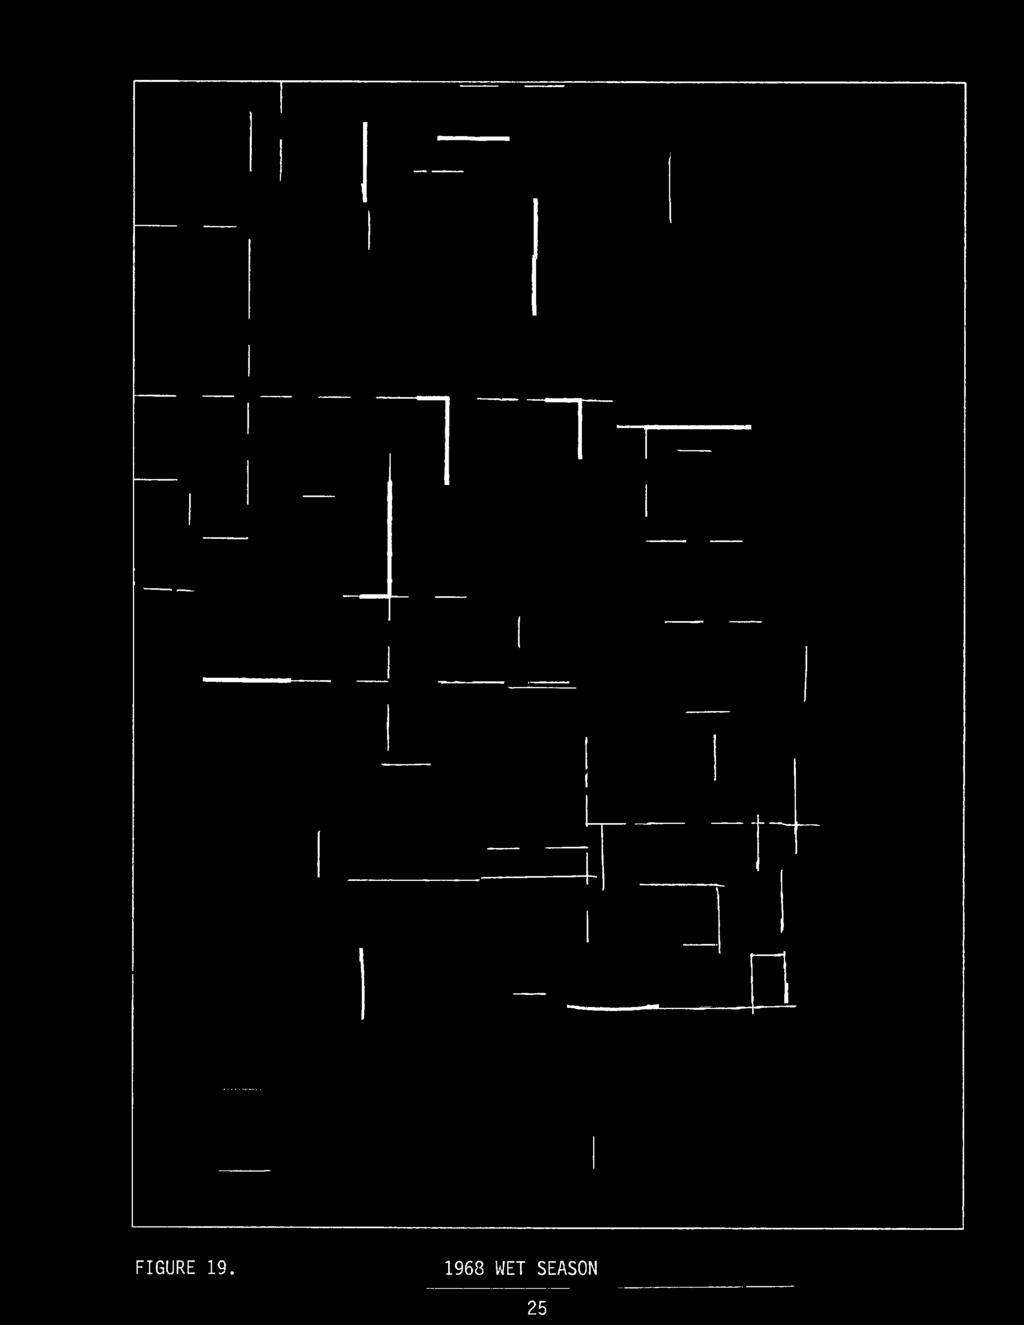
7 Figure 19 - Wet Season 1968 Data were available from 222 stations for this period. The entire peninsula south of Okeechobee City received heavier than normal rainfall from May through October. Some areas in Dade County recorded amounts 80% above the long term average for those months. May and June 1968 were especially wet over the Lower East Coast. Homestead recorded 39.6 inches, or 2.5 times the long term average for those two months. Figure 20 - Dry Season Dry seasons, when defined as a specific calendar period, are not always dry. Only the extreme southern tip of the state had normal rainfall amounts from November 1969 through April Lee, Collier, and Hendry Counties measured more than double their normal dry season rainfall. Palm Beach and Broward Counties had about 80% above normal, and the Kissimmee valley had 50% to 60% higher than average rainfall for the period. A very wet March was responsible for most of the rain. The contour map was based on data from 239 rain gages. Figures Wet Season 1970; Dry Season The drought of 1971 had a far-reaching impact on the perception of south Florida's water management needs and the institutional requirements necessary to meet them. Although the whole region experienced a deficiency, the most severe shortages were recorded in the highly urbanized coastal areas where demand was at its peak due to extensive population growth. Many observation wells measured record low groundwater levels during March and April of There were 244 stations reporting data for this period. Figure 21 shows the dry antecedent conditions 4


8 which amplified the effects of the dry winter and spring of The 1970 wet season produced above average rain on the southwest coast, but the Kissimmee valley and the Lower East Coast experienced deficiencies from 20% to 30%. Therefore, the volume of groundwater and surface water storage at the beginning of the dry season was not sufficient to offset the very low rainfall of the ensuing months. Figures Wet Season 1980; Dry Season ; Wet Season 1981 The 1981 drought resulted in the lowest level ever recorded for Lake Okeechobee. It was a wet season drought centered around Lake Okeechobee and its main tributary, the Kissimmee River. The dry season had approximately average rainfall with the only noticeable shortfalls showing up around the lake; however, rainfall during the preceding and following wet seasons was significantly below average. The 1980 wet season was 20% to 40% below normal for most of the District. The 1981 wet season rainfall was at or above average for most of the coastal regions, but still 20%-30% below normal in the central portion of the state. The rain that came was late and the lake did not begin its normal wet season rise until August. Data from 215 stations were processed to produce these maps. IV. Special Notes 1. An attempt was made to maintain a constant contour interval on each map; however, on some maps, intermediate contours were added to improve the clarity or pinpoint local maximum or minimum areas. Dashed lines were used whenever intermediate contour lines were drawn. 5

9 2. These maps, especially the average series, should not be used to estimate rainfall onto the surface of Lake Okeechobee. Rainfall data collected over the lake indicate that significantly less precipitation falls on the lake than on the nearby land area. These data are not of sufficient quality or duration to estimate long term averages and, therefore, were not included in this analysis. 6


10 FIGURE 1. AVERAGE ANNUAL RAINFALL


11 8 FIGURE 2. AVERAGE WET SEASON RAINFALL

![.. WCA (I ] A \ \ W -------1 \\w q A 5v3 B 0 C A RATON NAPLES](/docs-images/86/94322869/images/12-2.jpg "ALLIGATOR A LL E Y u \ 1 FORT klauderdale IS & MIAMI 0 10 20 30")
12 ORLANDO FT. PIERCE STUART JUPITER j» F T. MYEF S Nv \ - T v n c S WEST PALM BEACH... WCA (I ] A \ \ W \\w q A 5v3 B 0 C A RATON NAPLES ALLIGATOR A LL E Y u \ 1 FORT klauderdale IS & MIAMI MILES FIGURE 3. AVERAGE DRY SEASON RAINFALL 9


13 FIGURE 4. MONTHLY AVERAGE RAINFALL - JANUARY 10


14 ORLANDO FT. PIERCE A 2.50 STUART JUPITER / 2.50 FT. MYEF WEST & flpalm BEACH lilsboca RATON 2.00 ^ NAPLES ALLOCATOR ALLEY / I 2.50 FORT LAUDERDALE 2.25 HOMESTEAI MILES FIGURE 5. MONTHLY AVERAGE RAINFALL - FEBRUARY 11


15 FIGURE 6. MONTHLY AVERAGE RAINFALL - MARCH 12


16 J ORLANDj FT. PIERCE STUART JUPITER u.3.0 FT. MYEF ECsLE GLADE WEST PALM BEACH BOCA RATON NAPLES ALLIGATOR ALLEY FORT LAUDERDALE MIAMI MILES FIGURE 7. MONTHLY AVERAGE RAINFALL - APRIL 13


17 FIGURE 8. MONTHLY AVERAGE RAINFALL - MAY 14
!['ORLANDO _r FT. PIERCE :L#>]TER ELLE GLADE.8.](/docs-images/86/94322869/images/18-1.jpg "0 WEST PALM BEACH 8.")

18 'ORLANDO _r FT. PIERCE :L#>]TER ELLE GLADE.8.0 WEST PALM BEACH 8.5 IBOCARATON NAPLES a l l i g a t o r a l l e y FORT LAUDERDALE [MIAMI MILES FIGURE 9. MONTHLY AVERAGE RAINFALL - JUNE 15


19 FIGURE 10. MONTHLY AVERAGE RAINFALL - JULY


20 17 FIGURE 11. MONTHLY AVERAGE RAINFALL - AUGUST


21 18 FIGURE 12. MONTHLY AVERAGE RAINFALL - SEPTEMBER


22 19 3*5 /ORLANDO 4,0 7.0 MYEF «i ^I 1 1 ' \ L % 1 Wm \ 1 \. _ L, V, r \ 3.5 T 1 I \ I V / A L - V - / 0K^E CH0 B E E [ f t. PIERCE jstuart k 8.0,JUPITER WEST UPALM BEACH U-8.0 'BOCA RATON ^9.0 NAPLES a l l i g I t o r a l l e y FORT flauderdale MIAMI MILES FIGURE 13. MONTHLY AVERAGE RAINFALL - OCTOBER


23 A T L A N T I C O C E A N WEST UPALM BEACH itjjb O C A RATON FORT flauderdale FIGURE 14. MONTHLY AVERAGE RAINFALL - NOVEMBER


24 21 ORLANDO J FT. PIERCE v 2.25.STUART 2.50 J u p it e r WEST PALM BEACH BOCA RATON NAPLES a l u g X p r a l l e y I ' 2.50 FORT LAUDERDALE ^2.25 MIAMI MILES FIGURE 15. MONTHLY AVERAGE RAINFALL - DECEMBER


25 FIGURE ANNUAL RAINFALL


26 FIGURE ANNUAL RAINFALL 23


27 ?A FIGURE WET SEASON

28 FIGURE WET SEASON 25


29 FIGURE DRY SEASON


30 ORLANDO FT. PIERCE - 35.STUART 35 JUPITER 30 ELLE/GLADE WEST PALM BEACH 35 t_ 3 B 0 C A RATON NAPLES ALLIGATOR ALLEY FORT LAUDERDALE O I m ia m i MILES FIGURE WET SEASON 27


31 FIGURE DRY SEASON 28


32 ORLANDO J 2 5 ^ A f T. PIERCE \ \ L 30,STU ART.JUPITER T. MYEF LLE GLADE WEST PALM BEACH NAPLES L L 1GATOR ALLEY W CA BOCA RATON 30 FORT LAUDERDALE ^ 30 MIAMI MILES FIGURE WET SEASON 29


33 FIGURE DRY SEASON 30

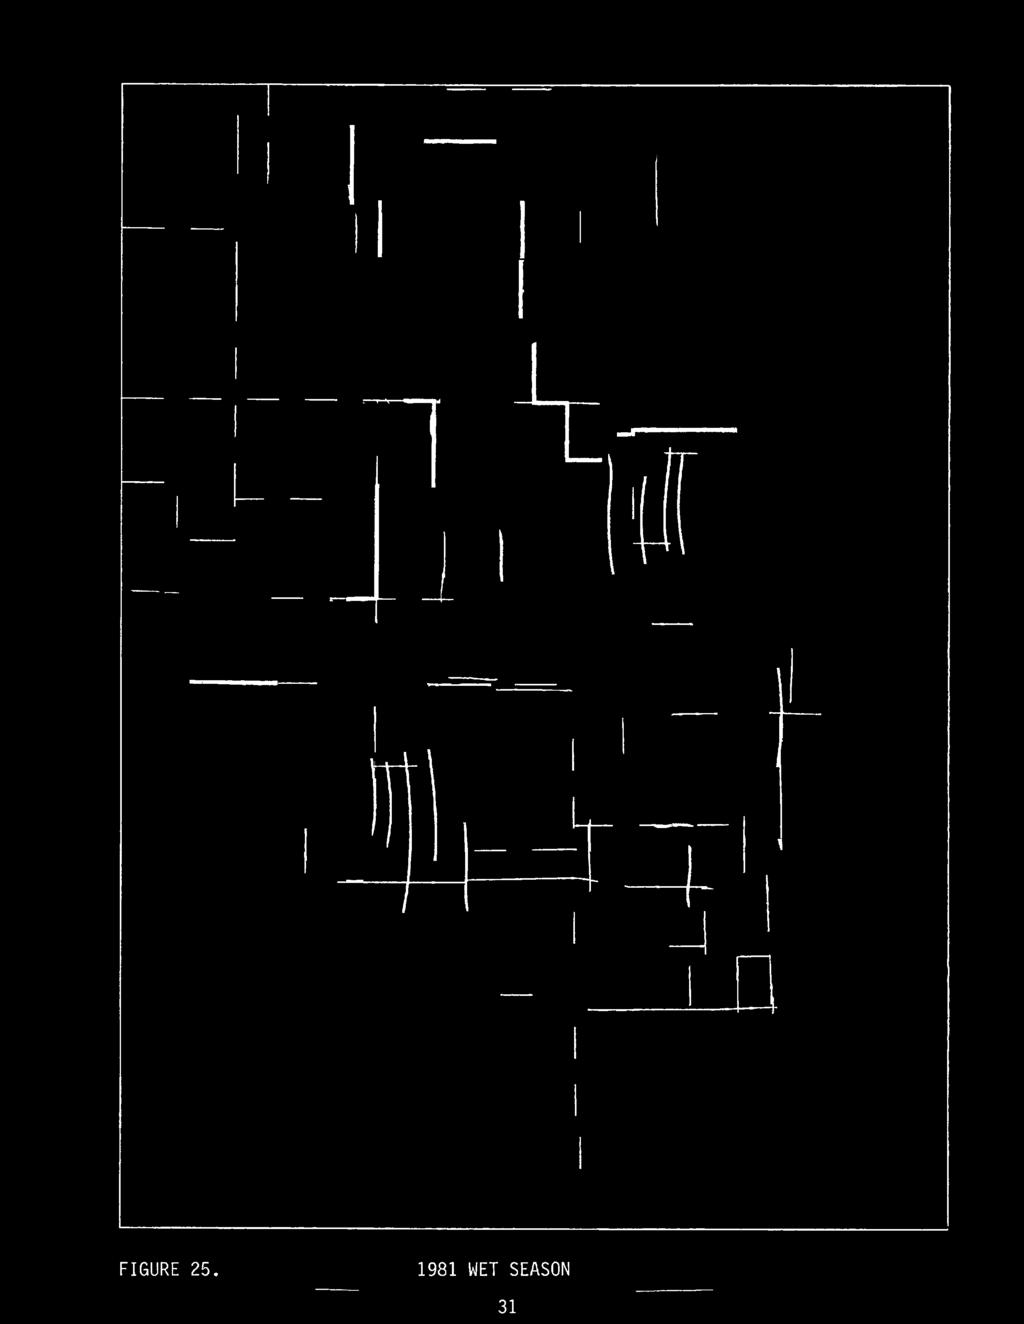
34 FIGURE WET SEASON 31
Table 1. August average temperatures and departures from normal ( F) for selected cities.
 for selected cities.") Climate Summary for Florida August 2016 Prepared by Lydia Stefanova and David Zierden Florida Climate Center, The Florida State University, Tallahassee, Florida Online at: http://climatecenter.fsu.edu/products-services/summaries
Climate Summary for Florida August 2016 Prepared by Lydia Stefanova and David Zierden Florida Climate Center, The Florida State University, Tallahassee, Florida Online at: http://climatecenter.fsu.edu/products-services/summaries
MIAMI-SOUTH FLORIDA National Weather Service Forecast Office
 MIAMI-SOUTH FLORIDA National Weather Service Forecast Office http://www.weather.gov/miami June 2015 South Florida Weather Summary Dry East, Wet West...Drought Remains SE Florida July 3, 2015: Depending
Rainfall Observations in the Loxahatchee River Watershed
 Rainfall Observations in the Loxahatchee River Watershed Richard C. Dent Loxahatchee River District September 1997 Introduction Rain is a common occurrence in south Florida, yet its presence or absence
2011 Year in Review TORNADOES
 2011 Year in Review The year 2011 had weather events that will be remembered for a long time. Two significant tornado outbreaks in April, widespread damage and power outages from Hurricane Irene in August
Illinois Drought Update, December 1, 2005 DROUGHT RESPONSE TASK FORCE Illinois State Water Survey, Department of Natural Resources
 Illinois Drought Update, December 1, 2005 DROUGHT RESPONSE TASK FORCE Illinois State Water Survey, Department of Natural Resources For more drought information please go to http://www.sws.uiuc.edu/. SUMMARY.
Investigation IV: Seasonal Precipitation and Seasonal Surface Runoff in the US
 Investigation IV: Seasonal Precipitation and Seasonal Surface Runoff in the US Purpose Students will consider the seasonality of precipitation and surface runoff and think about how the time of year can
Monthly Long Range Weather Commentary Issued: NOVEMBER 16, 2015 Steven A. Root, CCM, Chief Analytics Officer, Sr. VP, sales
 Monthly Long Range Weather Commentary Issued: NOVEMBER 16, 2015 Steven A. Root, CCM, Chief Analytics Officer, Sr. VP, sales sroot@weatherbank.com OCTOBER 2015 Climate Highlights The Month in Review The
January 25, Summary
 January 25, 2013 Summary Precipitation since the December 17, 2012, Drought Update has been slightly below average in parts of central and northern Illinois and above average in southern Illinois. Soil
Climate Outlook through 2100 South Florida Ecological Services Office Vero Beach, FL January 13, 2015
 Climate Outlook through 2100 South Florida Ecological Services Office Vero Beach, FL January 13, 2015 Short Term Drought Map: Short-term (
February 10, Mr. Jeff Smith, Chairman Imperial Valley Water Authority E County Road 1000 N Easton, IL Dear Chairman Smith:
 February 1, 1 Mr. Jeff Smith, Chairman Imperial Valley Water Authority 8 E County Road 1 N Easton, IL Dear Chairman Smith: The Illinois State Water Survey (ISWS), under contract to the Imperial Valley
November 2018 Weather Summary West Central Research and Outreach Center Morris, MN
 November 2018 Weather Summary Lower than normal temperatures occurred for the second month. The mean temperature for November was 22.7 F, which is 7.2 F below the average of 29.9 F (1886-2017). This November
Meteorology. Circle the letter that corresponds to the correct answer
 Chapter 3 Worksheet 1 Meteorology Name: Circle the letter that corresponds to the correct answer 1) If the maximum temperature for a particular day is 26 C and the minimum temperature is 14 C, the daily
Climate. Annual Temperature (Last 30 Years) January Temperature. July Temperature. Average Precipitation (Last 30 Years)
 January Temperature. July Temperature. Average Precipitation (Last 30 Years)") Climate Annual Temperature (Last 30 Years) Average Annual High Temp. (F)70, (C)21 Average Annual Low Temp. (F)43, (C)6 January Temperature Average January High Temp. (F)48, (C)9 Average January Low Temp.
Climate Annual Temperature (Last 30 Years) Average Annual High Temp. (F)70, (C)21 Average Annual Low Temp. (F)43, (C)6 January Temperature Average January High Temp. (F)48, (C)9 Average January Low Temp.
Flooding in Western North Carolina: Some Spatial, Hydrologic, and Seasonal Characteristics CAUTION!! Outline. Basic Flood Facts.
 Flooding in Western North Carolina: Some Spatial, Hydrologic, and Seasonal Characteristics J. Greg Dobson CAUTION!! National Environmental Modeling and Analysis Center RENCI at UNC-Asheville Engagement
Climate Outlook through 2100 South Florida Ecological Services Office Vero Beach, FL September 9, 2014
 Climate Outlook through 2100 South Florida Ecological Services Office Vero Beach, FL September 9, 2014 Short Term Drought Map: Short-term (
A summary of the weather year based on data from the Zumwalt weather station
 ZUMWALT PRAIRIE WEATHER 2016 A summary of the weather year based on data from the Zumwalt weather station Figure 1. An unusual summer storm on July 10, 2016 brought the second-largest precipitation day
Estuarine Response in Northeastern Florida Bay to Major Hurricanes in 2005
 Estuarine Response in Northeastern Florida Bay to Major s in 25 By Jeff Woods and Mark Zucker s and tropical storms are critical components of the south Florida hydrologic cycle. These storms cause dramatic
Colorado State University, Fort Collins, CO Weather Station Monthly Summary Report
 Colorado State University, Fort Collins, CO Weather Station Monthly Summary Report Month: December Year: 2017 Temperature: Mean T max was 47.2 F which is 4.4 above the 1981-2010 normal for the month. This
Technical Paper ERA #431
 Technical Paper ERA #431 (for presentation at the World Environmental & Water Resources Congress 2006 ASCE Conference in Omaha, Nebraska, May 21 to 25, 2006) Hydrologic Impact of the 2004 Hurricane Season
The hydrologic service area (HSA) for this office covers Central Kentucky and South Central Indiana.
 for this office covers Central Kentucky and South Central Indiana.") January 2012 February 13, 2012 An X inside this box indicates that no flooding occurred within this hydrologic service area. January 2012 continued the string of wet months this winter. Rainfall was generally
January 2012 February 13, 2012 An X inside this box indicates that no flooding occurred within this hydrologic service area. January 2012 continued the string of wet months this winter. Rainfall was generally
The Pennsylvania Observer
 The Pennsylvania Observer April 2, 2010 March 2010 Pennsylvania Weather Recap Prepared by: Katelyn Johnson March did come in as a lion cub this year. The 1 st proved to be a calm day; however most of Pennsylvania
CLIMATOLOGICAL REPORT 2002
 Range Cattle Research and Education Center Research Report RC-2003-1 February 2003 CLIMATOLOGICAL REPORT 2002 Range Cattle Research and Education Center R. S. Kalmbacher Professor, IFAS, Range Cattle Research
Monthly Long Range Weather Commentary Issued: SEPTEMBER 19, 2016 Steven A. Root, CCM, Chief Analytics Officer, Sr. VP,
 Monthly Long Range Weather Commentary Issued: SEPTEMBER 19, 2016 Steven A. Root, CCM, Chief Analytics Officer, Sr. VP, sroot@weatherbank.com SEPTEMBER 2016 Climate Highlights The Month in Review The contiguous
E XTREME D ROUGHT An oppressive, long-term
 E XTREME D ROUGHT 2006-2008 An oppressive, long-term drought lasting from late March of 2006 until late August of 2008 impacted the entire state of Florida, with costly consequences in residential water
Monthly Long Range Weather Commentary Issued: February 15, 2015 Steven A. Root, CCM, President/CEO
 Monthly Long Range Weather Commentary Issued: February 15, 2015 Steven A. Root, CCM, President/CEO sroot@weatherbank.com JANUARY 2015 Climate Highlights The Month in Review During January, the average
Monthly Long Range Weather Commentary Issued: APRIL 1, 2015 Steven A. Root, CCM, President/CEO
 Monthly Long Range Weather Commentary Issued: APRIL 1, 2015 Steven A. Root, CCM, President/CEO sroot@weatherbank.com FEBRUARY 2015 Climate Highlights The Month in Review The February contiguous U.S. temperature
September 2018 Weather Summary West Central Research and Outreach Center Morris, MN
 September 2018 Weather Summary The mean temperature for September was 60.6 F, which is 1.5 F above the average of 59.1 F (1886-2017). The high temperature for the month was 94 F on September 16 th. The
Hurricane Wilma Post Storm Data Acquisition Estimated Peak Wind Analysis and Storm Tide Data. December 27, 2005
 Hurricane Wilma Post Storm Data Acquisition Estimated Peak Wind Analysis and Storm Tide Data December 27, 2005 Hurricane Wilma was the sixth major hurricane of the record-breaking 2005 Atlantic hurricane
Great Lakes Update. Volume 199: 2017 Annual Summary. Background
 Great Lakes Update Volume 199: 2017 Annual Summary Background The U.S. Army Corps of Engineers (USACE) tracks and forecasts the water levels of each of the Great Lakes. This report is primarily focused
MEMORANDUM. Jerry Conrow, Ojai Basin Groundwater Management Agency
 MEMORANDUM TO: FROM: Jerry Conrow, Ojai Basin Groundwater Management Agency Gregory Schnaar, PhD, Stephen J. Cullen, PhD, PG, DATE: August 6, 2014, 2014 SUBJECT: Ojai Basin Groundwater Model - Extended
Tropical Update. 5 PM EDT Thursday, September 7, 2017 Hurricane Irma, Hurricane Jose, and Hurricane Katia
 Tropical Update 5 PM EDT Thursday, September 7, 2017 Hurricane Irma, Hurricane Jose, and Hurricane Katia This update is intended for government and emergency response officials, and is provided for informational
Effect of El Niño Southern Oscillation (ENSO) on the number of leaching rain events in Florida and implications on nutrient management
 on the number of leaching rain events in Florida and implications on nutrient management") Effect of El Niño Southern Oscillation (ENSO) on the number of leaching rain events in Florida and implications on nutrient management C. Fraisse 1, Z. Hu 1, E. H. Simonne 2 May 21, 2008 Apopka, Florida
Effect of El Niño Southern Oscillation (ENSO) on the number of leaching rain events in Florida and implications on nutrient management C. Fraisse 1, Z. Hu 1, E. H. Simonne 2 May 21, 2008 Apopka, Florida
NWS FORM E-5 U.S. DEPARTMENT OF COMMERCE I HYDRO SERVICE AREA NOAA, NATIONAL WEATHER SERVICE I Indianapolis, IN MONTHLY REPORT
 NWS FORM E-5 U.S. DEPARTMENT OF COMMERCE I HYDRO SERVICE AREA NOAA, NATIONAL WEATHER SERVICE I Indianapolis, IN. 1-------------------- MONTHLY REPORT OF RIVER AND FLOOD CONDITIONSI REPORT FOR I November
Champaign-Urbana 1998 Annual Weather Summary
 Champaign-Urbana 1998 Annual Weather Summary ILLINOIS STATE WATER SURVEY Audrey Bryan, Weather Observer 2204 Griffith Dr. Champaign, IL 61820 wxobsrvr@sparc.sws.uiuc.edu The development of the El Nìno
Monthly Long Range Weather Commentary Issued: May 15, 2014 Steven A. Root, CCM, President/CEO
 Monthly Long Range Weather Commentary Issued: May 15, 2014 Steven A. Root, CCM, President/CEO sroot@weatherbank.com APRIL 2014 REVIEW Climate Highlights The Month in Review The average temperature for
REMARKS ON THE CLIl\lATE OF SOUTHERN FLORIDA!
 REMARKS ON THE CLIl\lATE OF SOUTHERN FLORIDA! ILI\10 HELA The Marine Laboratory, University of Miami ABSTRACT The climate of the State of Florida is discussed and the distribution of continentality analysed.
Monthly Long Range Weather Commentary Issued: July 18, 2014 Steven A. Root, CCM, President/CEO
 Monthly Long Range Weather Commentary Issued: July 18, 2014 Steven A. Root, CCM, President/CEO sroot@weatherbank.com JUNE 2014 REVIEW Climate Highlights The Month in Review The average temperature for
Rainfall Estimation at S-44 Site
 Technical Note EMA # 389 Rainfall Estimation at S-44 Site (January 2 "d, 3 rd, and 1 7 th, 1999 Events) March 1999 by Alaa Ali & Wossenu Abtew Hydro Information Systems and Assessment Department Environmental
PH YSIC A L PROPERT IE S TERC.UCDAVIS.EDU
 PH YSIC A L PROPERT IE S 8 Lake surface level Daily since 1900 Lake surface level varies throughout the year. Lake level rises due to high stream inflow, groundwater inflow and precipitation directly onto
Colorado State University, Fort Collins, CO Weather Station Monthly Summary Report
 Colorado State University, Fort Collins, CO Weather Station Monthly Summary Report Month: December Year: 2016 Temperature: Mean T max was 39.7 F which is 3.1 below the 1981-2010 normal for the month. This
2000 PROPERTY AND CASUALTY TARGET MARKET CONDUCT EXAMINATION VESTA INSURANCE CORPORATION THE FLORIDA DEPARTMENT OF INSURANCE
 2000 PROPERTY AND CASUALTY TARGET MARKET CONDUCT EXAMINATION OF VESTA INSURANCE CORPORATION BY THE FLORIDA DEPARTMENT OF INSURANCE Filed Date: 3-16-01 TABLE OF CONTENTS PART SUBJECT PAGE NUMBER I. INTRODUCTION
NATIONAL WEATHER SERVICE
 January 2016 February 9, 2016 This was a dry month across the HSA despite one large and several smaller snowfalls. Most locations ended up 1-2 inches below normal for the month. The driest locations at
2015: A YEAR IN REVIEW F.S. ANSLOW
 2015: A YEAR IN REVIEW F.S. ANSLOW 1 INTRODUCTION Recently, three of the major centres for global climate monitoring determined with high confidence that 2015 was the warmest year on record, globally.
Technical Memorandum. City of Salem, Stormwater Management Design Standards. Project No:
 Technical Memorandum 6500 SW Macadam Avenue, Suite 200 Portland, Oregon, 97239 Tel: 503-244-7005 Fax: 503-244-9095 Prepared for: Project Title: City of Salem, Oregon City of Salem, Stormwater Management
Champaign-Urbana 2001 Annual Weather Summary
 Champaign-Urbana 2001 Annual Weather Summary ILLINOIS STATE WATER SURVEY 2204 Griffith Dr. Champaign, IL 61820 wxobsrvr@sws.uiuc.edu Maria Peters, Weather Observer January: After a cold and snowy December,
Tropical Update. 12 PM EDT Friday, October 7, 2016 Hurricane Matthew & Tropical Storm Nicole
 Tropical Update 12 PM EDT Friday, October 7, 2016 Hurricane Matthew & Tropical Storm Nicole This update is intended for government and emergency response officials, and is provided for informational and
Drought in Southeast Colorado
 Drought in Southeast Colorado Nolan Doesken and Roger Pielke, Sr. Colorado Climate Center Prepared by Tara Green and Odie Bliss http://climate.atmos.colostate.edu 1 Historical Perspective on Drought Tourism
Thursday, February 20th Issued: 2:30pm CST
 Thursday, February 20th Issued: 2:30pm CST Prepared by: Victor Murphy/Brian Hoeth 817-978-1100 x 147 National Weather Service Southern Region Headquarters Regional Operations Center Fort Worth, TX Current
Great Lakes Update. Volume 188: 2012 Annual Summary
 Great Lakes Update Volume 188: 2012 Annual Summary Background The U.S. Army Corps of Engineers (USACE) tracks the water levels of each of the Great Lakes. This report highlights hydrologic conditions of
PRELIMINARY DRAFT FOR DISCUSSION PURPOSES
 Memorandum To: David Thompson From: John Haapala CC: Dan McDonald Bob Montgomery Date: February 24, 2003 File #: 1003551 Re: Lake Wenatchee Historic Water Levels, Operation Model, and Flood Operation This
Climate Change Impact on Air Temperature, Daily Temperature Range, Growing Degree Days, and Spring and Fall Frost Dates In Nebraska
 EXTENSION Know how. Know now. Climate Change Impact on Air Temperature, Daily Temperature Range, Growing Degree Days, and Spring and Fall Frost Dates In Nebraska EC715 Kari E. Skaggs, Research Associate
DROUGHT MONITORING BULLETIN
 DROUGHT MONITORING BULLETIN 24 th November 2014 Hot Spot Standardized Precipitation Index for time period from November 2013 to April 2014 was, due to the lack of precipitation for months, in major part
The hydrologic service area (HSA) for this office covers Central Kentucky and South Central Indiana.
 for this office covers Central Kentucky and South Central Indiana.") MONTH YEAR January 2011 February 15, 2011 X An X inside this box indicates that no flooding occurred within this hydrologic service area. January 2011 was drier than normal in all locations in the area.
MONTH YEAR January 2011 February 15, 2011 X An X inside this box indicates that no flooding occurred within this hydrologic service area. January 2011 was drier than normal in all locations in the area.
Upper Missouri River Basin December 2017 Calendar Year Runoff Forecast December 5, 2017
 Upper Missouri River Basin December 2017 Calendar Year Runoff Forecast December 5, 2017 Calendar Year Runoff Forecast Explanation and Purpose of Forecast U.S. Army Corps of Engineers, Northwestern Division
Climate Change and Climate Trends in Our Own Backyard
 Climate Change and Climate Trends in Our Own Backyard Dr. Mark Seeley Department of Soil, Water, and Climate University of Minnesota St Paul, MN 55108 For IATP: Rural Climate Dialogue Grand Rapids, MN
SEPTEMBER 2013 REVIEW
 Monthly Long Range Weather Commentary Issued: October 21, 2013 Steven A. Root, CCM, President/CEO sroot@weatherbank.com SEPTEMBER 2013 REVIEW Climate Highlights The Month in Review The average temperature
PHYSICAL PROPERTIES TAHOE.UCDAVIS.EDU 8
 PHYSICAL PROPERTIES 8 Lake surface level Daily since 1900 Lake surface level varies throughout the year. Lake level rises due to high stream inflow, groundwater inflow, and precipitation directly onto
2012 Growing Season Weather Summary for North Dakota. Adnan Akyüz and Barbara A. Mullins Department of Soil Science October 30, 2012
 2012 Growing Season Weather Summary for North Dakota Adnan Akyüz and Barbara A. Mullins Department of Soil Science October 30, 2012 Introduction The 2012 growing season (the period from April through September)
Great Lakes Update. Volume 194: 2015 Annual Summary
 Great Lakes Update Volume 194: 2015 Annual Summary Background The U.S. Army Corps of Engineers (USACE) tracks and forecasts the water levels of each of the Great Lakes. This report summarizes the hydrologic
The Pennsylvania Observer
 The Pennsylvania Observer April 2, 2009 March 2009 Pennsylvania Weather Recap Prepared by Curt Harpster For the month of March the saying, In like a lion and out like a lamb really fit the pattern quite
Long-term variation in Rainfall and its effect on Peace River Flow in West-Central Florida
 Long-term variation in Rainfall and its effect on Peace River Flow in West-Central Florida Hydrologic Evaluation Section Southwest Florida Water Management District July 2003 The Southwest Florida Water
8.1 Attachment 1: Ambient Weather Conditions at Jervoise Bay, Cockburn Sound
 8.1 Attachment 1: Ambient Weather Conditions at Jervoise Bay, Cockburn Sound Cockburn Sound is 20km south of the Perth-Fremantle area and has two features that are unique along Perth s metropolitan coast
2012 Growing Season. Niagara Report. Wayne Heinen
 2012 Growing Season Niagara Report Wayne Heinen Overview The 2012 growing season was a phenomenal one for grapes. Vines entered bud break in good shape following a mild winter. The spring of 2012 was similar
The Climate of Bryan County
 The Climate of Bryan County Bryan County is part of the Crosstimbers throughout most of the county. The extreme eastern portions of Bryan County are part of the Cypress Swamp and Forest. Average annual
Analysis of Historical Pattern of Rainfall in the Western Region of Bangladesh
 24 25 April 214, Asian University for Women, Bangladesh Analysis of Historical Pattern of Rainfall in the Western Region of Bangladesh Md. Tanvir Alam 1*, Tanni Sarker 2 1,2 Department of Civil Engineering,
Technical Notes: Magnitude and Return Period of 2004 Hurricane Rainfall in Florida
 Journal of Floodplain Management Floodplain Management Association NOV. 2005 Vol. 5, No. 1 Glenn Tootle 1 Thomas Mirti 2 Thomas Piechota 3 Technical Notes: Magnitude and Return Period of 2004 Hurricane
2016 Fall Conditions Report
 2016 Fall Conditions Report Prepared by: Hydrologic Forecast Centre Date: December 13, 2016 Table of Contents TABLE OF FIGURES... ii EXECUTIVE SUMMARY... 1 BACKGROUND... 5 SUMMER AND FALL PRECIPITATION...
2011 National Seasonal Assessment Workshop for the Eastern, Southern, & Southwest Geographic Areas
 2011 National Seasonal Assessment Workshop for the Eastern, Southern, & Southwest Geographic Areas On January 11-13, 2011, wildland fire, weather, and climate met virtually for the ninth annual National
David R. Vallee Hydrologist-in-Charge NOAA/NWS Northeast River Forecast Center
 David R. Vallee Hydrologist-in-Charge NOAA/NWS Northeast River Forecast Center Record flooding along the Shawsheen River during the 2006 Mother s Day Floods Calibrate and implement a variety of hydrologic
March 1, 2003 Western Snowpack Conditions and Water Supply Forecasts
 Natural Resources Conservation Service National Water and Climate Center 101 SW Main Street, Suite 1600 Portland, OR 97204-3224 Date: March 17, 2003 Subject: March 1, 2003 Western Snowpack Conditions and
WEATHER ON WHEELS Elementary School Program
 WEATHER ON WHEELS Elementary School Program MAST ACADEMY OUTREACH On-Site Packet Miami-Dade County Public Schools Miami, Florida MAST ACADEMY OUTREACH WEATHER ON WHEELS ELEMENTARY ON-SITE HIGHLIGHTS PACKET
but 2012 was dry Most farmers pulled in a crop
 After a winter that wasn t, conditions late in the year pointed to a return to normal snow and cold conditions Most farmers pulled in a crop but 2012 was dry b y M i k e Wr o b l e w s k i, w e a t h e
A Report on a Statistical Model to Forecast Seasonal Inflows to Cowichan Lake
 A Report on a Statistical Model to Forecast Seasonal Inflows to Cowichan Lake Prepared by: Allan Chapman, MSc, PGeo Hydrologist, Chapman Geoscience Ltd., and Former Head, BC River Forecast Centre Victoria
A COMPARATIVE STUDY OF OKLAHOMA'S PRECIPITATION REGIME FOR TWO EXTENDED TIME PERIODS BY USE OF EIGENVECTORS
 85 A COMPARATIVE STUDY OF OKLAHOMA'S PRECIPITATION REGIME FOR TWO EXTENDED TIME PERIODS BY USE OF EIGENVECTORS Elias Johnson Department of Geography, Southwest Missouri State University, Springfield, MO
NOAA National Centers for Environmental Information State Summaries 149-FL. Observed and Projected Temperature Change
 19-FL FLORIDA Key Messages Under a higher emissions pathway, historically unprecedented warming is projected by the end of the 1st century. Rising temperatures will likely increase the intensity of naturally-occurring
Memo. I. Executive Summary. II. ALERT Data Source. III. General System-Wide Reporting Summary. Date: January 26, 2009 To: From: Subject:
 Memo Date: January 26, 2009 To: From: Subject: Kevin Stewart Markus Ritsch 2010 Annual Legacy ALERT Data Analysis Summary Report I. Executive Summary The Urban Drainage and Flood Control District (District)
Drought News August 2014
 European Drought Observatory (EDO) Drought News August 2014 (Based on data until the end of July) http://edo.jrc.ec.europa.eu August 2014 EDO (http://edo.jrc.ec.europa.eu) Page 2 of 8 EDO Drought News
Monthly Long Range Weather Commentary Issued: APRIL 18, 2017 Steven A. Root, CCM, Chief Analytics Officer, Sr. VP,
 Monthly Long Range Weather Commentary Issued: APRIL 18, 2017 Steven A. Root, CCM, Chief Analytics Officer, Sr. VP, sroot@weatherbank.com MARCH 2017 Climate Highlights The Month in Review The average contiguous
Current Climate Trends and Implications
 Current Climate Trends and Implications Dr. Mark Seeley Professor emeritus Department of Soil, Water, and Climate University of Minnesota St Paul, MN 55108 Crop Insurance Conference September 12, 2018
Tropical Update 6 AM EDT Friday, October 7, 2016 Hurricane Matthew & Hurricane Nicole
 Tropical Update 6 AM EDT Friday, October 7, 2016 Hurricane Matthew & Hurricane Nicole This update is intended for government and emergency response officials, and is provided for informational and situational
National Wildland Significant Fire Potential Outlook
 National Wildland Significant Fire Potential Outlook National Interagency Fire Center Predictive Services Issued: September, 2007 Wildland Fire Outlook September through December 2007 Significant fire
The Climate of Payne County
 The Climate of Payne County Payne County is part of the Central Great Plains in the west, encompassing some of the best agricultural land in Oklahoma. Payne County is also part of the Crosstimbers in the
Climate Change and Climate Trends in Our Own Backyard
 Climate Change and Climate Trends in Our Own Backyard Dr. Mark Seeley Department of Soil, Water, and Climate University of Minnesota St Paul, MN 55108 For IATP: Winona Rural Climate Dialogue Citizen Jury
Range Cattle Research and Education Center January CLIMATOLOGICAL REPORT 2016 Range Cattle Research and Education Center.
 1 Range Cattle Research and Education Center January 2017 Research Report RC-2017-1 CLIMATOLOGICAL REPORT 2016 Range Cattle Research and Education Center Brent Sellers Weather conditions strongly influence
Monthly Long Range Weather Commentary Issued: APRIL 25, 2016 Steven A. Root, CCM, Chief Analytics Officer, Sr. VP, sales
 Monthly Long Range Weather Commentary Issued: APRIL 25, 2016 Steven A. Root, CCM, Chief Analytics Officer, Sr. VP, sales sroot@weatherbank.com MARCH 2016 Climate Highlights The Month in Review The March
1. TEMPORAL CHANGES IN HEAVY RAINFALL FREQUENCIES IN ILLINOIS
 to users of heavy rainstorm climatology in the design and operation of water control structures. A summary and conclusions pertaining to various phases of the present study are included in Section 8. Point
The Climate of Kiowa County
 The Climate of Kiowa County Kiowa County is part of the Central Great Plains, encompassing some of the best agricultural land in Oklahoma. Average annual precipitation ranges from about 24 inches in northwestern
Water Management and Hydrology of Northeast Shark River Slough from 1940 to 2015
 Water Management and Hydrology of Northeast Shark River Slough from 1940 to 2015 Greater Everglades Ecosystem Restoration Conference April 2015 Kevin Kotun, Hydrologist Physical Resources Branch South
2015 Fall Conditions Report
 2015 Fall Conditions Report Prepared by: Hydrologic Forecast Centre Date: December 21 st, 2015 Table of Contents Table of Figures... ii EXECUTIVE SUMMARY... 1 BACKGROUND... 2 SUMMER AND FALL PRECIPITATION...
Chapter 1 Study Guide
 Chapter 1 Study Guide Reminders: Vocabulary quiz and test will be on Tuesday, September 6th. Complete study guide and bring completed to school Friday, September 2nd. You are NOT required to print the
January 2011 Calendar Year Runoff Forecast
 January 2011 Calendar Year Runoff Forecast 2010 Runoff Year Calendar Year 2010 was the third highest year of runoff in the Missouri River Basin above Sioux City with 38.8 MAF, behind 1978 and 1997 which
FMEL Arboviral Epidemic Risk Assessment: Second Update for 2012 Week 23 (June 12, 2012)
") FMEL Arboviral Epidemic Risk Assessment: Second Update for 2012 Week 23 (June 12, 2012) Current Assesment of SLW\WN Epidemic Risk Figure 1. A map of peninsular Florida indicating areas currently at Medium
FMEL Arboviral Epidemic Risk Assessment: Second Update for 2012 Week 23 (June 12, 2012) Current Assesment of SLW\WN Epidemic Risk Figure 1. A map of peninsular Florida indicating areas currently at Medium
NIDIS Intermountain West Drought Early Warning System April 18, 2017
 1 of 11 4/18/2017 3:42 PM Precipitation NIDIS Intermountain West Drought Early Warning System April 18, 2017 The images above use daily precipitation statistics from NWS COOP, CoCoRaHS, and CoAgMet stations.
2017 Fall Conditions Report
 2017 Fall Conditions Report Prepared by: Hydrologic Forecast Centre Date: November 15, 2017 Table of Contents TABLE OF FIGURES... ii EXECUTIVE SUMMARY... 1 BACKGROUND... 4 SUMMER AND FALL PRECIPITATION...
The Climate of Texas County
 The Climate of Texas County Texas County is part of the Western High Plains in the north and west and the Southwestern Tablelands in the east. The Western High Plains are characterized by abundant cropland
The Pennsylvania Observer
 The Pennsylvania Observer October 1, 2015 September 2015 - Pennsylvania Weather Recap By: Quinn Lease The month of September will be remembered for its above normal temperatures and dry conditions that
Long Time Forecasts of Ohio River Floods
 The Ohio State University Knowledge Bank kb.osu.edu Ohio Journal of Science (Ohio Academy of Science) Ohio Journal of Science: Volume 39, Issue 4 (July, 1939) 1939-07 Long Time Forecasts of Ohio River
NIDIS Intermountain West Drought Early Warning System December 30, 2018
 1/2/2019 NIDIS Drought and Water Assessment NIDIS Intermountain West Drought Early Warning System December 30, 2018 Precipitation The images above use daily precipitation statistics from NWS COOP, CoCoRaHS,
Above normal temperatures and precipitation continue across the HSA
 NWS Form E-5 (PRES. BY NWS Instruction 10-924) MONTHLY REPORT OF HYDROLOGIC CONDITIONS HYDROLOGIC SERVICE AREA (HSA) MONTH YEAR TO: Hydrologic Information Center, W/OS31 NOAA s National Weather Service
Climate Variability and El Niño
 Climate Variability and El Niño David F. Zierden Florida State Climatologist Center for Ocean Atmospheric Prediction Studies The Florida State University UF IFAS Extenstion IST January 17, 2017 The El