Climate Change and Climate Trends in Our Own Backyard
|
|
|
- Shawn Pearson
- 5 years ago
- Views:
Transcription


1 Climate Change and Climate Trends in Our Own Backyard Dr. Mark Seeley Department of Soil, Water, and Climate University of Minnesota St Paul, MN For IATP: Winona Rural Climate Dialogue Citizen Jury Winona, MN March 3, 2016
 Mar 3, 1905")
")


2 71 degrees F at Milan, MN (Chippewa County) Mar 3, 1905 No snow cover -44 degrees F at Embarrass, MN (St Louis County) Mar 3, snow on the ground Lake Superior 97% ice covered Mar3, of snowfall at Benson, MN (Swift County) Mar 3, 1985


3 Minnesota weather and climate history IPCC 5 th Assessment National Climate Assessment 2014 Information Resources Used NOAA Climate Monitoring and Global and National Assessment Divisions (climate.gov) AASC (stateclimate.org)

4 Disparity in the pace of climate change and the response to it

5 Geographic Disparity in Precipitation Change-IPCC 2013

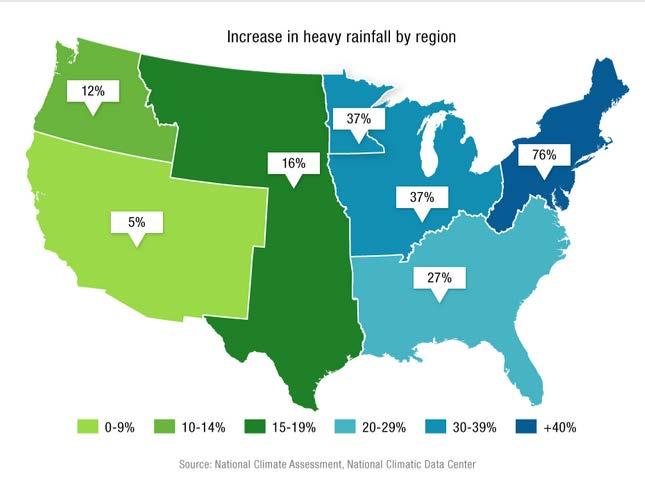
6 RECENT SIGNIFICANT CLIMATE TRENDS IN MINNESOTA AND THE WESTERN GREAT LAKES TEMPERATURE: WARM WINTERS AND HIGHER MINIMUM TEMPERATURES DEWPOINTS: GREATER FREQUENCY OF TROPICAL-LIKE ATMOSPHERIC WATER VAPOR MOISTURE: AMPLIFIED PRECIPITATION SIGNAL, THUNDERSTORM CONTRIBUTION
 and more frequently near")
7 Temp trend is upward (about 2 F per century) and more frequently near historical warmth

8 Trend in annual temperature for southeastern MN Upward by about 1 F per century


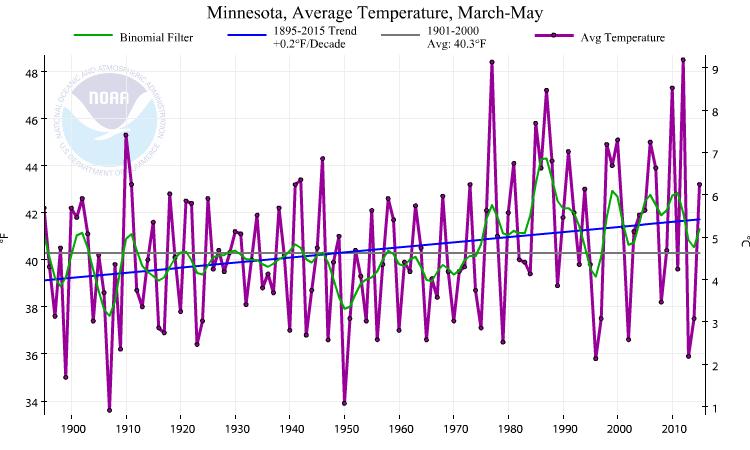
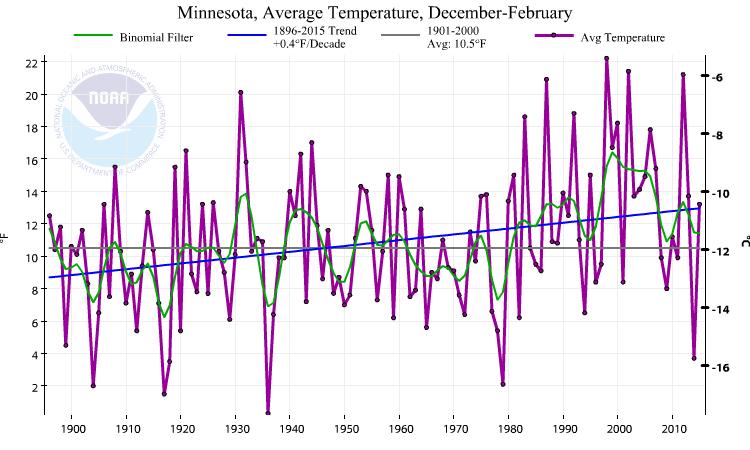
9 Winter Spring Seasonal Statewide Temperature Trends in MN Summer Fall

10 Trends in mean monthly temperatures at Winona, MN normals vs normals (F) Month Min Change Max Change Mean Change January February March April May +1.7 NC +0.8 June July August September October November December
11 8.0 Minnesota State-Averaged Temperature Trends degrees F per century January February March April May June July August September October November December Annual Maximum Temperature Trend Minimum Temperature Trend Difference (Max minus Min)

12 Trend in episodes of dewpoints of 70 F or higher Latitude 45 degrees Hours with dewpoints of 70 degrees F or higher at Voyageurs National Park Latitude 48.5 degrees
13 Dewpoint Temperatures Greater than or equal to 80 degrees F Since or more days - at least one day DP 80 F or higher. Readings have been statewide with highest frequencies in central and southern counties State Climatology Office - DNR Waters

14 Frequencies of tropical-like dew points (70 F or higher) and associated Heat Index values for the Twin Cities since 1945 Year Hours with DP of Range of Heat 70 F or greater Index Values (F) (*134)

15 July 19-20, 2011 Heat Wave Heat Index: 112 F Faribault 114 F Mankato 114 F New Ulm 114 F Waseca 117 F Owatonna 118 F Red Wing 110 F Albert Lea 114 F St James 114 F Fairmount 121 F Austin 134 F Moorhead

16 Historical Minnesota Heat Waves: Red denotes dewpoint driven 1883, 1894, 1901, 1910, 1917, 1921, 1931, 1933, 1934, 1936, 1937, 1947, 1948, 1949, 1955, 1957, 1959, 1964, 1976, 1977, 1983, 1988, 1995,1999, 2001, 2005, 2006, 2007, 2010, 2011, 2012, 2013, 2014 (pattern is episodic but increasing in frequency)

17 Trend in annual precipitation for MN Upward by 2.60 per century
")
")

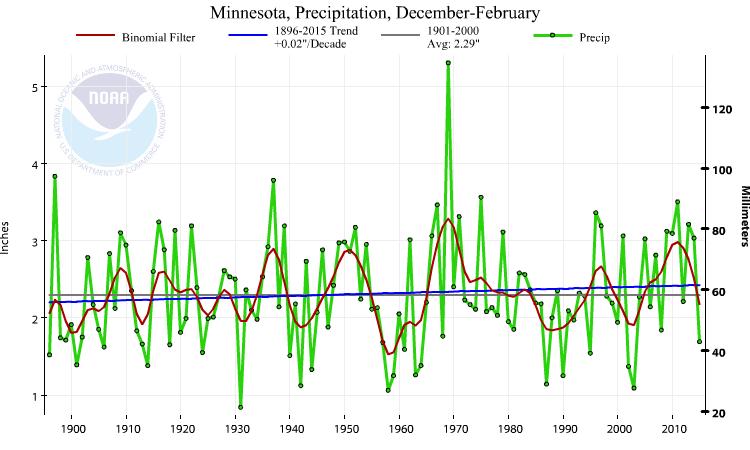
18 Winter (D,J,F) Spring (M,A,M) Seasonal Trends in MN Precipitation Summer (J,J,A) Fall (S,O,N)


19 Annual precipitation trend in SE-Minnesota Upward by 4.40 inches per century

20 Change in Annual Precipitation Normals at Winona, MN PERIOD AMOUNT (IN.) percent increase since period
21
 Albert Lea 49 7.50 (6/15/1978) Waseca 54 5.")
22 Historical recurrence interval of 2 inch rains in southern and eastern MN was calculated to be once per year. This is no longer the case. Observed 2 inch rainfalls for the period and maximum single day value for various communities: Location No. 2 in. rains Maximum Value (date) Albert Lea (6/15/1978) Waseca (9/23/2010) Winnebago (9/25/2005) Owatonna (8/19/2007) Amboy (9/23/2010) Windom (9/23/2010) Fairmont (9/15/2004) Blue Earth (6/15/1978) Bricelyn (9/14/2004) Winona (8/19/2007)

23 June 2014 Wettest month in history on a statewide basis Hawley International Falls Kabetogama Granite Falls Belle Plaine Glencoe MSP Luverne Redwood Falls Waseca Rushford 12.76

24 Historic Droughts (Associated fires) 1829, 1852, , , 1896, 1900, 1910, 1918, , , , 1948, , 1961, 1976, 1980, 1984, 1987, 1988, 1997, , , 2010, 2011, 2012, 2013

25 MN Counties designated for federal disaster assistance in 2012 All are associated with drought except those with Which designates for flood or severe storm

26 Radiosonde history of PW at MSP since 1948 (Most record high values have occurred since 1990)
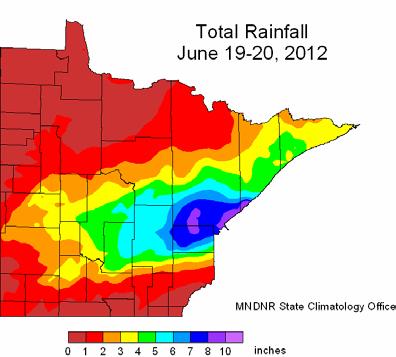
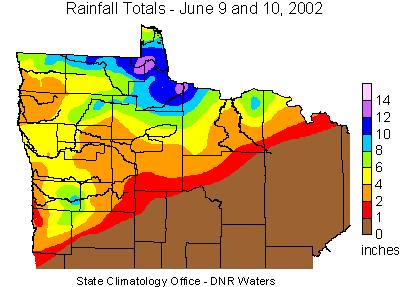
27 Observations Minnesota Trends Minnesota Mega-rain Events August 6, 1866, Southern Minnesota July , Central Minnesota July 20-22, 1909, Northern Minnesota September 9-10, 1947 Iron Range July 21-22, 1972, Grand Daddy Flash Flood June 28-29, 1975, Northwest Minnesota July 23-24, 1987, Twin Cities Superstorm June 9-10, 2002, Northern Minnesota September 14-15, 2004 Southern Minnesota August 18-20, 2007, Southern Minnesota September 22-23, 2010 Southern Minnesota June 19-20, 2012, Northeast Minnesota *Defined as 6 or greater rains cover at least 1000 square miles and a peak amount of 8 or greater
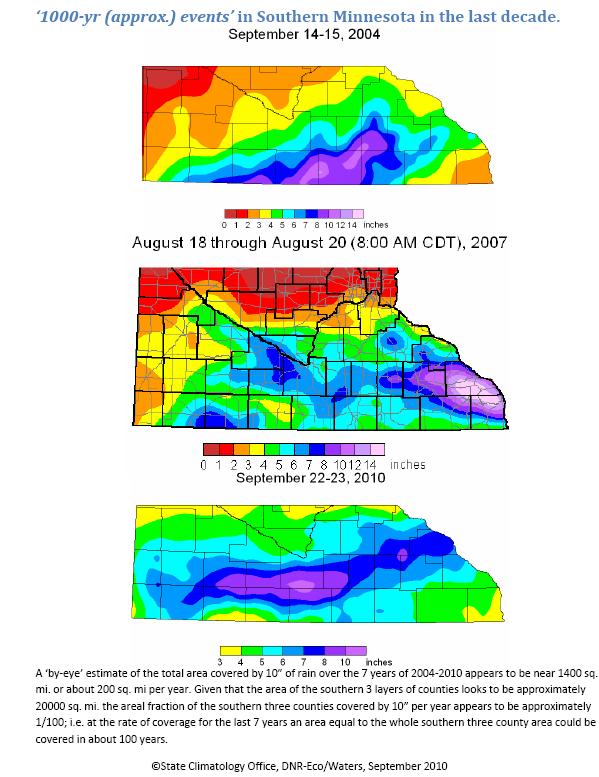
28 Shift in Precipitation Recurrence Intervals Mega Rains since 2002
 Modified fisheries management Mitigation of flooding potential Longer growing season, shift in Plant Hardiness Zones Change in biological")
29 Consequences Observed and Associated with Climate Change in Minnesota and the western Great Lakes Adjustments to storm sewer systems, irrigation, drainage, runoff, sediment, and shoreline management Adjustments in public health (Heat Waves, allergy season) Modified fisheries management Mitigation of flooding potential Longer growing season, shift in Plant Hardiness Zones Change in biological organisms (pathogens, pests, microbes) Change in animal migration, hibernation, and foraging Change in frequency and magnitude of insured losses Change in drought and fire weather frequencies Increased use of air conditioning Amplified variability of watershed volume flows


30 Rabbits in the sky A Poodle in the sky Our state climate database indicates that many attributes of our environment are changing some changes are evident in the measurement of averages, variability, and extremes.and further these changes are having observable consequences. It is clearly poor judgment to ignore this! Snail in the sky Pig in the sky
Climate Change and Climate Trends in Our Own Backyard
 Climate Change and Climate Trends in Our Own Backyard Dr. Mark Seeley Department of Soil, Water, and Climate University of Minnesota St Paul, MN 55108 For IATP: Rural Climate Dialogue Grand Rapids, MN
Current Climate Trends and Implications
 Current Climate Trends and Implications Dr. Mark Seeley Professor emeritus Department of Soil, Water, and Climate University of Minnesota St Paul, MN 55108 Crop Insurance Conference September 12, 2018
Minnesota s Changing Climate: Winter Impacts
 Minnesota s Changing Climate: Winter Impacts Dr. Mark Seeley Climatologist/Meteorologist Dept of Soil, Water, and Climate University of Minnesota 15 th Annual Road Salt Symposium Minnesota Landscape Arboretum
Dr. Mark Seeley Dept of Soil, Water, and Climate University of Minnesota Clean Water and Climate Adaptation Summit University of Minnesota Landscape
 Climate Change in Minnesota: Current Trends and Projections Dr. Mark Seeley Dept of Soil, Water, and Climate University of Minnesota Clean Water and Climate Adaptation Summit University of Minnesota Landscape
Minnesota s Climatic Conditions, Outlook, and Impacts on Agriculture. Today. 1. The weather and climate of 2017 to date
 Minnesota s Climatic Conditions, Outlook, and Impacts on Agriculture Kenny Blumenfeld, State Climatology Office Crop Insurance Conference, Sep 13, 2017 Today 1. The weather and climate of 2017 to date
The Climate of Marshall County
 The Climate of Marshall County Marshall County is part of the Crosstimbers. This region is a transition region from the Central Great Plains to the more irregular terrain of southeastern Oklahoma. Average
The Climate of Seminole County
 The Climate of Seminole County Seminole County is part of the Crosstimbers. This region is a transition region from the Central Great Plains to the more irregular terrain of southeastern Oklahoma. Average
January 25, Summary
 January 25, 2013 Summary Precipitation since the December 17, 2012, Drought Update has been slightly below average in parts of central and northern Illinois and above average in southern Illinois. Soil
The Climate of Murray County
 The Climate of Murray County Murray County is part of the Crosstimbers. This region is a transition between prairies and the mountains of southeastern Oklahoma. Average annual precipitation ranges from
Monthly Long Range Weather Commentary Issued: February 15, 2015 Steven A. Root, CCM, President/CEO
 Monthly Long Range Weather Commentary Issued: February 15, 2015 Steven A. Root, CCM, President/CEO sroot@weatherbank.com JANUARY 2015 Climate Highlights The Month in Review During January, the average
Illinois Drought Update, December 1, 2005 DROUGHT RESPONSE TASK FORCE Illinois State Water Survey, Department of Natural Resources
 Illinois Drought Update, December 1, 2005 DROUGHT RESPONSE TASK FORCE Illinois State Water Survey, Department of Natural Resources For more drought information please go to http://www.sws.uiuc.edu/. SUMMARY.
The Climate of Bryan County
 The Climate of Bryan County Bryan County is part of the Crosstimbers throughout most of the county. The extreme eastern portions of Bryan County are part of the Cypress Swamp and Forest. Average annual
Monthly Long Range Weather Commentary Issued: APRIL 1, 2015 Steven A. Root, CCM, President/CEO
 Monthly Long Range Weather Commentary Issued: APRIL 1, 2015 Steven A. Root, CCM, President/CEO sroot@weatherbank.com FEBRUARY 2015 Climate Highlights The Month in Review The February contiguous U.S. temperature
Climate Change and Stormwater. Daniel Brown, Research Associate, GLISA
 Climate Change and Stormwater Daniel Brown, Research Associate, GLISA Global Trends and Regional Trends Global trends are more certain than regional trends. Natural variability plays a larger role at the
The Climate of Texas County
 The Climate of Texas County Texas County is part of the Western High Plains in the north and west and the Southwestern Tablelands in the east. The Western High Plains are characterized by abundant cropland
Upper Missouri River Basin February 2018 Calendar Year Runoff Forecast February 6, 2018
 Upper Missouri River Basin February 2018 Calendar Year Runoff Forecast February 6, 2018 Calendar Year Runoff Forecast Explanation and Purpose of Forecast U.S. Army Corps of Engineers, Northwestern Division
The Climate of Pontotoc County
 The Climate of Pontotoc County Pontotoc County is part of the Crosstimbers. This region is a transition region from the Central Great Plains to the more irregular terrain of southeast Oklahoma. Average
chapter one climatology
 chapter one Precipitation Observer Network June 2002 (1467 Observers) May 2003 Introduction The DNR Waters State Climatology Office exists to gather and analyze climate data for the benefit of the State
The Climate of Grady County
 The Climate of Grady County Grady County is part of the Central Great Plains, encompassing some of the best agricultural land in Oklahoma. Average annual precipitation ranges from about 33 inches in northern
The Climate of Payne County
 The Climate of Payne County Payne County is part of the Central Great Plains in the west, encompassing some of the best agricultural land in Oklahoma. Payne County is also part of the Crosstimbers in the
Upper Missouri River Basin December 2017 Calendar Year Runoff Forecast December 5, 2017
 Upper Missouri River Basin December 2017 Calendar Year Runoff Forecast December 5, 2017 Calendar Year Runoff Forecast Explanation and Purpose of Forecast U.S. Army Corps of Engineers, Northwestern Division
Climate Change Impact on Air Temperature, Daily Temperature Range, Growing Degree Days, and Spring and Fall Frost Dates In Nebraska
 EXTENSION Know how. Know now. Climate Change Impact on Air Temperature, Daily Temperature Range, Growing Degree Days, and Spring and Fall Frost Dates In Nebraska EC715 Kari E. Skaggs, Research Associate
The Climate of Haskell County
 The Climate of Haskell County Haskell County is part of the Hardwood Forest. The Hardwood Forest is characterized by its irregular landscape and the largest lake in Oklahoma, Lake Eufaula. Average annual
Oregon Water Conditions Report April 17, 2017
 Oregon Water Conditions Report April 17, 2017 Mountain snowpack continues to maintain significant levels for mid-april. By late March, statewide snowpack had declined to 118 percent of normal after starting
The Climate of Kiowa County
 The Climate of Kiowa County Kiowa County is part of the Central Great Plains, encompassing some of the best agricultural land in Oklahoma. Average annual precipitation ranges from about 24 inches in northwestern
Monthly Long Range Weather Commentary Issued: May 15, 2014 Steven A. Root, CCM, President/CEO
 Monthly Long Range Weather Commentary Issued: May 15, 2014 Steven A. Root, CCM, President/CEO sroot@weatherbank.com APRIL 2014 REVIEW Climate Highlights The Month in Review The average temperature for
Oregon Water Conditions Report May 1, 2017
 Oregon Water Conditions Report May 1, 2017 Mountain snowpack in the higher elevations has continued to increase over the last two weeks. Statewide, most low and mid elevation snow has melted so the basin
David R. Vallee Hydrologist-in-Charge NOAA/NWS Northeast River Forecast Center
 David R. Vallee Hydrologist-in-Charge NOAA/NWS Northeast River Forecast Center Record flooding along the Shawsheen River during the 2006 Mother s Day Floods Calibrate and implement a variety of hydrologic
Sierra Weather and Climate Update
 Sierra Weather and Climate Update 2014-15 Kelly Redmond Western Regional Climate Center Desert Research Institute Reno Nevada Yosemite Hydroclimate Workshop Yosemite Valley, 2015 October 8-9 Percent of
Monthly Long Range Weather Commentary Issued: APRIL 18, 2017 Steven A. Root, CCM, Chief Analytics Officer, Sr. VP,
 Monthly Long Range Weather Commentary Issued: APRIL 18, 2017 Steven A. Root, CCM, Chief Analytics Officer, Sr. VP, sroot@weatherbank.com MARCH 2017 Climate Highlights The Month in Review The average contiguous
2011 Year in Review TORNADOES
 2011 Year in Review The year 2011 had weather events that will be remembered for a long time. Two significant tornado outbreaks in April, widespread damage and power outages from Hurricane Irene in August
Monthly Long Range Weather Commentary Issued: APRIL 25, 2016 Steven A. Root, CCM, Chief Analytics Officer, Sr. VP, sales
 Monthly Long Range Weather Commentary Issued: APRIL 25, 2016 Steven A. Root, CCM, Chief Analytics Officer, Sr. VP, sales sroot@weatherbank.com MARCH 2016 Climate Highlights The Month in Review The March
Monthly Long Range Weather Commentary Issued: NOVEMBER 16, 2015 Steven A. Root, CCM, Chief Analytics Officer, Sr. VP, sales
 Monthly Long Range Weather Commentary Issued: NOVEMBER 16, 2015 Steven A. Root, CCM, Chief Analytics Officer, Sr. VP, sales sroot@weatherbank.com OCTOBER 2015 Climate Highlights The Month in Review The
Champaign-Urbana 1998 Annual Weather Summary
 Champaign-Urbana 1998 Annual Weather Summary ILLINOIS STATE WATER SURVEY Audrey Bryan, Weather Observer 2204 Griffith Dr. Champaign, IL 61820 wxobsrvr@sparc.sws.uiuc.edu The development of the El Nìno
Historical and Projected Future Climatic Trends in the Great Lakes Region
 Historical and Projected Future Climatic Trends in the Great Lakes Region Jeffrey A. Andresen Dept. of Geography, Environment, and Spatial Sciences Michigan State University Flooding along I-696 Warren,
but 2012 was dry Most farmers pulled in a crop
 After a winter that wasn t, conditions late in the year pointed to a return to normal snow and cold conditions Most farmers pulled in a crop but 2012 was dry b y M i k e Wr o b l e w s k i, w e a t h e
Great Plains and Midwest Climate Outlook February 18, 2016
 Great Plains and Midwest Climate Outlook February 18, 2016 Dr. Jim Angel State Climatologist Illinois State Water Survey University of Illinois jimangel@illinois.edu General Information Providing climate
Monthly Long Range Weather Commentary Issued: SEPTEMBER 19, 2015 Steven A. Root, CCM, Chief Analytics Officer, Sr. VP, sales
 Monthly Long Range Weather Commentary Issued: SEPTEMBER 19, 2015 Steven A. Root, CCM, Chief Analytics Officer, Sr. VP, sales sroot@weatherbank.com AUGUST 2015 Climate Highlights The Month in Review The
Highlights of the 2006 Water Year in Colorado
 Highlights of the 2006 Water Year in Colorado Nolan Doesken, State Climatologist Atmospheric Science Department Colorado State University http://ccc.atmos.colostate.edu Presented to 61 st Annual Meeting
MGC September Webinar Taking Climate Action September 22, 2016
 MGC September Webinar Taking Climate Action September 22, 2016 Today s Agenda Presentations B.J. Baule, Great Lakes Integrated Sciences and Assessments Kate Madigan, Michigan Environmental Council/Michigan
Annex I to Target Area Assessments
 Baltic Challenges and Chances for local and regional development generated by Climate Change Annex I to Target Area Assessments Climate Change Support Material (Climate Change Scenarios) SWEDEN September
5.2 IDENTIFICATION OF HAZARDS OF CONCERN
 5.2 IDENTIFICATION OF HAZARDS OF CONCERN 2016 HMP Update Changes The 2011 HMP hazard identification was presented in Section 3. For the 2016 HMP update, the hazard identification is presented in subsection
November 2018 Weather Summary West Central Research and Outreach Center Morris, MN
 November 2018 Weather Summary Lower than normal temperatures occurred for the second month. The mean temperature for November was 22.7 F, which is 7.2 F below the average of 29.9 F (1886-2017). This November
Champaign-Urbana 2001 Annual Weather Summary
 Champaign-Urbana 2001 Annual Weather Summary ILLINOIS STATE WATER SURVEY 2204 Griffith Dr. Champaign, IL 61820 wxobsrvr@sws.uiuc.edu Maria Peters, Weather Observer January: After a cold and snowy December,
2014 Annual Mitigation Plan Review Meeting
 2014 Annual Mitigation Plan Review Meeting Highland County EMA MEETING OBJECTIVES Understand Your Natural Disaster Risk Review of Previous Plans Current Plan Status Future Activity Plan/Needs of Each Community
NWS FORM E-5 U.S. DEPARTMENT OF COMMERCE I HYDRO SERVICE AREA NOAA, NATIONAL WEATHER SERVICE I Indianapolis, IN MONTHLY REPORT
 NWS FORM E-5 U.S. DEPARTMENT OF COMMERCE I HYDRO SERVICE AREA NOAA, NATIONAL WEATHER SERVICE I Indianapolis, IN. 1-------------------- MONTHLY REPORT OF RIVER AND FLOOD CONDITIONSI REPORT FOR I November
Climate. Annual Temperature (Last 30 Years) January Temperature. July Temperature. Average Precipitation (Last 30 Years)
 January Temperature. July Temperature. Average Precipitation (Last 30 Years)") Climate Annual Temperature (Last 30 Years) Average Annual High Temp. (F)70, (C)21 Average Annual Low Temp. (F)43, (C)6 January Temperature Average January High Temp. (F)48, (C)9 Average January Low Temp.
Climate Annual Temperature (Last 30 Years) Average Annual High Temp. (F)70, (C)21 Average Annual Low Temp. (F)43, (C)6 January Temperature Average January High Temp. (F)48, (C)9 Average January Low Temp.
UPPLEMENT A COMPARISON OF THE EARLY TWENTY-FIRST CENTURY DROUGHT IN THE UNITED STATES TO THE 1930S AND 1950S DROUGHT EPISODES
 UPPLEMENT A COMPARISON OF THE EARLY TWENTY-FIRST CENTURY DROUGHT IN THE UNITED STATES TO THE 1930S AND 1950S DROUGHT EPISODES Richard R. Heim Jr. This document is a supplement to A Comparison of the Early
DEPARTMENT OF EARTH & CLIMATE SCIENCES Name SAN FRANCISCO STATE UNIVERSITY Nov 29, ERTH 360 Test #2 200 pts
 DEPARTMENT OF EARTH & CLIMATE SCIENCES Name SAN FRANCISCO STATE UNIVERSITY Nov 29, 2018 ERTH 360 Test #2 200 pts Each question is worth 4 points. Indicate your BEST CHOICE for each question on the Scantron
1.4 USEFULNESS OF RECENT NOAA/CPC SEASONAL TEMPERATURE FORECASTS
 1.4 USEFULNESS OF RECENT NOAA/CPC SEASONAL TEMPERATURE FORECASTS Jeanne M. Schneider* and Jurgen D. Garbrecht USDA/ARS Grazinglands Research Laboratory, El Reno, Oklahoma 1. INTRODUCTION Operational climate
Monthly Long Range Weather Commentary Issued: SEPTEMBER 19, 2016 Steven A. Root, CCM, Chief Analytics Officer, Sr. VP,
 Monthly Long Range Weather Commentary Issued: SEPTEMBER 19, 2016 Steven A. Root, CCM, Chief Analytics Officer, Sr. VP, sroot@weatherbank.com SEPTEMBER 2016 Climate Highlights The Month in Review The contiguous
Satellites, Weather and Climate Module 40: Agriculture & forestry in a changing climate
 Satellites, Weather and Climate Module 40: Agriculture & forestry in a changing climate http://www.youtube.com/watch?v=ksnblyhrru8 http://1.bp.blogspot.com/-lemica8b_h4/ufln63qlxdi/aaaaaaaacym/xc3htckubeg/s1600/animated.gif
5.2 IDENTIFICATION OF HAZARDS OF CONCERN
 5.2 IDENTIFICATION OF HAZARDS OF CONCERN 2015 HMP Update Changes The 2010 HMP hazard identification was presented in Section 6. For the 2015 HMP update, the hazard identification is presented in subsection
Regional Precipitation and ET Patterns: Impacts on Agricultural Water Management
 Regional Precipitation and ET Patterns: Impacts on Agricultural Water Management Christopher H. Hay, PhD, PE Ag. and Biosystems Engineering South Dakota State University 23 November 2010 Photo: USDA-ARS
Champaign-Urbana 1999 Annual Weather Summary
 Champaign-Urbana 1999 Annual Weather Summary ILLINOIS STATE WATER SURVEY 2204 Griffith Dr. Champaign, IL 61820 wxobsrvr@sws.uiuc.edu Maria Peters, Weather Observer A major snowstorm kicked off the new
Climate Vulnerability Assessment (CVA) Localized Flooding & Extreme Heat Update
 Localized Flooding & Extreme Heat Update") Climate Vulnerability Assessment (CVA) Localized Flooding & Extreme Heat Update Metropolitan Council Land Use Advisory Committee 09/20/2018 Climate Vulnerability Assessment - Recap July 21, 2016 LUAC Presentation
Climate Vulnerability Assessment (CVA) Localized Flooding & Extreme Heat Update Metropolitan Council Land Use Advisory Committee 09/20/2018 Climate Vulnerability Assessment - Recap July 21, 2016 LUAC Presentation
State Water Survey Division
 THE CLIMATE OF ILLINOIS Lying midway between the Continental Divide and the Atlantic Ocean, and 500 miles north of the Gulf of Mexico, Illinois has a climate labeled as continental. Cold winters, and warm,
Extreme Weather and Climate Change: the big picture Alan K. Betts Atmospheric Research Pittsford, VT NESC, Saratoga, NY
 Extreme Weather and Climate Change: the big picture Alan K. Betts Atmospheric Research Pittsford, VT http://alanbetts.com NESC, Saratoga, NY March 10, 2018 Increases in Extreme Weather Last decade: lack
The New Normal or Was It?
 The New Normal or Was It? by Chuck Coffey The recent drought has caused many to reflect upon the past and wonder what is in store for the future. Just a couple of years ago, few agricultural producers
The hydrologic service area (HSA) for this office covers Central Kentucky and South Central Indiana.
 for this office covers Central Kentucky and South Central Indiana.") January 2012 February 13, 2012 An X inside this box indicates that no flooding occurred within this hydrologic service area. January 2012 continued the string of wet months this winter. Rainfall was generally
January 2012 February 13, 2012 An X inside this box indicates that no flooding occurred within this hydrologic service area. January 2012 continued the string of wet months this winter. Rainfall was generally
Monthly Long Range Weather Commentary Issued: July 18, 2014 Steven A. Root, CCM, President/CEO
 Monthly Long Range Weather Commentary Issued: July 18, 2014 Steven A. Root, CCM, President/CEO sroot@weatherbank.com JUNE 2014 REVIEW Climate Highlights The Month in Review The average temperature for
Regional Climate Change: Current Impacts and Perspectives Greater Lake Nipissing Stewardship Council Annual Meeting Wednesday April 16, 2014
 Regional Climate Change: Current Impacts and Perspectives Greater Lake Nipissing Stewardship Council Annual Meeting Wednesday April 16, 2014 Speaker: Peter Bullock, Stantec Consulting Information Source:
Funding provided by NOAA Sectoral Applications Research Project CLIMATE. Basic Climatology Colorado Climate Center
 Funding provided by NOAA Sectoral Applications Research Project CLIMATE Basic Climatology Colorado Climate Center Remember These? Factor 1: Our Energy Source Factor 2: Revolution & Tilt Factor 3: Rotation!
Name of research institute or organization: Federal Office of Meteorology and Climatology MeteoSwiss
 Name of research institute or organization: Federal Office of Meteorology and Climatology MeteoSwiss Title of project: The weather in 2016 Report by: Stephan Bader, Climate Division MeteoSwiss English
Will a warmer world change Queensland s rainfall?
 Will a warmer world change Queensland s rainfall? Nicholas P. Klingaman National Centre for Atmospheric Science-Climate Walker Institute for Climate System Research University of Reading The Walker-QCCCE
SEPTEMBER 2013 REVIEW
 Monthly Long Range Weather Commentary Issued: October 21, 2013 Steven A. Root, CCM, President/CEO sroot@weatherbank.com SEPTEMBER 2013 REVIEW Climate Highlights The Month in Review The average temperature
Champaign-Urbana 2000 Annual Weather Summary
 Champaign-Urbana 2000 Annual Weather Summary ILLINOIS STATE WATER SURVEY 2204 Griffith Dr. Champaign, IL 61820 wxobsrvr@sws.uiuc.edu Maria Peters, Weather Observer January: January started on a mild note,
Drought in Southeast Colorado
 Drought in Southeast Colorado Nolan Doesken and Roger Pielke, Sr. Colorado Climate Center Prepared by Tara Green and Odie Bliss http://climate.atmos.colostate.edu 1 Historical Perspective on Drought Tourism
Historical and Projected Future Climatic Trends in the Great Lakes Region
 Historical and Projected Future Climatic Trends in the Great Lakes Region Jeffrey A. Andresen Dept. of Geography, Environment, and Spatial Sciences Michigan State University Outline Historical Trends Climatic
The hydrologic service area (HSA) for this office covers Central Kentucky and South Central Indiana.
 for this office covers Central Kentucky and South Central Indiana.") NWS Form E-5 (04-2006) NATIONAL OCEANIC AND ATMOSPHERIC ADMINISTRATION (PRES. BY NWS Instruction 10-924) NATIONAL WEATHER SERVICE MONTHLY REPORT OF HYDROLOGIC CONDITIONS HYDROLOGIC SERVICE AREA (HSA) Louisville
NWS Form E-5 (04-2006) NATIONAL OCEANIC AND ATMOSPHERIC ADMINISTRATION (PRES. BY NWS Instruction 10-924) NATIONAL WEATHER SERVICE MONTHLY REPORT OF HYDROLOGIC CONDITIONS HYDROLOGIC SERVICE AREA (HSA) Louisville
Lab Activity: Climate Variables
 Name: Date: Period: Water and Climate The Physical Setting: Earth Science Lab Activity: Climate Variables INTRODUCTION:! The state of the atmosphere continually changes over time in response to the uneven
Malawi. General Climate. UNDP Climate Change Country Profiles. C. McSweeney 1, M. New 1,2 and G. Lizcano 1
 UNDP Climate Change Country Profiles Malawi C. McSweeney 1, M. New 1,2 and G. Lizcano 1 1. School of Geography and Environment, University of Oxford. 2. Tyndall Centre for Climate Change Research http://country-profiles.geog.ox.ac.uk
The Pennsylvania Observer
 The Pennsylvania Observer January 5, 2009 December 2008 Pennsylvania Weather Recap The final month of 2008 was much wetter than average and a bit colder than normal. In spite of this combination, most
NIDIS Intermountain West Drought Early Warning System September 4, 2018
 NIDIS Drought and Water Assessment NIDIS Intermountain West Drought Early Warning System September 4, 2018 Precipitation The images above use daily precipitation statistics from NWS COOP, CoCoRaHS, and
Changing Hydrology under a Changing Climate for a Coastal Plain Watershed
 Changing Hydrology under a Changing Climate for a Coastal Plain Watershed David Bosch USDA-ARS, Tifton, GA Jeff Arnold ARS Temple, TX and Peter Allen Baylor University, TX SEWRU Objectives 1. Project changes
Becky Bolinger Water Availability Task Force November 13, 2018
 Colorado Climate Center WATF Climate Update Becky Bolinger Water Availability Task Force November 13, 2018 COLORADO CLIMATE CENTER Water Year 2018 Colorado s Climate in Review COLORADO CLIMATE CENTER
Zambia. General Climate. Recent Climate Trends. UNDP Climate Change Country Profiles. Temperature. C. McSweeney 1, M. New 1,2 and G.
 UNDP Climate Change Country Profiles Zambia C. McSweeney 1, M. New 1,2 and G. Lizcano 1 1. School of Geography and Environment, University of Oxford. 2. Tyndall Centre for Climate Change Research http://country-profiles.geog.ox.ac.uk
September 2018 Weather Summary West Central Research and Outreach Center Morris, MN
 September 2018 Weather Summary The mean temperature for September was 60.6 F, which is 1.5 F above the average of 59.1 F (1886-2017). The high temperature for the month was 94 F on September 16 th. The
Midwest/Great Plains Climate-Drought Outlook September 20, 2018
 Midwest/Great Plains Climate-Drought Outlook September 20, 2018 Brian Fuchs National Drought Mitigation Center University of Nebraska-Lincoln School of Natural Resources September 20, 2018 General Information
Presentation Overview. Southwestern Climate: Past, present and future. Global Energy Balance. What is climate?
 Southwestern Climate: Past, present and future Mike Crimmins Climate Science Extension Specialist Dept. of Soil, Water, & Env. Science & Arizona Cooperative Extension The University of Arizona Presentation
January 2011 Calendar Year Runoff Forecast
 January 2011 Calendar Year Runoff Forecast 2010 Runoff Year Calendar Year 2010 was the third highest year of runoff in the Missouri River Basin above Sioux City with 38.8 MAF, behind 1978 and 1997 which
Colorado s 2003 Moisture Outlook
 Colorado s 2003 Moisture Outlook Nolan Doesken and Roger Pielke, Sr. Colorado Climate Center Prepared by Tara Green and Odie Bliss http://climate.atmos.colostate.edu How we got into this drought! Fort
2015 Fall Conditions Report
 2015 Fall Conditions Report Prepared by: Hydrologic Forecast Centre Date: December 21 st, 2015 Table of Contents Table of Figures... ii EXECUTIVE SUMMARY... 1 BACKGROUND... 2 SUMMER AND FALL PRECIPITATION...
Memo. I. Executive Summary. II. ALERT Data Source. III. General System-Wide Reporting Summary. Date: January 26, 2009 To: From: Subject:
 Memo Date: January 26, 2009 To: From: Subject: Kevin Stewart Markus Ritsch 2010 Annual Legacy ALERT Data Analysis Summary Report I. Executive Summary The Urban Drainage and Flood Control District (District)
5.2. IDENTIFICATION OF NATURAL HAZARDS OF CONCERN
 5.2. IDENTIFICATION OF NATURAL HAZARDS OF CONCERN To provide a strong foundation for mitigation strategies considered in Sections 6 and 9, County considered a full range of natural hazards that could impact
2016 Fall Conditions Report
 2016 Fall Conditions Report Prepared by: Hydrologic Forecast Centre Date: December 13, 2016 Table of Contents TABLE OF FIGURES... ii EXECUTIVE SUMMARY... 1 BACKGROUND... 5 SUMMER AND FALL PRECIPITATION...
Local Climate Change Impacts for Central Illinois
 Local Climate Change Impacts for Central Illinois Molly Woloszyn Extension Climatologist Midwestern Regional Climate Center & Illinois-Indiana Sea Grant Urbana Sustainability Advisory Commission February
Extreme Rainfall in the Southeast U.S.
 Extreme Rainfall in the Southeast U.S. David F. Zierden Florida State Climatologist Center for Ocean Atmospheric Prediction Studies The Florida State University March 7, 2016 Causes of Extreme Rainfall
2011 National Seasonal Assessment Workshop for the Eastern, Southern, & Southwest Geographic Areas
 2011 National Seasonal Assessment Workshop for the Eastern, Southern, & Southwest Geographic Areas On January 11-13, 2011, wildland fire, weather, and climate met virtually for the ninth annual National
El Niño, Climate Change and Water Supply Variability
 El Niño, Climate Change and Water Supply Variability Talk Overview El Niño and California California Climate Variability and Change Water Management in the Face of Change California s topography affects
CAMARGO RANCH, llc. CRAIG BUFORD BufordResources.com
 CAMARGO RANCH, llc 2897 +/- acre Wheat & Cattle Farm Mangum, greer county, oklahoma CRAIG BUFORD 405-833-9499 BufordResources.com 4101 Perimeter Center Dr., Suite 107 Oklahoma City, OK 73112 405.833.9499
Investigation IV: Seasonal Precipitation and Seasonal Surface Runoff in the US
 Investigation IV: Seasonal Precipitation and Seasonal Surface Runoff in the US Purpose Students will consider the seasonality of precipitation and surface runoff and think about how the time of year can
Flooding in Western North Carolina: Some Spatial, Hydrologic, and Seasonal Characteristics CAUTION!! Outline. Basic Flood Facts.
 Flooding in Western North Carolina: Some Spatial, Hydrologic, and Seasonal Characteristics J. Greg Dobson CAUTION!! National Environmental Modeling and Analysis Center RENCI at UNC-Asheville Engagement
MDA WEATHER SERVICES AG WEATHER OUTLOOK. Kyle Tapley-Senior Agricultural Meteorologist May 22, 2014 Chicago, IL
 MDA WEATHER SERVICES AG WEATHER OUTLOOK Kyle Tapley-Senior Agricultural Meteorologist May 22, 2014 Chicago, IL GLOBAL GRAIN NORTH AMERICA 2014 Agenda Spring Recap North America Forecast El Niño Discussion
A GEOGRAPHIC ASSESSMENT OF MAJOR DISASTER DECLARATIONS ACROSS THE LOWER 48 STATES
 A GEOGRAPHIC ASSESSMENT OF MAJOR DISASTER DECLARATIONS ACROSS THE LOWER 48 STATES A summary report produced by the Southern Climate Impacts Planning Program (SCIPP) Author: James Hocker Southern Climate
2018 Year in Review for Central and Southeast Illinois By: Chris Geelhart, Meteorologist National Weather Service, Lincoln IL
 By: Chris Geelhart, Meteorologist National Weather Service, Lincoln IL While 2018 featured some significant out-of-season weather, including below zero temperatures in April and 90-degree highs in early
Natural Disasters and Storms in Philadelphia. What is a storm? When cold, dry air meets warm, moist (wet) air, there is a storm.
 air, there is a storm.") Natural Disasters and Storms in Philadelphia 1. What is a natural disaster? 2. Does Philadelphia have many natural disasters? o Nature (noun) everything in the world not made No. Philadelphia does not
Natural Disasters and Storms in Philadelphia 1. What is a natural disaster? 2. Does Philadelphia have many natural disasters? o Nature (noun) everything in the world not made No. Philadelphia does not
Climate of Columbus. Aaron Wilson. Byrd Polar & Climate Research Center State Climate Office of Ohio.
 Climate of Columbus Aaron Wilson Byrd Polar & Climate Research Center http://bpcrc.osu.edu/greenteam Overview Historical Climatology Climate Change & Impacts Projected Changes Summary 2 Historical Climatology
2. PHYSICAL SETTING FINAL GROUNDWATER MANAGEMENT PLAN. 2.1 Topography. 2.2 Climate
 FINAL GROUNDWATER MANAGEMENT PLAN 2. PHYSICAL SETTING Lassen County is a topographically diverse area at the confluence of the Cascade Range, Modoc Plateau, Sierra Nevada and Basin and Range geologic provinces.
J8.4 TRENDS OF U.S. SNOWFALL AND SNOW COVER IN A WARMING WORLD,
 J8.4 TRENDS OF U.S. SNOWFALL AND SNOW COVER IN A WARMING WORLD, 1948-2008 Richard R. Heim Jr. * NOAA National Climatic Data Center, Asheville, North Carolina 1. Introduction The Intergovernmental Panel