IHG-1 INCREASES MITOCHONDRIAL FUSION AND BIOENERGETIC FUNCTION
|
|
|
- Kory Foster
- 6 years ago
- Views:
Transcription
1 Page 1 of 46 Diabetes IHG-1 INCREASES MITOCHONDRIAL FUSION AND BIOENERGETIC FUNCTION Fionnuala B. Hickey *, James B. Corcoran *, Brenda Griffin *, Una Bhreathnach *, Heather Mortiboys #, Helen M. Reid, Darrell Andrews *, Shane Byrne *, Fiona Furlong, Finian Martin *, Catherine Godson * + and Madeline Murphy * + * Diabetes Complications Research Centre, UCD Conway Institute, University College Dublin, Belfield, Dublin 4, Ireland. UCD School of Medicine and Medical Sciences, University College Dublin, Belfield, Dublin 4, Ireland. UCD School of Biomolecular and Biomedical Science, University College Dublin, Belfield, Dublin 4, Ireland. # Academic Neurology Unit, Medical School, University of Sheffield, Beech Hill Road, Sheffield S10 2RX, UK. School of Pharmacy, QUB, Lisburn Road, Belfast BT9 7BL, Northern Ireland. + Both authors share equivalent seniority Running Title: IHG-1 increases mitochondrial fusion Keywords: IHG-1; diabetic nephropathy; mitochondrial fusion; respiration; oxidative stress Number of Characters: 3795words Number of Figures and Tables: 7 figures 0 Tables Address correspondence to: Madeline Murphy UCD Conway Institute, University College Dublin, Belfield, Dublin 4, Ireland. Tel: Diabetes Publish Ahead of Print, published online July 9, 2014
2 Diabetes Page 2 of 46 ABSTRACT Increased in high glucose-1 (IHG-1) is a conserved mitochondrial protein associated with diabetic nephropathy (DN) that amplifies profibrotic TGF-β1 signaling and increases mitochondrial biogenesis. Here we report that inhibition of endogenous IHG-1 expression results in reduced mitochondrial respiratory capacity, ATP production and mitochondrial fusion. Conversely, overexpression of IHG-1 leads to increased mitochondrial fusion and also protects cells from reactive oxygen species-induced apoptosis. IHG-1 forms complexes with known mediators of mitochondrial fusion mitofusin 1 (Mfn1) and Mfn2, and enhances the GTP-binding capacity of Mfn2 suggesting that IHG-1 acts as a guanine nucleotide exchange factor. IHG-1 must be localised to mitochondria to interact with Mfn1 and Mfn2 and this interaction is necessary for increased IHG- 1-mediated mitochondrial fusion. Together, these findings indicate that IHG-1 is a novel regulator of both mitochondrial dynamics and bioenergetic function and contributes to cell survival following oxidant stress. We propose that in diabetic kidney disease increased IHG-1 expression protects cell viability and enhances the actions of TGF-β leading to renal proximal tubule dedifferentiation an important event in the pathogenesis of this devastating condition 2
3 Page 3 of 46 Diabetes Induced in high glucose-1 (IHG-1) also known as trna-histidine guanylyltransfrerase 1- like (THG1L) was originally identified as a glucose regulated transcript in a screen for genes associated with diabetic nephropathy (DN) [1-3]. IHG-1 is a highly conserved protein localised to mitochondria and plays an important regulatory role in mitochondrial biogenesis by stabilising the transcriptional co-factor peroxisome proliferator-activated receptor (PPAR) -γ co-activator 1α (PGC-1α) [4]. IHG-1 expression is increased in human DN and is likely to contribute to the development of tubulointerstitial fibrosis (TIF) in this disease [5]. IHG-1 amplifies responses to the major fibrotic mediator transforming growth factor (TGF) β1 by both increasing and prolonging phosphorylation of signal mediator Smad3 [5]. IHG-1 must be localised to mitochondria to amplify TGF-β1 signalling [6]. Mitochondria play a central role in cellular adaptation to hyperglycaemic conditions [7]. In diabetes, increased glucose metabolism resulting in increased mitochondrial production of reactive oxygen species (ROS) is believed to be the primary event leading to development and progression of diabetic vascular complications [8]. Oxidant stress resulting from increased ROS contributes towards TGF-β1 activity in the diabetic kidney [9, 10]. Hyperglycaemia, oxidative stress and TGFβ1 signalling induce increased mitochondrial biogenesis and alterations in mitochondrial dynamics [11-17]. Mitochondria are plastic organelles that frequently change shape and size. Dynamic fusion and fission events are important for the bioenergetic function of mitochondria [18] as is PGC- 1α activity which plays a key role in enhancing mitochondrial stress related bioenergetic function [19]. Mitochondrial fusion relies on dynamin-related GTPases; mitofusin (Mfn) 1 and 2 and OPA1 (optic atrophy 1) [20, 21]. Mitochondrial fission relies on another GTPase: cytosolic dynamin-related protein 1 (Drp1), which translocates to mitochondria under circumstances that promote fission to interact with mitochondrial outer membrane protein fission 1 (Fis1) [22]. The balance between mitochondrial fission and fusion is important in maintaining mitochondrial quality. Mitochondrial fusion ensures mixing of organelle components, preservation of mitochondrial 3
4 Diabetes Page 4 of 46 membrane potential, protects against oxidant stress and apoptosis and allows for optimal bioenergetic function, [23-27]. Conversely, mitochondrial fission is associated with apoptosis [28, 29]. Here we report that IHG-1 is a novel regulator of mitochondrial dynamics and bioenergetic function and contributes to cell survival following oxidant stress. These data suggest that IHG-1 plays a pivotal role in maintaining mitochondrial quality an important feature of TIF in diabetic kidney disease[30]. RESEARCH DESIGN AND METHODS Cell culture - Stably transduced cell lines have been described previously (Fig. S1)[4, 6]. No significant effects of doxycycline were observed (Fig. S2, S3). XF bioenergetic assay Cells were counted and seeded in XF24 culture plates at 7.5 x 10 4 cells per well in 100 µl of culture medium. Once cells had attached (~2 hours) a further 250 µl of culture medium was added and cells were incubated at 37 C with 5% CO 2 overnight. Prior to assay cells were washed with assay media (XF Assay Medium supplemented with 1 mm sodium pyruvate, 1 mg/ml glucose, 2 mm L-glutamine) and equilibrated in 675 µl pre-warmed assay media per well at 37 C with no CO 2 for 1 hour. Measurements of oxygen consumption rate (OCR) and extracellular acidification rate (ECAR) were performed using an XF24 Extracellular Flux Analyser (Seahorse Bioscience). Prior to each rate measurement each sample was gently mixed for 2 minutes and a further 3 minute wait time was employed to allow oxygen partial pressure to reach equilibrium. For each rate measurement OCR and ECAR were measured simultaneously for 3 minutes. Once a baseline measurement had been established rates were measured following compound addition (1 µm oligomycin; 0.5 µm FCCP; 0.1 µm rotenone). At the end of each assay cell density per well was determined by removing the assay media and adding 2.5 µm calcein-am in PBS (200 µl per well). Cells were incubated for 1 hour at 37 C and fluorescence intensity at 530 nm (excitation = 488 nm) was the measured using a FLUOstar Omega plate reader. OCR and ECAR measurements were normalised to cell density for each sample. 4
5 Page 5 of 46 Diabetes ATP quantification Cells were seeded in 96-well culture plates at 7.0 x 10 4 cells per well in 100 µl of culture medium. Cells were incubated overnight. Intracellular ATP was measured using an ATPlite luminescence ATP detection kit according to manufacturer s instructions (Perkin Elmer). ATP concentration in samples was determined using a standard curve. Cell density for each sample was measured in duplicate wells by removing the culture medium and adding 2.5 µm calcein-am (Merck) in PBS (200 µl per well). Cells were incubated for 1 hour at 37 C and fluorescence intensity at 530 nm (excitation = 488 nm) was the measured using a FLUOstar Omega plate reader. ATP concentration was normalised to cell density for each sample. Assessment of mitochondrial morphology Mitochondrial morphology was examined by fluorescence microscopy in cells transduced with plenti6/acgfp1-mito. Cells were cultured on 8- well µ-slides. Andor IQ software was used to acquire images with an Andor Technology ixon EM + EMCCD camera mounted on a Nikon Eclipse Ti microscope equipped with a Yokogawa CSU-X1 scan head using a Nikon Plan Apo 40x oil (NA=1.3) or Nikon Plan Fluor 100x oil objective (NA=1) at 37 C in phenol red-free media. Cells were classified based on the majority (>70%) of mitochondria. Normal = tubular network-like morphology with constant diameter throughout the cell; Fragmented = short/punctuate mitochondria; Fused = increased mitochondrial diameter and aggregation of mitochondria; Elongated = continuos tubular mitochondria with very little branching. For each sample, 45 individual cells were analysed, each from a separate field and from at least 3 independent experiments. FRAP analysis For FRAP analysis, HeLa cells were cultured on 8-well µ-slides. FRAP assessments were carried out using Andor IQ software with an Andor Technology ixon EM + EMCCD camera mounted on a Nikon Eclipse Ti microscope equipped with a Yokogawa CSU-X1 scan using a Nikon Plan Fluor 100x oil objective (NA=1) at 37 C in phenol red-free media. Mitochondrial-targeted GFP was bleached to approximately 50% of the initial signal using a brief 5
6 Diabetes Page 6 of 46 pulse of high-intensity laser illumination, followed by acquisition of images every 2 seconds for duration of 2 minutes. Polyethylene glycol-mediated (PEG) cell fusion assay This assay was adapted from Legros et al [31]. Cells expressing AcGFP1-Mito and DsRed2-Mito were mixed and plated on 8-well µ-slides 8 16 hours before cell fusion. Cells at % confluency were washed with PBS and incubated for 30 seconds with 500 µl of a 50 % (wt/vol in MEM) solution of PEG Cells were then washed gently three times with pre-warmed culture medium containing 20 µg/ml cycloheximide to inhibit protein synthesis. Imaging of polykaryons containing both GFP- and RFP-labelled mitochondria was commenced 5 hours after cell fusion. Images were acquired using Andor IQ software with an Andor Technology ixon EM + EMCCD camera mounted on a Nikon Eclipse Ti microscope equipped with a Yokogawa CSU-X1 scan head using a Nikon Plan Apo 40x oil (NA=1.3) objective (NA=1) at 37 C in phenol red-free media. Images were taken at 30 minute intervals for at least 5 hours. Mitochondrial fusion was determined to have occurred in regions where GFP and RFP were merged (i.e. yellow fluorescence detected due to overlap of fluorophores) GTP binding assay Cells were lysed in lysis buffer (20 mm Tris ph 8.0, 135 mm NaCl, 1 mm MgCl 2, 0.1 mm CaCl 2, 10% Glycerol, 1% NP-40, 50 mm β glycerophosphate) supplemented with protease inhibitor cocktail GTP-agarose beads were blocked in 1% BSA for 1 hour at 4 C and then washed twice with wash buffer (25 mm MOPS ph 7.2, 12.5 mm β glycerophosphate, 25 mm MgCl 2, 5 mm EGTA, 2 mm EDTA, 0.002% BSA, 0.25 mm DTT). Cell lysates were incubated with blocked GTP-agarose beads for 2 hours at 4 C. Samples were then washed three times with lysis buffer. GTP-bound Mfn2 was assessed by immunoblotting. Cell lysate incubated with unboud agarose demonstrates the specificity of the binding (Fig. S1E) Calcium measurements Measurement of [Ca 2+ ] i mobilization was carried out using the Fluoroskan Ascent FL according to the method of [32]. 6
7 Page 7 of 46 Diabetes Apoptosis assay and analysis of mitochondrial membrane potential (MMP) Cells at ~80% confluency were treated with glucose oxidase (10 mu/ml) or sorbitol (200mM or 250mM). Cells were detached using accutase after treatment and combined with floating cells. For assessment of apoptosis cells were washed and incubated with annexin V-FITC in binding buffer [200 mm Hepes; 2.8 M NaCl; 50 mm CaCl 2 ] for 15 minutes at 37 C. Cells were washed once with binding buffer prior to the addition of 10 µg/ml propidium iodide. Cells were then analysed using a Cyan ADP cytometer. For MMP measurements cells were stained with 200nM TMRE for 15 minutes or 5µg/ml JC-1 for C. Cells were then washed once with PBS. TMRE was measured at 575nm and JC-1 was at 530nm and 590nm. Statistical analysis - All experiments were carried out with a minimum of n =3. Intergroup comparisons were made by Student s t test or one-way ANOVA followed by Tukey s post test using GraphPad Prism, with P<0.05 considered statistically significant. RESULTS IHG-1 is required for mitochondrial respiration We have previously reported that IHG-1 increases mitochondrial biogenesis and stabilises the transcriptional activator PGC-1α in both renal proximal tubule cells (RPTC) and HeLa cells [4]. PGC-1α activity regulates mitochondrial respiration and functions to boost respiratory capacity to withstand cellular stress suggesting that IHG-1 may regulate mitochondrial respiration [19]. In order to investigate the role of IHG-1 in cellular respiration we used an extracellular flux analyser to measure OCR in previously generated stable proximal tubule (HK-2) cell lines expressing tetracycline-inducible IHG-1-specific short hairpin RNA interference (shrnai) or a scrambled shrnai control (Scr) [4]. Loss of endogenous IHG-1 expression led to a significant decrease in both basal respiration and total respiratory capacity (less than 50% of control cells; p<0.01) (Fig. 1A) and a significant decrease in ATP production (Fig. 1B). Expression of mitochondrial complexes II and V were 7
8 Diabetes Page 8 of 46 unaltered (Fig. 1C). Conversely, overexpression of IHG-1 led a significant increase in both basal respiration and cellular respiratory capacity (Fig. 1D). These data indicate that IHG-1 is required for mitochondrial respiration in renal proximal tubules cells. IHG-1 increases mitochondrial fusion. Dynamic fusion and fission events are important for the bioenergetic function of mitochondria [18]. To assess the role of IHG-1 in mitochondrial dynamics, we fluorescently labelled mitochondria by overexpressing mitochondrial-targeted GFP (mtgfp) in previously generated stable cell lines overexpressing IHG-1 or expressing IHG-1 shrnai (Fig. S1)[4]. Mitochondrial networks in these cells were analysed by confocal microscopy and scored as being normal, fragmented, elongated or fused (i.e. aggregates principally clustered around the nucleus). Mitochondrial networks in control cells were typically highly connected and contained tubular mitochondria (Fig. 2). Loss of endogenous IHG-1 expression resulted in a marked reduction in mitochondrial connectivity and individual mitochondria that were small and punctate in appearance (Fig. 2A). Further images for each cell line are shown in Figure S4. This was not associated with increased turnover of mitochondria (Fig.S5). Conversely overexpression of IHG-1 resulted in mitochondria that were aggregated or fused (Fig. 2B). The effects of both IHG-1 knockdown and overexpression were not related to changes in the expression of known mediators of fission or fusion including Drp-1, Fis1, Mfn1, Mfn2, and OPA1 (Figure S6) Fluorescence recovery after photobleaching (FRAP) was performed on IHG-1 overexpression and knockdown cell lines to quantify mitochondrial dynamics. Reduced endogenous IHG-1 expression resulted in a significant decrease in the rate of fluorescence (expressed as a percentage of the original fluorescence prior to photobleaching) recovery signifying reduced mitochondrial fusion (p<0.05; Fig. 3A) whereas IHG-1 overexpression resulted in a significant increase in the rate of fluorescence recovery indicating increased mitochondrial fusion (p<0.05; Fig. 3B). 8
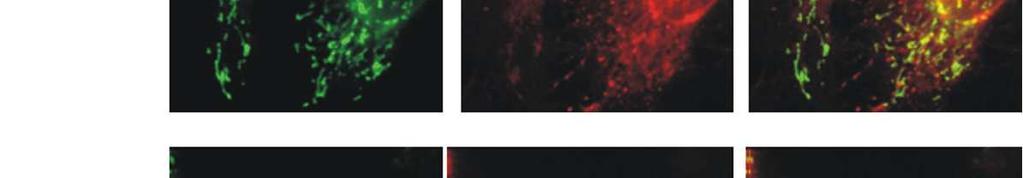
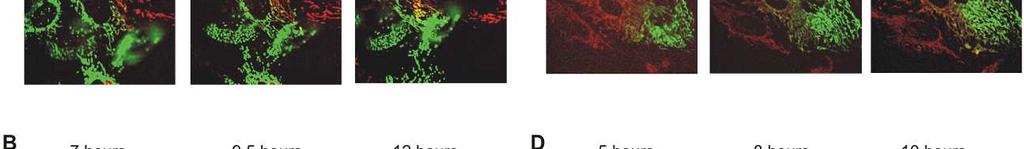
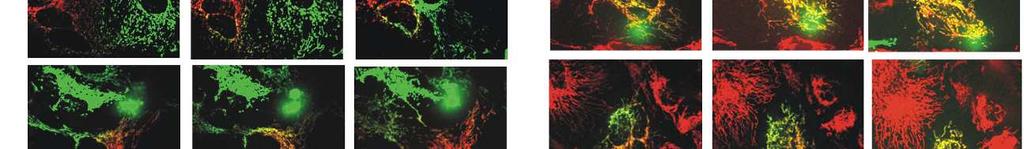
9 Page 9 of 46 Diabetes To further validate the role of IHG-1 in mitochondrial fusion a polyethylene glycol- (PEG) mediated cell fusion assay was performed. IHG-1 overexpression and knockdown cell lines expressing mitochondrial-targeted RFP (mtrfp) were generated. PEG was used to catalyse the fusion of cellular membranes of the cell lines with RFP and GFP labelled mitochondria, this was performed in the presence of cycloheximide to inhibit protein synthesis. Twelve hours after PEG addition significantly less fluorophore overlap was seen in IHG-1 knockdown cells compared to control cells, indicating a decreased rate of mitochondrial fusion (Fig. 3C). Conversely, in cells overexpressing IHG-1, fluorophore overlap was seen to occur at a notably faster rate when compared to control cells, demonstrating an increased rate of mitochondrial fusion (Fig. 3D). Further images for each cell line are shown in Figure S7. These data strongly indicate that IHG-1 increases mitochondrial fusion. IHG-1 forms a complex with mitofusins Mitofusions (Mfn1 or Mfn2) are essential for mitochondrial fusion, while mitochondrial fission relies on Drp1 and Fis1 [20-22]. In order to investigate whether IHG-1 interacts with known mediators of mitochondrial dynamics, protein lysates from HEK293 cells transfected with IHG-1- V5 in combination with Mfn1, Mfn2, Drp1 (all Flag-tagged) or Fis1 (Myc tagged) were subjected to immunoprecipitation with both V5 and Flag (or Myc) antibodies. The immunoprecipitated proteins were analysed by westerns blots probed with V5 and either Flag or Myc antibodies. All proteins were successfully immunoprecipitated. IHG-1 was co-immunoprecipitated with both Mfn1 (Fig 4A) and Mfn2 (Fig 4B) but not with either Drp1 (Fig 4C) or Fis1 (Fig. 4D) indicating that IHG-1 and Mfn1 and Mfn2 are protein-protein binding partners. Endogenous IHG-1 and Mfn2 were also confirmed to form a complex by co-immunoprecipitation (Fig. 4E). These data demonstrate that IHG-1 forms a complex with both mitofusin GTPases. 9
10 Diabetes Page 10 of 46 IHG-1 must complex with Mfn1 and Mfn2 to increase mitochondrial fusion. IHG-1 has an amino terminal mitochondrial targeting sequence that is necessary for its import into mitochondria [4-6]. We have previously generated a deletion mutant of IHG-1 that lacks the mitochondrial targeting sequence - mts-ihg-1 [6]. To investigate whether mitochondrial localisation was necessary for IHG-1 to bind to mitofusins, protein lysates from HEK293 cells were transfected with mts-ihg-1-v5 in combination with Flag-Mfn1 or Flag- Mfn2 and subjected to immunoprecipitation with both V5 and Flag antibodies. mts-ihg-1 did not bind to either Mfn1 or Mfn2 (Fig 5A) indicating that IHG-1 must be localised to mitochondria to interact with the mitofusins. To investigate whether mts-ihg-1 increased mitochondrial fusion FRAP analysis was performed in a stable cell line expressing mts-ihg-1. mts-ihg-1 expression resulted in a significant decrease in the rate of fluorescence recovery indicating decreased mitochondrial fusion (Fig. 5B). Therefore IHG-1 must be localised to mitochondria to interact with Mfn1 and Mfn2 and increase mitochondrial fusion. These data indicate that that IHG-1 must interact with the mitofusins to enhance mitochondrial fusion. IHG-1 - Mfn2 complex results in increased GTP-bound to Mfn2 Mitochondrial fusion requires a functional GTP-binding domain in the mitofusins [33]. When crystallised IHG-1 was found bound to GTP [34] suggesting that IHG-1 may possibly increase mitofusin activity by increasing GTP binding i.e. by acting as a guanine nucleotide exchange factor (GEF). Cell lysates from IHG-1 knockdown and overexpression cell lines were incubated with GTP-agarose in order to investigate the ability of IHG-1 to modulate mitofusin-gtp binding. GTPbound Mfn2 was measured by immunoblot and quantified by densitometry. Loss of endogenous IHG-1 expression resulted in a reduction in the amount of GTP bound to Mfn2 (Fig. 6A) and reduced mitochondrial fusion (Fig 3A, C) while overexpression of IHG-1 led to increased Mfn2- GTP binding (Fig 6B) and increased mitochondrial fusion (Fig 3B, D). IHG-1 must complex with 10
11 Page 11 of 46 Diabetes Mfn2 to increase GTP binding as overexpression of mts-ihg-1 resulted in a reduction in the amount of GTP bound to Mfn2 (Fig. 6B) and reduced mitochondrial fusion (Fig 5B). These data indicate that IHG-1 increases GTP bound Mfn2 suggesting that IHG-1 may function as a GEF and thus enhance mitochondrial fusion. IHG-1 does not alter calcium levels. Lack of MFN2 has been shown to lead to increased calcium release from ER stores following stimulation with the sarcoplasmic-endoplasmic reticulum Ca 2+ ATPase (SERCA) inhibitor (tertbuthyl benzohydroquinone) tbubhq[35]. tbubhq causes the passive release of Ca 2+ from ER stores resulting in increases in cytosolic Ca 2+ concentration ([Ca 2+ ]i). The increase in cytosolic calcium when measured with the fluorescent dye Fluo-4/AM was similar in IHG-1 overexpressing, IHG-1 shrna knockdown and control HeLa cell lines (Fig. 7). These data indicate that IHG-1 does not alter cytosolic calcium. Increased IHG-1 expression protects cells from reactive oxygen species-induced apoptosis. Mitochondrial production of ROS is proposed as the primary event leading to development of diabetic vascular complications [8]. Increased mitochondrial fusion decreases ROS production [12, 27] and is an important process for maintenance of mitochondrial quality [36]. IHG-1 may function in the diabetic kidney to preserve mitochondrial function following oxidant stress. To investigate the role of IHG-1 in cell survival following oxidative stress IHG-1 overexpressing cell lines were treated with glucose oxidase which catalyses the oxidation of glucose to hydrogen peroxide. IHG-1 overexpression significantly protected the cells from ROS induced apoptosis (Fig. 8A) and resulted in a significant preservation of mitochondrial membrane potential as demonstrated by TMRE staining (Fig. 8B) and confirmed by JC-1 staining (Fig. S8). These data indicate that IHG-1 plays an important role in maintaining mitochondria function and cell viability following oxidant stress. No 11
12 Diabetes Page 12 of 46 protective effect against hyperosmotic stress-induced apoptosis was seen following overexpression of IHG-1 (Fig. 8C) suggesting that the anti-apoptotic effects of IHG-1 may be limited to ROS. DISCUSSION In this paper we propose IHG-1 as a novel regulator in the mitochondrial quality control axis and a key element in the cellular response to oxidant stress. In diabetes, hyperglycaemia has damaging effects on mitochondria, resulting in the accumulation of dysfunctional mitochondria and ultimately organ damage [7, 37]. Mitochondrial quality control relies on maintaining balanced mitochondrial biogenesis, fusion and fission [7, 37, 38]. Increased stress (e.g. oxidative stress) can alter this balance leading to dysfunctional mitochondria and disease. Hyperglycaemia-induced mitochondrial production of ROS plays a critical role in disease development [9] and disease associated TGF-β1 activity [10] in the diabetic kidney. We have previously reported mitochondrial IHG-1 to amplify TGF-β1 signalling, stabilise PGC-1α protein, and increase mitochondrial biogenesis in kidney cells [4-6]. IHG-1 both increases and prolongs phosphorylation of TGF-β1 signalling mediator Smad3, which in turn has been reported to regulate mitochondrial biogenesis [14, 17]. Consistent with IHG-1 induced stabilisation of PGC-1α we report here that IHG-1 is necessary for mitochondrial respiration. PGC-1α was originally believed essential for mitochondrial biogenesis but recent studies indicate its principal role is to regulate mitochondrial respiration and to boost respiratory capacity to withstand stress [19]. Our data indicates that IHG-1 is necessary for mitochondrial respiratory function in renal proximal tubular cells (RPTC). Balanced mitochondrial fusion and fission is critical in maintaining mitochondrial quality [24, 37]. The rates of fusion and fission need to be tightly controlled to adapt to varying bioenergetic demands in changing physiological conditions [37]. Dysregulation of mitochondrial dynamics is a feature of diabetic disease [7, 13, 37, 39, 40]. IHG-1 increases mitochondrial fusion, consistent with the role of IHG-1 in oxidative phosphorylation and mitochondrial biogenesis. 12
13 Page 13 of 46 Diabetes Increased IHG-1 expression leading to increased mitochondrial fusion may be a recovery mechanism in response to hyperglycaemic stress. Sustained hyperglycaemic insult and resulting persistent increases in IHG-1 expression would lead to enhanced mitochondrial fusion and biogenesis, Smad3 signalling and fibrosis. Hyperglycaemia has been described to induce mitochondrial fission in pancreatic beta cells [39], liver cells [13], endothelial cells and podocytes [40]. However as adaption of mitochondrial bioenergetic capacity to nutrient availability differs among tissues the differing responses are likely due to specific cellular physiology. It is worth noting previous reported studies investigating hyperglycaemic induced changes in mitochondrial dynamics focussed on acute exposure to high extracellular glucose (i.e. between 15 min and 48h) [13, 39, 40]. Monitoring of mitochondrial dynamics throughout the 48h period showed fluctuating cycles of fission associated with ROS production followed by restoration of mitochondrial architecture (and loss of ROS) [13]. These data suggest that in hyperglycaemic conditions increased mitochondrial fission (either resulting from or contributing to increased ROS production) initiates pathways that increase mitochondrial fusion in a cyclic fashion in order to restore the imbalance in mitochondrial dynamics. Therefore it seems probable that sustained exposure to hyperglycaemia may result in imbalanced mitochondrial dynamics, possibly ultimately resulting in increased mitochondrial fusion in RPTC and possibly other cell types. This concept is strengthened by the observation that in early stages of diabetic kidney disease in streptozotocin (STZ)-induced diabetic rats ultrastructural changes in mitochondria in RPTC (described as giant mitochondria) were found to correlate with disturbances in the main functions of renal tubule cells and typical features of DN [41]. EM studies have shown that the mean size of mitochondria was larger in DN compared with those in normal controls [41] similar findings were described for mitochondria in RPTC of STZ-induced diabetic mice [42]. Increased IHG-1 expression, leading to increased mitochondrial fusion, may be a recovery mechanism in response to hyperglycaemic stress. Sustained hyperglycaemic insult and resulting persistent 13
14 Diabetes Page 14 of 46 increases in IHG-1 expression would lead to enhanced mitochondrial fusion and biogenesis, Smad3 signalling and fibrosis. Hyperglycaemia-induced mitochondrial ROS production is a critical mediator in the development and progression of diabetic vascular complications [8]. Increased ROS levels are deleterious to cells and lead to increased mitochondrial fragmentation and apoptosis [43-45], while mitochondrial fusion protects cells from apoptosis [27]. IHG-1 overexpression protected cells from ROS-induced apoptosis consistent with its ability to increase mitochondrial fusion. IHG-1 protects cells from oxidant stress and may function in the diabetic kidney to preserve mitochondrial function and cell viability, while at the same time amplifying TGF-β profibrotic responses. Prosurvival signals are critical in dedifferentiation of RPTCs following oxidation injury [46]. Dedifferentiation of RPTC is one of the major pathways leading to tubulointerstitial fibrosis (TIF). The survival of damaged epithelial cells is not necessarily beneficial and the repair of damaged epithelium is frequently maladaptive resulting in fibrosis which has major clinical consequences [47, 48]. TGF-β1, believed to be the key driver of fibrosis in TIF, has been shown to induce mitochondrial fusion in epithelial cells [15]. IHG-1 must complex with Mfn1 and Mfn2 to increase mitochondrial fusion possibly by acting as a GEF. Lack of MFN2 has been shown to lead to increased calcium release from ER stores as a result of disruption of ER morphology and ER-mitochondrial interaction. While IHG-1 increases MFN2 activity and possibly enhances ER-mitochondrial interaction it this does not alter calcium release from ER stores. Mfn2 is an important mediator in response to metabolic stress in the kidney. Murine kidneys were able to maintain normal filtration and tubular function following conditional deletion of Mfn2, yet showed an increased susceptibility to apoptosis following metabolic stress [49]. Consistent with the role of mitochondrial fusion in bioenergetic function, Mfn2 has been reported to stimulate respiration, substrate oxidation and the expression of subunits involved in respiratory complexes [18, 50] and is essential for normal glucose homeostasis [51]. IHG-1 interaction with Mfn2 14
15 Page 15 of 46 Diabetes therefore may not only be important in increasing mitochondrial fusion but also in increasing cellular respiratory capacity. IHG-1 most likely increases mitochondrial fusion by enhancing the GTP-binding capacity of Mfn2, an action independent of its role in amplifying TGF-β1 signalling responses, consistent with the fact that IHG-1 is a more evolutionary ancient protein than TGF-β1. As TGF-β1 also contributes towards mitochondrial fusion the increased expression of both proteins in diabetic kidney disease is likely to be additive, however neither IHG-1 nor TGF-β1 altered the expression of Mfn2, Drp1 or complexes of the ETC in RPTC (Fig. S9). The function of the core components of mitochondrial dynamics (i.e FZO/mitofusin, Mgm1/EAT-3/OPA1 and Dnm1/DRP1) are highly conserved in yeast, worms, flies and mammals while regulatory proteins in general are more varied among these organisms [52]. IHG-1, similarly, is a highly conserved protein among eukaryotes [5]. The IHG-1 yeast homologue THG1 is an essential protein in yeast [34]. Therefore it seems probable that IHG-1 is a core component of the mitochondrial fusion machinery. In conclusion we propose IHG-1 as a novel player in the mitochondrial quality control axis. IHG-1 acts to preserve mitochondrial function by co-ordinating a pro-survival programme involving stabilisation of PGC-1α protein and increasing mitochondrial respiratory capacity, biogenesis and fusion. The net result of these actions protects cell viability following oxidative stress but also leads to amplification of pro-fibrotic TGF-β1 activity in RPTC, most likely leading to TIF. IHG-1 like the mitofusins is evolutionarily ancient and remarkably conserved. As IHG-1 must interact with the mitofusins to increase fusion and is an essential protein in yeast, it is likely a crucial player in mitochondrial dynamics and quality control. ACKNOWLEDGEMENTS This work was funded by Science Foundation Ireland (grant numbers SFI/06/IN.1/B114 and SFI/RFP06/BIC304), Wellcome Trust (grant number /Z/03/Z), the Health Research Board 15
16 Diabetes Page 16 of 46 and the Government of Ireland Programme for Research in Third Level Institutions. F.H. is the guarantor of this work and, as such, had full access to all the data in the study and takes responsibility for the integrity of the data and the accuracy of the data analysis. The authors acknowledge no conflicts of interest. This work was presented in part at the American Society of Nephrology (ASN) annual meetings 2010, San Diego, USA and 2011, St. Louis USA and at the Irish Nephrology Society 2010, Dublin, Ireland. We thank Dr. Dimitri Scholz and Dr. Alfonso Blanco (UCD, Ireland) for technical assistance with fluorescence microscopy and flow cytometry in this study. We are grateful to Dr Ruth Gimeno, BioTex Pzifer Cambridge, MA for IHG-1 antibody, and Prof. Didier Trono, University of Geneva, Switzerland for pcmv R8.9 and pmd.2g constructs. AUTHOR CONTRIBUTIONS F.B.H., J.B.C., F.M., C.G. and M.M. designed research; F.B.H., J.B.C., B.G., U.B. S.B., H.M.R, D.A. and F.F. performed research; H.M. contributed new analytical tools; F.B.H, J.B.C., F.M., C.G. and M.M. analysed data; F.B.H., F.M., C.G. and M.M. wrote the manuscript. ABBREVIATIONS Dox, doxycycline; FRAP, fluorescence recovery after photobleaching; IHG-1, induced in high glucose 1; MFN, mitofusin; mtdna, mitochondrial DNA; mtgfp, mitochondrially-targetted green fluorescent protein; mtrfp, mitochondrially-targetted red fluorescent protein; OPA1, optic atrophy 1; PEG, polyethylene glycol; RPTC, renal proximal tubule cells. REFERENCES 1. Murphy, M., et al., Suppression subtractive hybridization identifies high glucose levels as a stimulus for expression of connective tissue growth factor and other genes in human mesangial cells. J Biol Chem, (9): p Murphy, M., F. Hickey, and C. Godson, IHG-1 amplifies TGF-beta1 signalling and mitochondrial biogenesis and is increased in diabetic kidney disease. Curr Opin Nephrol Hypertens, (1): p
17 Page 17 of 46 Diabetes 3. Clarkson, M.R., et al., High glucose-altered gene expression in mesangial cells. Actinregulatory protein gene expression is triggered by oxidative stress and cytoskeletal disassembly. J Biol Chem, (12): p Hickey, F.B., et al., IHG-1 promotes mitochondrial biogenesis by stabilizing PGC-1alpha. J Am Soc Nephrol, (8): p Murphy, M., et al., IHG-1 amplifies TGF-beta1 signaling and is increased in renal fibrosis. J Am Soc Nephrol, (9): p Corcoran, J.B., et al., IHG-1 must be localised to mitochondria to decrease Smad7 expression and amplify TGF-beta1-induced fibrotic responses. Biochim Biophys Acta, (8): p Liesa, M. and O.S. Shirihai, Mitochondrial dynamics in the regulation of nutrient utilization and energy expenditure. Cell Metab, (4): p Brownlee, M., The pathobiology of diabetic complications: a unifying mechanism. Diabetes, (6): p Coughlan, M.T., et al., RAGE-induced cytosolic ROS promote mitochondrial superoxide generation in diabetes. J Am Soc Nephrol, (4): p Forbes, J.M., M.T. Coughlan, and M.E. Cooper, Oxidative stress as a major culprit in kidney disease in diabetes. Diabetes, (6): p Rasbach, K.A. and R.G. Schnellmann, Signaling of mitochondrial biogenesis following oxidant injury. J Biol Chem, (4): p Yoon, Y.S., et al., Formation of elongated giant mitochondria in DFO-induced cellular senescence: involvement of enhanced fusion process through modulation of Fis1. J Cell Physiol, (2): p Yu, T., J.L. Robotham, and Y. Yoon, Increased production of reactive oxygen species in hyperglycemic conditions requires dynamic change of mitochondrial morphology. Proc Natl Acad Sci U S A, (8): p Ge, X., et al., Lack of Smad3 signaling leads to impaired skeletal muscle regeneration. Am J Physiol Endocrinol Metab, (1): p. E Ryu, S.W., et al., Downregulation of OPA3 Is Responsible for Transforming Growth Factor-beta-Induced Mitochondrial Elongation and F-Actin Rearrangement in Retinal Pigment Epithelial ARPE-19 Cells. PLoS One, (5): p. e Stieger, N., et al., Impact of high glucose and transforming growth factor-beta on bioenergetic profiles in podocytes. Metabolism, (8): p Yadav, H., et al., Protection from obesity and diabetes by blockade of TGF-beta/Smad3 signaling. Cell Metab, (1): p Zorzano, A., et al., Mitochondrial fusion proteins: dual regulators of morphology and metabolism. Semin Cell Dev Biol, (6): p Rowe, G.C., et al., Disconnecting Mitochondrial Content from Respiratory Chain Capacity in PGC-1-Deficient Skeletal Muscle. Cell Rep, (5): p Fritz, S., et al., Connection of the mitochondrial outer and inner membranes by Fzo1 is critical for organellar fusion. J Cell Biol, (4): p Eura, Y., et al., Two mitofusin proteins, mammalian homologues of FZO, with distinct functions are both required for mitochondrial fusion. J Biochem, (3): p Yoon, Y., et al., The mitochondrial protein hfis1 regulates mitochondrial fission in mammalian cells through an interaction with the dynamin-like protein DLP1. Mol Cell Biol, (15): p Sugioka, R., S. Shimizu, and Y. Tsujimoto, Fzo1, a protein involved in mitochondrial fusion, inhibits apoptosis. J Biol Chem, (50): p Sesaki, H. and R.E. Jensen, Division versus fusion: Dnm1p and Fzo1p antagonistically regulate mitochondrial shape. J Cell Biol, (4): p Song, Z., et al., Mitofusins and OPA1 mediate sequential steps in mitochondrial membrane fusion. Mol Biol Cell, (15): p
18 Diabetes Page 18 of Anne Stetler, R., et al., The dynamics of the mitochondrial organelle as a potential therapeutic target. J Cereb Blood Flow Metab, (1): p Gomes, L.C., G. Di Benedetto, and L. Scorrano, During autophagy mitochondria elongate, are spared from degradation and sustain cell viability. Nat Cell Biol, (5): p Neuspiel, M., et al., Activated mitofusin 2 signals mitochondrial fusion, interferes with Bax activation, and reduces susceptibility to radical induced depolarization. J Biol Chem, (26): p Twig, G., et al., Fission and selective fusion govern mitochondrial segregation and elimination by autophagy. EMBO J, (2): p Weinberg, J.M., Mitochondrial biogenesis in kidney disease. J Am Soc Nephrol, (3): p Legros, F., et al., Mitochondrial fusion in human cells is efficient, requires the inner membrane potential, and is mediated by mitofusins. Mol Biol Cell, (12): p Lin, K., W. Sadee, and J.M. Quillan, Rapid measurements of intracellular calcium using a fluorescence plate reader. Biotechniques, (2): p , Chen, H., et al., Mitofusins Mfn1 and Mfn2 coordinately regulate mitochondrial fusion and are essential for embryonic development. J Cell Biol, (2): p Heinemann, I.U., et al., trnahis-guanylyltransferase establishes trnahis identity. Nucleic Acids Res, (1): p de Brito, O.M. and L. Scorrano, Mitofusin 2 tethers endoplasmic reticulum to mitochondria. Nature, (7222): p Miller, M.W., et al., Nitric oxide regulates vascular adaptive mitochondrial dynamics. Am J Physiol Heart Circ Physiol, (12): p. H Westermann, B., Mitochondrial fusion and fission in cell life and death. Nat Rev Mol Cell Biol, (12): p Twig, G., B. Hyde, and O.S. Shirihai, Mitochondrial fusion, fission and autophagy as a quality control axis: the bioenergetic view. Biochim Biophys Acta, (9): p Molina, A.J., et al., Mitochondrial networking protects beta-cells from nutrient-induced apoptosis. Diabetes, (10): p Wang, W., et al., Mitochondrial fission triggered by hyperglycemia is mediated by ROCK1 activation in podocytes and endothelial cells. Cell Metab, (2): p Kaneda, K., et al., Correlation between mitochondrial enlargement in renal proximal tubules and microalbuminuria in rats with early streptozotocin-induced diabetes. Acta Pathol Jpn, (12): p Galloway, C.A., et al., Transgenic control of mitochondrial fission induces mitochondrial uncoupling and relieves diabetic oxidative stress. Diabetes, (8): p Jabs, T., Reactive oxygen intermediates as mediators of programmed cell death in plants and animals. Biochem Pharmacol, (3): p Lee, Y.J., et al., Oxidative stress-induced apoptosis is mediated by ERK1/2 phosphorylation. Exp Cell Res, (1): p Macip, S., et al., Influence of induced reactive oxygen species in p53-mediated cell fate decisions. Mol Cell Biol, (23): p Zhuang, S., et al., p38 kinase-mediated transactivation of the epidermal growth factor receptor is required for dedifferentiation of renal epithelial cells after oxidant injury. J Biol Chem, (22): p Coca, S.G., et al., Long-term risk of mortality and other adverse outcomes after acute kidney injury: a systematic review and meta-analysis. Am J Kidney Dis, (6): p Bonventre, J.V. and L. Yang, Cellular pathophysiology of ischemic acute kidney injury. J Clin Invest, (11): p
19 Page 19 of 46 Diabetes 49. Gall, J.M., et al., Role of mitofusin 2 in the renal stress response. PLoS One, (1): p. e Pich, S., et al., The Charcot-Marie-Tooth type 2A gene product, Mfn2, up-regulates fuel oxidation through expression of OXPHOS system. Hum Mol Genet, (11): p Sebastian, D., et al., Mitofusin 2 (Mfn2) links mitochondrial and endoplasmic reticulum function with insulin signaling and is essential for normal glucose homeostasis. Proc Natl Acad Sci U S A, (14): p Westermann, B., Mitochondrial dynamics in model organisms: what yeasts, worms and flies have taught us about fusion and fission of mitochondria. Semin Cell Dev Biol, (6): p FIGURE LEGENDS FIGURE 1. IHG-1 is required for mitochondrial respiration (A) HK2 cells expressing tetracycline-inducible shrnai constructs specific for IHG-1 were cultured in the presence or absence of doxycycline (dox) for 96 hours prior to measurement of oxygen consumption rate (OCR). Black triangles = IHG-1 shrna cell lines dox; black circles= IHG-1 shrna cell lines + dox. Basal respiration and respiratory capacity are shown +/- dox. Line plots represent a single experiment in which triplicate wells were analysed for each cell line and are representative of n=4 (carried out on 4 separate days). Bar charts represent the mean and SEM for n=4. (B) Intracellular ATP levels were measured in cells from A. (C) Whole cell lysates from cells in A were analysed by immunoblotting with antibodies specific for complex II (Succinate dehydrogenase [ubiquinone] iron-sulfur subunit [SDHB]) and complex V (ATP synthase alpha-subunit [ATP5A]) of the mitochondrial electron transport chain. β-actin antibody binding demonstrates equal protein loading. (D) Basal respiration and respiratory capacity were determined for HK2 cells stably overexpressing IHG-1 (open triangles) or control cells (Empty Vector black squares) as in A. *, p<0.05; **, p<0.01; mean ± SEM; n = 4 throughout. FIGURE 2. Altered expression of IHG-1 results in altered mitochondrial morphology. (A) HeLa cells expressing tetracycline-inducible shrnai constructs specific for IHG-1 were transduced with lentiviral vector expressing mtgfp. Cells were then cultured in the absence or presence of 19
20 Diabetes Page 20 of 46 doxycycline (dox) for 96 hours. Representative confocal images of each cell line are shown. Mitochondrial morphology was scored as normal, fragmented, fused or elongated for at least 15 cells for each per experiment. Graphs present the data as the mean and standard error of the mean for 3 independent experiments (n=45). (B) Control HeLa cells (Empty vector) or cells stably overexpressing IHG-1 were transduced with lentiviral vector expressing mtgfp and scored as in A. Representative confocal images are shown for each cell line. Results are presented graphically as the mean and standard error of the mean for 4 independent experiments (n=60). Scale bar, 10 µm. *, p<0.05; mean ± SEM. FIGURE 3. IHG-1 increases mitochondrial fusion. (A) HeLa cells expressing tetracyclineinducible shrnai constructs specific for IHG-1 were transduced with lentiviral vector expressing mtgfp. Cells were cultured in the presence or absence of doxycycline (dox) for 96 hours. Fluorescence recovery after photobleaching (FRAP) assessments were carried out by live cell imaging. Fluorescence recovery was analysed for at least 15 cells for each cell line per experiment. Fluorescence recovery over time is expressed as a percentage of the original fluorescence prior to photobleaching (left panel). For each individual cell assessed the area under the curve (AUC) was calculated and is presented in the right hand panel. Results are presented as the mean and standard error of the mean for 3 independent experiments (n=45). Scale bar, 10 µm. Black triangles = IHG-1 ShRNA cell lines dox; red diamonds = IHG-1 ShRNA cell lines + dox. (B) FRAP assessments were carried out in HeLa cells stably overexpressing either IHG-1 or control cells (Empty Vector) as in A. Results are presented as the mean and standard error of the mean for 3 independent experiments (n=45). Scale bar, 10 µm. Black triangles = EV cell lines; red diamonds = IHG-1 cell lines. (C) Cells from A were transduced with lentiviral vector expressing either mtgfp or mtrfp. GFP and RFP cells for each cell line were co-cultured and fused by incubation with polyethylene glycol (PEG). Mitochondrial fusion, as measured by overlapping RFP and GFP fluorescence, was 20
21 Page 21 of 46 Diabetes assessed over 12 hours. Representative confocal images for each cell line are shown. Scale bar, 20 µm. (D) Cells from B were transduced with lentiviral vector expressing either mtgfp or mtrfp. Mitochondrial fusion was assessed as in C over 10 hours. Representative confocal images for each cell line are shown. Scale bar, 20 µm. *, p<0.05; mean ± SEM; n = 3 throughout. FIGURE 4. IHG-1 binds to Mfn1 and Mfn2. HEK293T cells were co-transfected with IHG-1-V5 and FLAG-Mitofusin 1 (Mfn1) (A), Mitofusin 2 (Mfn2) (B), Dynamin-related protein 1 (Drp1) (C) or Myc-tagged mitochondrial fission protein 1 (Fis1) (D). Binding of proteins was assessed by immunoprecipitation (IP) and Western blotting. (E) Endogenous IHG-1 or Mfn2 was immunoprecipitated from HeLa cells. Co-immunoprecipitation of the alternate protein was assessed by Western blotting. FIGURE 5. IHG-1 must complex with Mfn1 and Mfn2 to increase mitochondrial fusion. (A) HEK293T cells were co-transfected with mts-ihg-1-v5 and either FLAG-tagged- Mfn1 or Mfn2. Binding of proteins was assessed by immunoprecipitation and Western blotting. (B) Fluorescence recovery after photobleaching (FRAP) assessments were carried out in HeLa cells stably overexpressing mts-ihg-1 or control cells (Empty Vector) that were transduced with lentiviral vector expressing mito-gfp. Presentation and analyses of results are as described in 3A. Black triangles = EV cell lines; red diamonds = mts-ihg-1 cell lines. *, p<0.05; mean ± SEM; n = 3 throughout. FIGURE 6. IHG-1 increases Mfn2-GTP binding. (A) HeLa cells expressing tetracyclineinducible shrnai constructs specific for IHG-1 or a scrambled construct (Scr) were cultured in the presence of doxycycline (dox) for 96 hours. Whole cell lysates were incubated with GTP-agarose beads for 2 hours. GTP-bound Mfn2 was assessed by Western blotting. The percentage Mfn2 bound to GTP was calculated based on input samples and is presented as the mean and standard error of 21
22 Diabetes Page 22 of 46 the mean (right panel). (B) Whole cell lysates from HEK293T cells transfected with V5-tagged- IHG-1, mts-ihg-1, IHG-1-D105A or control cells (EV) were assayed as in A. *, p<0.05; **, p<0.01; n = 3 throughout. FIGURE 7. IHG-1 does not alter Ca 2+ levels. (A) Representative recordings of [Ca 2+ ] i mobilisation after passive discharge of endoplasmic reticulum (ER) Ca 2+ stores by tert-buthyl benzohydroquinone (tbubhq); 0.5mM) in HeLa cell lines expressing IHG-1 or shrnai constructs specific for IHG-1 and in control (EV) and scramble shrnai (Scr) cell lines. (B) Bar graph represents the mean and standard error of the mean for 3 independent experiments. There was no significant difference in means. FIGURE 8. IHG-1 protects cells from apoptosis. HeLa cells stably overexpressing IHG-1 or control cells (Empty Vector) were treated with 10 mu/ml glucose oxidase. (A) Apoptotic cells were detected at 24 hours by annexin V/PI staining and analysis by flow cytometry. (B) Mitochondrial membrane potential (MMP) was assessed at 16 hours using TMRE staining and flow cytometric analysis. (C) HeLa cells stably overexpressing IHG-1 or control cells (Empty Vector) were treated with the indicated concentrations of sorbitol. Apoptotic cells were detected at 24 hours by annexin V/PI staining and analysis by flow cytometry. *, p<0.05; **, p<0.01; mean ± SEM; n = 3 throughout. 22
23 Page 23 of 46 Diabetes IHG-1 is required for mitochondrial respiration.


24 Diabetes Page 24 of 46 Altered expression of IHG-1 results in altered mitochondrial morphology.
25 Page 25 of 46 Diabetes IHG-1 increases mitochondrial fusion.


26 Diabetes Page 26 of 46 IHG-1 binds to Mfn1 and Mfn2.
27 Page 27 of 46 Diabetes IHG-1 must complex with Mfn1 and Mfn2 to increase mitochondrial fusion.


28 Diabetes Page 28 of 46 IHG-1 increases Mfn2-GTP binding.


29 Page 29 of 46 Diabetes IHG-1 does not alter Ca2+ levels.


30 Diabetes Page 30 of 46 IHG-1 protects cells from apoptosis.
31 ONLINE SUPPLEMENTAL DATA FIGURE S1. Characterisation of IHG-1 overexpressing and knockdown cell lines. (A) Total cellular RNA was prepared from HeLa cells stably overexpressing IHG-1 or mts-ihg-1. IHG-1 mrna was quantified by real time PCR. Results were normalised to 18srRNA, and are expressed as relative quantification (RQ) versus cells transduced with an Empty Vector (EV). (B) Whole cell lysates from cells in A were analysed by immunoblotting with antibodies specific for V5. (C) Total cellular RNA was prepared from HeLa cells stably expressing tetracycline-inducible shrnai constructs specific for IHG-1 or with a scrambled construct (Scr) cultured in the presence or absence of doxycycline (dox) for 96 hours. IHG-1 mrna was quantified as in A. (D) Whole cell lysates from cells in C were analysed by immunoblotting with antibodies specific for IHG-1. -actin demonstrates equal protein loading. (E) Whole cell lysates from HeLa cells were incubated with GTP-agarose or unbound agarose beads for 2 hours. Mfn2 bound to agarose beads was assessed by Western blotting. FIGURE S2. Doxycycline treatment of cells does not alter mitochondrial morphology or fusion. (A) HeLa cells expressing tetracycline-inducible scrambled shrnai constructs (Scr) were transduced with lentiviral vector expressing mtgfp. Cells were then cultured in the presence or absence of doxycycline (dox) for 96 hours. Representative confocal images of each cell line are shown on the left. Mitochondrial morphology was scored as normal, fragmented, fused or elongated for at least 15 cells for each per experiment. Graphs in the right hand panel present the data as the mean and standard error of the mean for 3 independent experiments (n=45). Black squares= Scr ShRNA cell lines dox; red triangles = Scr ShRNA cell lines + dox. (B) Fluorescence recovery after photobleaching (FRAP) assessments were carried out by live cell imaging of cells in A. Fluorescence recovery was analysed for at least 15 cells for each cell line per experiment. Fluorescence recovery over time is expressed as a percentage of the original fluorescence prior to photobleaching (left panel). For each individual cell assessed the AUC was calculated and is presented in the right hand panel. Results are presented as the mean and standard error of the mean for 3 independent experiments (n=45). Scale bar, 10 µm. (C) Cells from A were transduced with lentiviral vector expressing either mtgfp or mtrfp. GFP and RFP cells for each cell line were co-cultured and fused by incubation with polyethylene glycol (PEG). Mitochondrial fusion, as measured by overlapping RFP and GFP fluorescence, was assessed over 12 hours. Representative confocal images for each cell line are shown. Scale bar, 20 µm. FIGURE S3. Doxycycline treatment of cells does not alter respiration or ATP production. (A) HK2 cells expressing tetracycline-inducible scrambled shrnai constructs (Scr) were cultured in the presence or absence of doxycycline (dox) for 96 hours. Oxygen consumption rate (OCR) was then measured. Basal respiration and respiratory capacity are shown for each cell line. (B) Intracellular ATP levels were measured in cells from A. *, p<0.05; **, p<0.01; mean SEM; n = 4 throughout.
32 FIGURE S4. Altered expression of IHG-1 results in altered mitochondrial morphology. HeLa cells expressing tetracycline-inducible shrnai constructs specific for IHG-1 were transduced with lentiviral vector expressing mtgfp. Cells were then cultured in the absence (A) or presence (B) of doxycycline (dox) for 96 hours. Control HeLa cells (Empty vector) (C) or cells stably overexpressing IHG-1 (D) were transduced with lentiviral vector expressing mtgfp. Ten confocal images of each cell line are shown. FIGURE S5. Loss of IHG-1 expression does not increase mitochondrial association with lysosomes. HeLa cells stably expressing tetracycline-inducible shrnai constructs specific for IHG-1 or with a scrambled construct (Scr) cultured in the presence or absence of doxycycline (dox) for 96 hours were stained with MitoTracker Green and LysoTracker Red (both from Invitrogen). Fluorescence was analysed by confocal microscopy. Apoptosis was induced by treating cells with staurosporine. FIGURE S6. IHG-1 does not alter expression of components of the mitochondrial fusion and fission machinery. (A) Total cellular RNA was prepared from HK2 cells stably expressing tetracycline-inducible shrnai constructs specific for IHG-1 or with a scrambled construct (Scr) cultured in the presence of doxycycline (dox) for 96 hours. Drp-1, Fis1, Mfn1, Mfn2 and OPA1 mrna were quantified by real time PCR. Results were normalised to 18srRNA, and are expressed as relative quantification (RQ) versus cells transduced with a scrambled construct (Scr). (B) Whole cell lysates from cells in A were analysed by immunoblotting with antibodies specific for Mfn1, Mfn2 and Drp-1. (C) Whole cell lysates from HeLa cells stably overexpressing IHG-1 or control cells (EV) were analysed by immunoblotting with antibodies specific for Mfn1, Mfn2 and V5. Actin antibody binding demonstrates equal protein loading. FIGURE S7. IHG-1 increases mitochondrial fusion. HeLa cells expressing tetracycline-inducible shrnai constructs specific for IHG-1 were transduced with lentiviral vector expressing either mtgfp or mtrfp. Cells were cultured in the (A) absence or (B) presence of doxycycline (dox) for 96 hours. GFP and RFP cells for each cell line were co-cultured and fused by incubation with polyethylene glycol (PEG). Mitochondrial fusion, as measured by overlapping RFP and GFP fluorescence, was assessed over 12 hours. Representative confocal images for each cell line are shown. Scale bar, 20 µm. (C) Control HeLa cells (Empty Vector) and cells stably overexpressing (D) IHG-1 were transduced with lentiviral vector expressing either mtgfp or mtrfp. Mitochondrial fusion was assessed as in A and B over 10 hours. Representative confocal images for each cell line are shown. Scale bar, 20 µm. FIGURE S8. IHG-1 protects cells from ROS-induced loss of mitochondrial membrane potential. HeLa cells stably overexpressing IHG-1 or control cells (Empty Vector) were treated with 10 mu/ml glucose oxidase. Mitochondrial
33 membrane potential (MMP) was assessed at 16 hours using JC-1 staining and flow cytometric analysis. *, p<0.05; mean SEM; n = 3. FIGURE S9. Effect of TGF-β1 on the expression of Mfn2, Drp1 and mitochondrial electron transport chain complexes. HK2 cells stably expressing tetracycline-inducible shrnai constructs specific for IHG-1 or with a scrambled construct (Scr) cultured in the presence of doxycycline (dox) for 96 hours were stimulated with TGF-β1 (5ng/ml) for the indicated times. Whole cell lysates were prepared and analysed by immunoblotting with antibodies specific for (A) Mfn2 and Drp1 and (B) complex II (Succinate dehydrogenase [ubiquinone] iron-sulfur subunit [SDHB]) and complex V (ATP synthase alpha-subunit [ATP5A]) of the mitochondrial electron transport chain. Actin antibody binding demonstrates equal protein loading. Alterations in protein expression were analysed by densitometry. Results are shown as the mean +/- SEM for at least 3 independent experiments. Differences in means are not significant. FIGURE S10. IHG-1 binds to Mfn1 and Mfn2. HEK293T cells were co-transfected with IHG-1-V5 and FLAG-Mitofusin 1 (Mfn1) (A), Mitofusin 2 (Mfn2) (B), Dynamin-related protein 1 (Drp1) (C) or Myc-tagged mitochondrial fission protein 1 (Fis1) (D). Binding of proteins was assessed by immunoprecipitation (IP) and Western blotting. Unprocessed images of original Western blot films are shown for Figure 4 A-D along with densitometric analysis. (E) Comparison of levels of IHG- 1 protein co-immunoprecipitated by the indicated proteins. Results are shown as the mean +/- SEM for at least 2 independent experiments. *, p<0.05; **, P<0.01 versus Drp1. +, p<0.05; versus Fis1. FIGURE S11. IHG-1 binds to Mfn1 and Mfn2. (A) Endogenous IHG-1 or Mfn2 was immunoprecipitated from HeLa cells. Co-immunoprecipitation of the alternate protein was assessed by Western blotting. Unprocessed images of original Western blot films are shown for Figure 4 A-D along with densitometric analysis. HEK293T cells were co-transfected with mts-ihg-1-v5 and either FLAG-tagged- Mfn1 (B) or Mfn2 (C). Binding of proteins was assessed by immunoprecipitation and Western blotting. Unprocessed images of original Western blot films are shown for Figure 4 A-D along with densitometric analysis. (D) Comparison of levels of IHG-1 and mts-ihg-1 protein coimmunoprecipitated by the Mfn1 and Mfn2. Results are shown as the mean +/- SEM for at least 2 independent experiments.. *, p<0.05.


34 Diabetes Page 36 of 46 FIGURE S1. Characterisation of IHG-1 overexpressing and knockdown cell lines.


35 Page 37 of 46 Diabetes Doxycycline treatment of cells does not alter mitochondrial morphology or fusion.


36 Diabetes Page 38 of 46 Doxycycline treatment of cells does not alter respiration or ATP production.


37 Page 39 of 46 Diabetes Altered expression of IHG-1 results in altered mitochondrial morphology.


38 Diabetes Page 40 of 46 Loss of IHG-1 expression does not result in increased association of mitochondria and lysosomes


39 Page 41 of 46 Diabetes IHG-1 does not alter expression of components of the mitochondrial fusion and fission machinery.


40 Diabetes Page 42 of 46 IHG-1 increases mitochondrial fusion.
41 Page 43 of 46 Diabetes IHG-1 protects cells from ROS-induced loss of mitochondrial membrane potential.
42 Diabetes Page 44 of 46 Effect of TGF-β1 on the expression of Mfn2, Drp1 and mitochondrial electron transport chain complexes.


43 Page 45 of 46 Diabetes IHG-1 binds to Mfn1 and Mfn2.
Supplementary Figure 1.
 Supplementary Figure 1. Characterisation of IHG-1 overexpressing and knockdown cell lines. (A) Total cellular RNA was prepared from HeLa cells stably overexpressing IHG-1 or mts-ihg-1. IHG-1 mrna was quantified
IHG-1 Increases Mitochondrial Fusion and Bioenergetic Function
 4314 Diabetes Volume 63, December 2014 Fionnuala B. Hickey, 1,2,3 James B. Corcoran, 1,2 Brenda Griffin, 1,4 Una Bhreathnach, 1,2 Heather Mortiboys, 5 Helen M. Reid, 4 Darrell Andrews, 1,4 Shane Byrne,
Supplementary Information
 Supplementary Information MAP2/Hoechst Hyp.-AP ph 6.5 Hyp.-SD ph 7.2 Norm.-SD ph 7.2 Supplementary Figure 1. Mitochondrial elongation in cortical neurons by acidosis. Representative images of neuronal
4) Please cite Dagda et al J Biol Chem 284: , for any publications or presentations resulting from use or modification of the macro.
 Please cite Dagda et al J Biol Chem 284: , for any publications or presentations resulting from use or modification of the macro.") Supplement Figure S1. Algorithmic quantification of mitochondrial morphology in SH- SY5Y cells treated with known fission/fusion mediators. Parental SH-SY5Y cells were transiently transfected with an empty
Supplement Figure S1. Algorithmic quantification of mitochondrial morphology in SH- SY5Y cells treated with known fission/fusion mediators. Parental SH-SY5Y cells were transiently transfected with an empty
Supplemental material
 Supplemental material THE JOURNAL OF CELL BIOLOGY Mourier et al., http://www.jcb.org/cgi/content/full/jcb.201411100/dc1 Figure S1. Size and mitochondrial content in Mfn1 and Mfn2 knockout hearts. (A) Body
Mitochondrial dynamics in ischemia and reperfusion
 Mitochondrial dynamics in ischemia and reperfusion Derek J Hausenloy Reader in Cardiovascular Medicine, British Heart Foundation Senior Clinical Research Fellow, The Hatter Cardiovascular Institute, University
Supplementary Figure 1: To test the role of mir-17~92 in orthologous genetic model of ADPKD, we generated Ksp/Cre;Pkd1 F/F (Pkd1-KO) and Ksp/Cre;Pkd1
 and Ksp/Cre;Pkd1") Supplementary Figure 1: To test the role of mir-17~92 in orthologous genetic model of ADPKD, we generated Ksp/Cre;Pkd1 F/F (Pkd1-KO) and Ksp/Cre;Pkd1 F/F ;mir-17~92 F/F (Pkd1-miR-17~92KO) mice. (A) Q-PCR
Supplementary Figure 1: To test the role of mir-17~92 in orthologous genetic model of ADPKD, we generated Ksp/Cre;Pkd1 F/F (Pkd1-KO) and Ksp/Cre;Pkd1 F/F ;mir-17~92 F/F (Pkd1-miR-17~92KO) mice. (A) Q-PCR
SUPPLEMENTARY INFORMATION
 Cell viability rate 0.8 0.6 0 0.05 0.1 0.2 0.3 0.4 0.5 0.7 1 Exposure duration (s) Supplementary Figure 1. Femtosecond laser could disrupt and turn off GFP without photons at 473 nm and keep cells alive.
Supplementary Figure 1. CoMIC in 293T, HeLa, and HepG2 cells. (a) Mitochondrial morphology in 293T, HeLa and HepG2 cells. Cells were transfected with
 Mitochondrial morphology in 293T, HeLa and HepG2 cells. Cells were transfected with") Supplementary Figure 1. CoMIC in 293T, HeLa, and HepG2 cells. (a) Mitochondrial morphology in 293T, HeLa and HepG2 cells. Cells were transfected with DsRed-mito. Right panels are time-course enlarged images
Supplementary Figure 1. CoMIC in 293T, HeLa, and HepG2 cells. (a) Mitochondrial morphology in 293T, HeLa and HepG2 cells. Cells were transfected with DsRed-mito. Right panels are time-course enlarged images
SUPPLEMENTAL MATERIAL
 SUPPLEMENTAL MATERIAL Figure S1. Mitochondrial morphology in Fis1-null, Mff-null and Fis1/Mff-null MEF cells. (A) Western blotting of lysates from Fis1-null, Mff-null and Fis1/Mff-null cells. Lysates were
09/30/2017. Kyu-Sun Lee, Ph.D. Metabolism & Neurophysiology Research Group Hazard Monitoring BNT Res Center
 09/30/2017 Kyu-Sun Lee, Ph.D. Metabolism & Neurophysiology Research Group Hazard Monitoring BNT Res Center Conflict of interest disclosure None Committee of Scientific Affairs Committee of Scientific Affairs
Measuring Mitochondrial Membrane Potential with JC-1 Using the Cellometer Vision Image Cytometer
 Measuring Mitochondrial Membrane Potential with JC-1 Using the Cellometer Vision Image Cytometer Nexcelom Bioscience LLC. 360 Merrimack Street, Building 9 Lawrence, MA 01843 T: 978.327.5340 F: 978.327.5341
TNFα 18hr. Control. CHX 18hr. TNFα+ CHX 18hr. TNFα: 18 18hr (KDa) PARP. Cleaved. Cleaved. Cleaved. Caspase3. Pellino3 shrna. Control shrna.
 PARP. Cleaved. Cleaved. Cleaved. Caspase3. Pellino3 shrna. Control shrna.") Survival ( %) a. TNFα 18hr b. Control sirna Pellino3 sirna TNFα: 18 18hr c. Control shrna Pellino3 shrna Caspase3 Actin Control d. Control shrna Pellino3 shrna *** 100 80 60 CHX 18hr 40 TNFα+ CHX 18hr
Survival ( %) a. TNFα 18hr b. Control sirna Pellino3 sirna TNFα: 18 18hr c. Control shrna Pellino3 shrna Caspase3 Actin Control d. Control shrna Pellino3 shrna *** 100 80 60 CHX 18hr 40 TNFα+ CHX 18hr
SUPPLEMENTARY INFORMATION
 DOI: 10.1038/ncb2362 Figure S1 CYLD and CASPASE 8 genes are co-regulated. Analysis of gene expression across 79 tissues was carried out as described previously [Ref: PMID: 18636086]. Briefly, microarray
Supplemental Figures S1 S5
 Beyond reduction of atherosclerosis: PON2 provides apoptosis resistance and stabilizes tumor cells Ines Witte (1), Sebastian Altenhöfer (1), Petra Wilgenbus (1), Julianna Amort (1), Albrecht M. Clement
Mitochondrial Dynamics Is a Distinguishing Feature of Skeletal Muscle Fiber Types and Regulates Organellar Compartmentalization
 Cell Metabolism Supplemental Information Mitochondrial Dynamics Is a Distinguishing Feature of Skeletal Muscle Fiber Types and Regulates Organellar Compartmentalization Prashant Mishra, Grigor Varuzhanyan,
Delivery. Delivery Processes. Delivery Processes: Distribution. Ultimate Toxicant
 Delivery Ultimate Toxicant The chemical species that reacts with the endogenous target. Toxicity depends on the concentration (dose) of the ultimate toxicant at the target site Delivery Processes Absorption
What are mitochondria?
 What are mitochondria? What are mitochondria? An intracellular organelle. There are 100 to 1000s of mitochondria/cell. Most mitochondria come from the mother. Mitochondria have their own DNA Mitochondria
Supplemental Information. The Mitochondrial Fission Receptor MiD51. Requires ADP as a Cofactor
 Structure, Volume 22 Supplemental Information The Mitochondrial Fission Receptor MiD51 Requires ADP as a Cofactor Oliver C. Losón, Raymond Liu, Michael E. Rome, Shuxia Meng, Jens T. Kaiser, Shu-ou Shan,
Mitochondrial Membrane Potential by Object Spot Counting
 A p p l i c a t i o n N o t e Mitochondrial Membrane Potential by Object Spot Counting Using Gen5 to Analyze Mitochondrial Membrane Potential Sarah Beckman, PhD, Principal Scientist, BioTek Instruments,
Richik N. Ghosh, Linnette Grove, and Oleg Lapets ASSAY and Drug Development Technologies 2004, 2:
 1 3/1/2005 A Quantitative Cell-Based High-Content Screening Assay for the Epidermal Growth Factor Receptor-Specific Activation of Mitogen-Activated Protein Kinase Richik N. Ghosh, Linnette Grove, and Oleg
Mitochondrial Biogenesis is the process by which new mitochondria are formed in the cell.
 Mitochondrial Biogenesis is the process by which new mitochondria are formed in the cell. Purpose of Mitochondria: The mitochondria are organelles within the cell that are responsible for the biochemical
Toxicological Targets. Russell L. Carr Department of Basic Sciences College of Veterinary Medicine
 Toxicological Targets Russell L. Carr Department of Basic Sciences College of Veterinary Medicine Toxicology Definitions = study of poisons Poison = any agent capable of producing a deleterious response
Supporting Information
 Supporting Information Wang et al. 10.1073/pnas.0804871105 SI Materials and Methods Cell Culture and Transfection. Human neuroblastoma M17 cells were grown as described before (1). Transfection was performed
Figure S1: Extracellular nicotinic acid, but not tryptophan, is sufficient to maintain
 SUPPLEMENTAL INFORMATION Supplemental Figure Legends Figure S1: Extracellular nicotinic acid, but not tryptophan, is sufficient to maintain mitochondrial NAD +. A) Extracellular tryptophan, even at 5 µm,
DOWNLOAD OR READ : MITOCHONDRIAL FUNCTION AND DYSFUNCTION PDF EBOOK EPUB MOBI
 DOWNLOAD OR READ : MITOCHONDRIAL FUNCTION AND DYSFUNCTION PDF EBOOK EPUB MOBI Page 1 Page 2 mitochondrial function and dysfunction mitochondrial function and dysfunction pdf mitochondrial function and
13-3. Synthesis-Secretory pathway: Sort lumenal proteins, Secrete proteins, Sort membrane proteins
 13-3. Synthesis-Secretory pathway: Sort lumenal proteins, Secrete proteins, Sort membrane proteins Molecular sorting: specific budding, vesicular transport, fusion 1. Why is this important? A. Form and
Reception The target cell s detection of a signal coming from outside the cell May Occur by: Direct connect Through signal molecules
 Why Do Cells Communicate? Regulation Cells need to control cellular processes In multicellular organism, cells signaling pathways coordinate the activities within individual cells that support the function
7.06 Cell Biology EXAM #3 April 21, 2005
 7.06 Cell Biology EXAM #3 April 21, 2005 This is an open book exam, and you are allowed access to books, a calculator, and notes but not computers or any other types of electronic devices. Please write
Analyzing Microgram Quantities of Isolated Mitochondria in the Agilent Seahorse XFe/XF24 Analyzer
 Analyzing Microgram Quantities of Isolated Mitochondria in the Agilent Seahorse XFe/XF24 Analyzer Application Note Introduction Enhanced appreciation of the role of altered mitochondrial function in tumorigenesis,
Plant mitochondrial dynamics
 Plant mitochondrial dynamics Peroxisome Chloroplast Nucleus Mitochondria from Alberts et al. 1994 Living Arabidopsis leaf 10 µm Logan & Leaver (2000) Journal of Experimental Botany, 51: 865-871 5 µm S.
Supplementary Figure 1
 Supplementary Figure 1 Supplementary Figure 1. HSP21 expression in 35S:HSP21 and hsp21 knockdown plants. (a) Since no T- DNA insertion line for HSP21 is available in the publicly available T-DNA collections,
SUPPLEMENTARY INFORMATION
 DOI: 10.1038/ncb2647 Figure S1 Other Rab GTPases do not co-localize with the ER. a, Cos-7 cells cotransfected with an ER luminal marker (either KDEL-venus or mch-kdel) and mch-tagged human Rab5 (mch-rab5,
Frontiers in CardioVascular Biology
 Frontiers in CardioVascular Biology Young Investigator Award Mitofusin 2 controls calcium transmission between the SR and mitochondria and regulates the bioenergetic feedback response in cardiac myocytes
Cardiolipin Remodeling by ALCAT1 Regulates Dilated Cardiomyopathy Through Oxidative Stress and Mitophagy. Yuguang (Roger) Shi
 Shi") Cardiolipin Remodeling by ALCAT1 Regulates Dilated Cardiomyopathy Through xidative Stress and Mitophagy Yuguang (Roger) Shi yus11@psu.eud Cardiolipin Biosynthetic and Remodeling Pathways Phosphatidic Acid
Cardiolipin Remodeling by ALCAT1 Regulates Dilated Cardiomyopathy Through xidative Stress and Mitophagy Yuguang (Roger) Shi yus11@psu.eud Cardiolipin Biosynthetic and Remodeling Pathways Phosphatidic Acid
Supporting Information
 Supporting Information Development of a mitochondriotropic antioxidant based on caffeic acid: proof of concept on cellular and mitochondrial oxidative stress models José Teixeira a,b, Fernando Cagide a,
MITOCHONDRIAL BIOGENESIS AND REDOX REGULATION
 MITOCHONDRIAL BIOGENESIS AND REDOX Claude A. Piantadosi, MD Professor of Medicine and Pathology Duke University Medical Center Durham, N.C. USA Objectives Provide an overview of the physiological and pathological
FSC-W FSC-H CD4 CD62-L
 Supplementary Fig. 1 a SSC-A FSC-A FSC-W FSC-H SSC-W SSC-H CD4 CD62-L b SSC-A FSC-A FSC-W FSC-A FSC-A 7-AAD FSC-A CD4 IL-9 CD4 c SSC-A FSC-A FSC-W FSC-H SSC-W SSC-H 7-AAD KI67 Annexin-V 7-AAD d I L -5
Types of biological networks. I. Intra-cellurar networks
 Types of biological networks I. Intra-cellurar networks 1 Some intra-cellular networks: 1. Metabolic networks 2. Transcriptional regulation networks 3. Cell signalling networks 4. Protein-protein interaction
M i t o c h o n d r i a
 M i t o c h o n d r i a Dr. Diala Abu-Hassan School of Medicine dr.abuhassand@gmail.com Mitochondria Function: generation of metabolic energy in eukaryotic cells Generation of ATP from the breakdown of
Signal Transduction. Dr. Chaidir, Apt
 Signal Transduction Dr. Chaidir, Apt Background Complex unicellular organisms existed on Earth for approximately 2.5 billion years before the first multicellular organisms appeared.this long period for
Mitochondria associate with the cytoskeleton. Figure 14-5 Molecular Biology of the Cell ( Garland Science 2008)
") Mitochondria associate with the cytoskeleton Figure 14-5 Molecular Biology of the Cell ( Garland Science 2008) Special arrangements of mitochondria Figure 14-6 Molecular Biology of the Cell ( Garland Science
Mitochondria associate with the cytoskeleton Figure 14-5 Molecular Biology of the Cell ( Garland Science 2008) Special arrangements of mitochondria Figure 14-6 Molecular Biology of the Cell ( Garland Science
Which row in the chart correctly identifies the functions of structures A, B, and C? A) 1 B) 2 C) 3 D) 4
 1 B) 2 C) 3 D) 4") 1. What is a similarity between all bacteria and plants? A) They both have a nucleus B) They are both composed of cells C) They both have chloroplasts D) They both lack a cell wall 2. Which statement is
1. What is a similarity between all bacteria and plants? A) They both have a nucleus B) They are both composed of cells C) They both have chloroplasts D) They both lack a cell wall 2. Which statement is
Hydrogen Peroxide Colorimetric Detection Kit
 Hydrogen Peroxide Colorimetric Detection Kit Catalog Number KA1017 96 assays Version: 06 Intended for research use only www.abnova.com Table of Contents Introduction... 3 Background... 3 Principle of the
Scale in the biological world
 Scale in the biological world 2 A cell seen by TEM 3 4 From living cells to atoms 5 Compartmentalisation in the cell: internal membranes and the cytosol 6 The Origin of mitochondria: The endosymbion hypothesis
S1 Gene ontology (GO) analysis of the network alignment results
 analysis of the network alignment results") 1 Supplementary Material for Effective comparative analysis of protein-protein interaction networks by measuring the steady-state network flow using a Markov model Hyundoo Jeong 1, Xiaoning Qian 1 and
1 Supplementary Material for Effective comparative analysis of protein-protein interaction networks by measuring the steady-state network flow using a Markov model Hyundoo Jeong 1, Xiaoning Qian 1 and
Introduction. Gene expression is the combined process of :
 1 To know and explain: Regulation of Bacterial Gene Expression Constitutive ( house keeping) vs. Controllable genes OPERON structure and its role in gene regulation Regulation of Eukaryotic Gene Expression
Lipid transfer proteins confer resistance to trichothecenes
 Lipid transfer proteins confer resistance to trichothecenes John McLaughlin and Anwar Bin-Umer Tumer Laboratory National Fusarium Head Blight Forum December 6th, 2012 FY09-11: Identify trichothecene resistance
Arabidopsis PPR40 connects abiotic stress responses to mitochondrial electron transport
 Ph.D. thesis Arabidopsis PPR40 connects abiotic stress responses to mitochondrial electron transport Zsigmond Laura Supervisor: Dr. Szabados László Arabidopsis Molecular Genetic Group Institute of Plant
Mitochondrie et muscle lisse. Vladimir Veksler
 Mitochondrie et muscle lisse Vladimir Veksler Main mitochonrial functions Energy production ATP consumption rate in smooth and striated muscle smooth muscle striated (cardiac) muscle at rest 30 µmol/min/g
Energy Converion: Mitochondria and Chloroplasts. Pınar Tulay, Ph.D.
 Energy Converion: Mitochondria and Chloroplasts Pınar Tulay, Ph.D. pintulay@gmail.com Energy Conversion Prokaryotes use plasma membrane to produce adenosine triphosphate (ATP) used in the cell function
Effect of enzyme deficiencies on oxidative phosphorylation: from isolated mitochondria to intact tissues. Theoretical studies.
 Effect of enzyme deficiencies on oxidative phosphorylation: from isolated mitochondria to intact tissues. Theoretical studies. Bernard Korzeniewski Institute of Molecular Biology and Biotechnology, Jagiellonian
Lecture 10: Cyclins, cyclin kinases and cell division
 Chem*3560 Lecture 10: Cyclins, cyclin kinases and cell division The eukaryotic cell cycle Actively growing mammalian cells divide roughly every 24 hours, and follow a precise sequence of events know as
Under the Radar Screen: How Bugs Trick Our Immune Defenses
 Under the Radar Screen: How Bugs Trick Our Immune Defenses Session 2: Phagocytosis Marie-Eve Paquet and Gijsbert Grotenbreg Whitehead Institute for Biomedical Research Salmonella Gram negative bacteria
The Mitochondrion. Definition Structure, ultrastructure Functions
 The Mitochondrion Definition Structure, ultrastructure Functions Organelle definition Etymology of the name Carl Benda (1903): (mitos) thread; (khondrion) granule. Light microscopy identification First
Analyzing microgram quantities of isolated mitochondria in the XF24 Analyzer
 Technical Brief Analyzing microgram quantities of isolated mitochondria in the XF24 Analyzer George Rogers, PhD, Seahorse Bioscience Anne Murphy, PhD, University of California, San Diego Alvaro Elorza,
CELB40060 Membrane Trafficking in Animal Cells. Prof. Jeremy C. Simpson. Lecture 2 COPII and export from the ER
 CELB40060 Membrane Trafficking in Animal Cells Prof. Jeremy C. Simpson Lecture 2 COPII and export from the ER Today s lecture... The COPII coat - localisation and subunits Formation of the COPII coat at
Mitofusin 1 and 2 play distinct roles in mitochondrial fusion reactions via GTPase activity
 Research Article 6535 Mitofusin 1 and 2 play distinct roles in mitochondrial fusion reactions via GTPase activity Naotada Ishihara, Yuka Eura and Katsuyoshi Mihara* Department of Molecular Biology, Graduate
Biological Process Term Enrichment
 Biological Process Term Enrichment cellular protein localization cellular macromolecule localization intracellular protein transport intracellular transport generation of precursor metabolites and energy
Chapter 5 Ground Rules of Metabolism Sections 1-5
 Chapter 5 Ground Rules of Metabolism Sections 1-5 5.1 A Toast to Alcohol Dehydrogenase In the liver, the enzyme alcohol dehydrogenase breaks down toxic ethanol to acetaldehyde, an organic molecule even
Biology. Mrs. Michaelsen. Types of cells. Cells & Cell Organelles. Cell size comparison. The Cell. Doing Life s Work. Hooke first viewed cork 1600 s
 Types of cells bacteria cells Prokaryote - no organelles Cells & Cell Organelles Doing Life s Work Eukaryotes - organelles animal cells plant cells Cell size comparison Animal cell Bacterial cell most
13. The diagram below shows two different kinds of substances, A and B, entering a cell.
 Name 1. In the binomial system of nomenclature, which two classification groups provide the scientific name of an organism? A) kingdom and phylum B) phylum and species C) kingdom and genus D) genus and
Lecture 7 Cell Biolog y ٢٢٢ ١
 Lecture 7 ١ Mitochondria ٢ Mitochondria Mitochondria are the energy factories of the cells. The energy currency for the work that animals must do is the energy-rich molecule adenosine triphosphate (ATP).
GO ID GO term Number of members GO: translation 225 GO: nucleosome 50 GO: calcium ion binding 76 GO: structural
 GO ID GO term Number of members GO:0006412 translation 225 GO:0000786 nucleosome 50 GO:0005509 calcium ion binding 76 GO:0003735 structural constituent of ribosome 170 GO:0019861 flagellum 23 GO:0005840
Role of Mitochondrial Remodeling in Programmed Cell Death in
 Developmental Cell, Vol. 12 Supplementary Data Role of Mitochondrial Remodeling in Programmed Cell Death in Drosophila melanogaster Gaurav Goyal, Brennan Fell, Apurva Sarin, Richard J. Youle, V. Sriram.
Mitochondria Mitochondria were first seen by kollicker in 1850 in muscles and called them sarcosomes. Flemming (1882) described these organelles as
 described these organelles as") Mitochondria Mitochondria were first seen by kollicker in 1850 in muscles and called them sarcosomes. Flemming (1882) described these organelles as filia Altmann (1890) observed these structures and named
Mitochondria Mitochondria were first seen by kollicker in 1850 in muscles and called them sarcosomes. Flemming (1882) described these organelles as filia Altmann (1890) observed these structures and named
Reconstructing Mitochondrial Evolution?? Morphological Diversity. Mitochondrial Diversity??? What is your definition of a mitochondrion??
 Reconstructing Mitochondrial Evolution?? What is your definition of a mitochondrion?? Morphological Diversity Mitochondria as we all know them: Suprarenal gland Liver cell Plasma cell Adrenal cortex Mitochondrial
Regulation and signaling. Overview. Control of gene expression. Cells need to regulate the amounts of different proteins they express, depending on
 Regulation and signaling Overview Cells need to regulate the amounts of different proteins they express, depending on cell development (skin vs liver cell) cell stage environmental conditions (food, temperature,
The University of Jordan. Accreditation & Quality Assurance Center. COURSE Syllabus
 The University of Jordan Accreditation & Quality Assurance Center COURSE Syllabus 1 Course title Principles of Genetics and molecular biology 2 Course number 0501217 3 Credit hours (theory, practical)
Plant and animal cells (eukaryotic cells) have a cell membrane, cytoplasm and genetic material enclosed in a nucleus.
 have a cell membrane, cytoplasm and genetic material enclosed in a nucleus.") 4.1 Cell biology Cells are the basic unit of all forms of life. In this section we explore how structural differences between types of cells enables them to perform specific functions within the organism.
4.1 Cell biology Cells are the basic unit of all forms of life. In this section we explore how structural differences between types of cells enables them to perform specific functions within the organism.
Jordan University of Science & Technology. Faculty of Arts and Sciences. Department of Applied Biological Sciences
 Jordan University of Science & Technology Faculty of Arts and Sciences Department of Applied Biological Sciences Course Title Title & Instructor General Biology Course Number BIO 104 Instructor Office
Supplementary Materials for
 www.sciencemag.org/cgi/content/full/science.1243417/dc1 Supplementary Materials for Circadian Clock Cycle Drives Mitochondrial Oxidative Metabolism in Mice Clara Bien Peek, Alison H. Affinati, Kathryn
Biology September 2015 Exam One FORM G KEY
 Biology 251 17 September 2015 Exam One FORM G KEY PRINT YOUR NAME AND ID NUMBER in the space that is provided on the answer sheet, and then blacken the letter boxes below the corresponding letters of your
Biology September 2015 Exam One FORM W KEY
 Biology 251 17 September 2015 Exam One FORM W KEY PRINT YOUR NAME AND ID NUMBER in the space that is provided on the answer sheet, and then blacken the letter boxes below the corresponding letters of your
ATP Fluorometric/Colorimetric Assay Kit
 ATP Fluorometric/Colorimetric Assay Kit Catalog No. KM0028 Detection and Quantification of ATP Concentrations in Biological Samples. Research Purposes Only. Not Intended for Diagnostic or Clinical Procedures.
Time allowed: 2 hours Answer ALL questions in Section A, ALL PARTS of the question in Section B and ONE question from Section C.
 UNIVERSITY OF EAST ANGLIA School of Biological Sciences Main Series UG Examination 2015-2016 FUNDAMENTALS OF CELL BIOLOGY AND BIOCHEMISTRY BIO-4004B Time allowed: 2 hours Answer ALL questions in Section
Intracellular GSH Assay Kit
 ab112132 Intracellular GSH Assay Kit Instructions for Use For detecting Intracellular GSH in cells by using our proprietary green fluorescence probe This product is for research use only and is not intended
Dominika Malińska. Laboratory of Bioenergetics and Biomembranes, Nencki Institute of Experimental Biology, Polish Academy of Sciences
 2007 2013 m. Žmogiškųjų išteklių plėtros veiksmų programos 3 prioriteto Tyrėjų gebėjimų stiprinimas VP1-3.1-ŠMM-05-K priemonės MTTP tematinių tinklų, asociacijų veiklos stiprinimas projektas Lietuvos Biochemikų
Supplementary Figure 1. Biochemical and sequence alignment analyses the
 Supplementary Figure 1. Biochemical and sequence alignment analyses the interaction of OPTN and TBK1. (a) Analytical gel filtration chromatography analysis of the interaction between TBK1 CTD and OPTN(1-119).
Sara Khraim. Shaymaa Alnamos ... Dr. Nafeth
 10 Sara Khraim Shaymaa Alnamos... Dr. Nafeth *Requirement of oxidative phosphorylation: 1- Source and target for electrons(nadh+fadh2 >> O2). 2- Electron carriers. 3- Enzymes, like oxidoreductases and
SUPPLEMENTARY INFORMATION
 DOI:.38/ncb97 P ( μm, hours) 1 2 4 P DMSO Figure S1 unningham et al. E 97 65 27 MFN1 GFP-Parkin Opa1 ctin GPDH HEK293 GFP-Parkin 19 115 97 65 27 Mitochondrial Fraction SH-SY5Y GFP-Parkin Mito DMSO Mito
What Organelle Makes Proteins According To The Instructions Given By Dna
 What Organelle Makes Proteins According To The Instructions Given By Dna This is because it contains the information needed to make proteins. assemble enzymes and other proteins according to the directions
Unit 1 Cell Biology Topic 1: Cell Structure
 Unit 1 Cell Biology Topic 1: Cell Structure Lesson 1.1.1 I will know I am successful if I can: 1. Label all parts of plant and animal cells and state their functions 2. State the differences between plant
TCA Cycle. Voet Biochemistry 3e John Wiley & Sons, Inc.
 TCA Cycle Voet Biochemistry 3e Voet Biochemistry 3e The Electron Transport System (ETS) and Oxidative Phosphorylation (OxPhos) We have seen that glycolysis, the linking step, and TCA generate a large number
PREREQUISITE CHECKLIST
 PREREQUISITE CHECKLIST UNIVERSITY OF CALIFORNIA, BERKELEY SCHOOL OF OPTOMETRY ADMISSIONS AND STUDENT AFFAIRS OFFICE Name: Date: Email: Status (complete, in progress, or planned) Prerequisite Course Requirements
MITOHEALTH Nordic Centre of Excellence Workshop in: Mitochondrial function and metabolic diseases
 MITOHEALTH Nordic Centre of Excellence Workshop in: Mitochondrial function and metabolic diseases Quantitative multi-parameter microscopy of mitochondrial function in living cells Werner J.H. Koopman,
Protein kinase C- activation promotes recovery of mitochondrial function and cell survival following oxidant injury in renal cells
 Am J Physiol Renal Physiol 303: F515 F526, 2012. First published June 6, 2012; doi:10.1152/ajprenal.00072.2012. Protein kinase C- activation promotes recovery of mitochondrial function and cell survival
Study Guide 11 & 12 MULTIPLE CHOICE. Choose the one alternative that best completes the statement or answers the question.
 Study Guide 11 & 12 MULTIPLE CHOICE. Choose the one alternative that best completes the statement or answers the question. 1) The receptors for a group of signaling molecules known as growth factors are
Cells to Tissues. Peter Takizawa Department of Cell Biology
 Cells to Tissues Peter Takizawa Department of Cell Biology From one cell to ensembles of cells. Multicellular organisms require individual cells to work together in functional groups. This means cells
Cells & Cell Organelles. Doing Life s Work
 Cells & Cell Organelles Doing Life s Work Types of cells bacteria cells Prokaryote Eukaryotes animal cells plant cells Cell size comparison Animal cell Bacterial cell most bacteria 1-10 microns eukaryotic
Importance of Protein sorting. A clue from plastid development
 Importance of Protein sorting Cell organization depend on sorting proteins to their right destination. Cell functions depend on sorting proteins to their right destination. Examples: A. Energy production
Fluoro NADP/NADPH Fluorescent NADP/NADPH Detection Kit
 Fluoro NADP/NADPH Fluorescent NADP/NADPH Detection Kit Contact Information Address Telephone Toll Free Fax General Information Sales Technical Questions Website Cell Technology Inc 950 Rengstorff Ave Suite
Life of the Cell. Learning Objectives
 Life of the Cell Society on a micro-scale 1 Learning Objectives 1. What are the characteristics that distinguish prokaryotic and eukaryotic cells? Which type of cell is believed to be older (more primitive)?
7.06 Problem Set
 7.06 Problem Set 5 -- 2006 1. In the first half of the course, we encountered many examples of proteins that entered the nucleus in response to the activation of a cell-signaling pathway. One example of
For the rapid, sensitive and accurate detection of active Caspase 9 in living cells
 ab65615 Caspase 9 (active) FITC Staining Kit Instructions for Use For the rapid, sensitive and accurate detection of active Caspase 9 in living cells This product is for research use only and is not intended
16 The Cell Cycle. Chapter Outline The Eukaryotic Cell Cycle Regulators of Cell Cycle Progression The Events of M Phase Meiosis and Fertilization
 The Cell Cycle 16 The Cell Cycle Chapter Outline The Eukaryotic Cell Cycle Regulators of Cell Cycle Progression The Events of M Phase Meiosis and Fertilization Introduction Self-reproduction is perhaps
WHAT REGULATES RESPIRATION IN MITOCHONDRIA?
 Vol. 39, No. 2, May 1996 BIOCHEMISTRY and MOLECULAR BIOLOGY INTERNATIONAL Pages 415-4 ] 9 WHAT REGULATES RESPIRATION IN MITOCHONDRIA? Bernard Korzeniewski Institute of Molecular Biology, Jagiellonian University,
Principles of Cellular Biology
 Principles of Cellular Biology آشنایی با مبانی اولیه سلول Biologists are interested in objects ranging in size from small molecules to the tallest trees: Cell Basic building blocks of life Understanding
T HE C ELL C H A P T E R 1 P G. 4-23
 T HE C ELL C H A P T E R 1 P G. 4-23 A CELL IS THE SMALLEST LIVING UNIT KNOWN. IT IS OFTEN CALLED THE BUILDING BLOCK OF THE BODY, AND IS THE BASIC STRUCTURAL AND FUNCTIONAL UNIT OF AN ORGANISM. CELL THEORY
Midterm Review Guide. Unit 1 : Biochemistry: 1. Give the ph values for an acid and a base. 2. What do buffers do? 3. Define monomer and polymer.
 Midterm Review Guide Name: Unit 1 : Biochemistry: 1. Give the ph values for an acid and a base. 2. What do buffers do? 3. Define monomer and polymer. 4. Fill in the Organic Compounds chart : Elements Monomer