CRUISE REPORT. USCGC Icebreaker Healy (WAGB-20)
|
|
|
- Jean Carroll
- 5 years ago
- Views:
Transcription


1 CRUISE REPORT USCGC Icebreaker Healy (WAGB-20) U.S. Law of the Sea cruise to map the foot of the slope and 2500-m isobath of the US Arctic Ocean margin CRUISE HEALY 1102 August 15 to September 28, 2011 Barrow, AK to Dutch Harbor, AK Larry A. Mayer Center for Coastal and Ocean Mapping/Joint Hydrographic Center University of New Hampshire Durham, NH Andrew A. Armstrong National Oceanic and Atmospheric Administration Joint Hydrographic Center University of New Hampshire Durham, NH September 28, 2011
2 HLY1102 Cruise Report Table of Contents Introduction and Background... 3 HEALY-1102 Cruise Overview Scientific Party Science Systems Report Chief Scientist Log CTD Log XBT Log APPENDIX A USN METOC Operations Log APPENDIX B National Ice Center Report APPENDIX C GeoCamera Project APPENDIX D Ocean Acidification Report APPENDIX E UAS Post Deployment Report APPENDIX F Marine Mammal Observations APPENDIX G Bird Report APPENDIX H Description of Data Formats
3 INTRODUCTION and BACKGROUND HEALY-1102 was part of a two-ship, joint U.S./Canadian expedition designed to collect multi-channel seismic and bathymetric data needed by both nations for the determination of those areas of the Arctic Ocean that may potentially qualify for an extended continental shelf under Article 76 of the Convention on the Law of the Sea (UNCLOS). HEALY 1102 is the eighth in a series of HEALY cruises dedicated to extended continental shelf mapping. Four of these cruises (HEALY-0302, HEALY- 0405, and HEALY-0703, HEALY-0805) were single-ship operations led by scientists from the University of New Hampshire that focused on the collection of multibeam echosounder bathymetric, and shallow, high-resolution chirp subbottom profiler data. In 2008 there was a second HEALY cruise (HEALY-0806). led by scientists from the U.S. Geological Survey that worked together with the Canadian icebreaker Louis S. St. Laurent (LSSL) to collect multi-channel seismic and multibeam echo-sounder data in the ice-covered regions. The success of the 2008 two ship operation led to a second two-ship operation, HEALY-0905, in 2009 and a third HEALY-1002 in HEALY-1102 represents to fourth of these joint operations. This report focuses on the results of the Healy component of the expedition; for details of the Louis S. St. Laurent program please see Mosher et al, Under Article 76 of UNCLOS, coastal states may, under certain circumstances gain sovereign rights over the resources of the seafloor and subsurface of submerged extensions of their continental margin beyond the recognized 200 nautical mile limit of their Exclusive Economic Zone. The United States has not yet acceded to the UNCLOS. However, increasing recognition that implementation of Article 76 could confer sovereign rights to large and potentially resource-rich areas of the seabed and subsurface beyond its current 200 nautical mile (nmi) limit has renewed interest in the potential for accession to the treaty. The Convention on the Law of the Sea defines the conditions under which a coastal state may extend its continental shelf over regions beyond the 200 nmi EEZ (UN, 1982). These conditions involve the definition of a juridical or legal continental shelf that differs significantly from standard morphological descriptions of continental margins. A key element of this definition is the demonstration that the extended area is a natural prolongation of the nation s landmass. There are no explicit guidelines for demonstration of natural prolongation of a state s land territory. The determination must be based on a general knowledge and interpretation of the bathymetry, geology, and nature of the seafloor in a region. Once a natural prolongation is demonstrated, a coastal state may extend their continental shelf beyond the 200 nmi limit based on either of two formulae. The distance formula allows an extension of the shelf to a line that is 60 nmi beyond the foot of the continental slope (defined to be the point of maximum change in gradient at its base).this line is known as the Hedberg Line. The sediment thickness formula allows the extension of the shelf to a point where the sediment thickness is 1 percent of the distance back to the foot of the slope. This line is known as the Gardiner Line. Whichever formula
4 line is most advantageous to the coastal state may be used and they can be combined for the most advantageous extension. There are limits to the extension (limit lines) the ECS shall not extend beyond 100 nmi from the 2500 m isobath or not beyond 350 nmi from the territorial baseline (the officially defined shoreline). Again these limit lines can be mixed in whatever way is most advantageous to the coastal state. Thus the definition of the extended continental shelf under UNCLOS Article 76 is based on a combination of bathymetric data (defining the 2500 m contour and the foot of the slope) and geophysical data (defining the thickness of sediment). When a nation accedes to the Law of the Sea Treaty, it has 10 years to submit all data and evidence supporting its submission to the Commission on the Limits of the Continental Shelf (CLCS) who evaluate the veracity of the submission and offer recommendations on it. The largest potential for an extended continental shelf beyond the current 200 nmi limit of the U.S. EEZ is found in the area of the Chukchi Borderland, a tightly clustered group of generally high-standing, N-S-trending bathymetric elevations that form a natural prolongation from the Chukchi Shelf north of Alaska. The Chukchi Borderland juts out between eastern Siberia and western Alaska into the deep Amerasia Basin north of the Chukchi Sea. The borderland occupies a rectangular area about 600 by 700 km, or some 4 percent of the Arctic Ocean. This area encompasses three, approximately north-south-trending segmented topographic highs: the Northwind Ridge, the Chukchi Cap and Rise, and the western (Arlis, Sargo, and T3) plateaus (which are located beyond (westward of) the agreed boundary line with Russia). The plateau-like crests of the Chukchi Borderland rise, in some cases, as much as 3,400 m above their surroundings and they are relatively shallow (depths between 246 and 1,000 m). The ridges have steep flanks, which in some places exhibit remarkable linearity over hundreds of kilometers, especially along the east side of the Northwind Ridge. Between these ridges lie the Northwind, Chukchi, and Mendeleyev abyssal plains. These lie at depths between 2,100 and 3,850 m Congress (through NOAA) funded the University of New Hampshire s Center for Coastal and Ocean Mapping/Joint Hydrographic Center (CCOM/JHC) to explore the feasibility of using a multibeam sonar-equipped ice breaker to collect the data needed to make a submission for and extended continental shelf in ice-covered regions of the Arctic. This was in recognition of the fact that a submission for an ECS under Article 76 must be substantiated by high-quality bathymetric and geophysical data, and that the existing bathymetric database in the Arctic is, in many areas, inadequate. The USCGC Healy (WAGB-20), originally equipped with a SeaBeam 2112 (12 khz, 121 beam) swath mapping system and now equipped with a Kongsberg EM122 (12 khz, 288 beam) multibeam echosounder, was chosen for this task. The HEALY also operates a Knudsen 320B shallow penetration chirp subbottom profiler. The multibeam echo-sounder and chirp subbottom data provided by the Healy systems provides the morphological data required to establish the foot of the slope (needed for the determination of the the Hedberg Line, the Gardiner Line and the 2500 m contour).
5 The seismic system on the Louis S. St. Laurent provides sediment thickness information required for establishing the Gardiner Line (once the foot of the slope is determined. Previous Cruises: (Detailed cruise reports from each of these cruises can be found at or USGS websites). HEALY 0302 Overview: A 10 day, 3000 km long exploratory mission (HEALY-0302, September 1-11, 2003) from Barrow, Alaska, to the Chukchi Borderland demonstrated the viability of using the multibeam echo-sounder in ice-covered waters to follow specific bathymetric targets. The 2003 cruise began at the US-Russian boundary line at 78-30'N 'W and followed the 2500 m contour around to 78-35'N 'W (Figure 1). The cruise collected ~3000 km of high-resolution multibeam echo-sounder data and made several significant discoveries that include: substantially changing the mapped position and complexity of the 2500-m isobath (a critical component of a Law of the Sea submission for an ECS), found further evidence for pervasive ice and current erosion in deep water (flutes and scours), finding evidence for gas-related features (pock-marks), and discovering a previously unmapped seamount that rises more than 3000 m above the surrounding seafloor. This NE-SW trending feature, some 18 km wide and 40 km long with a slightly concave and northward tilted crest, has been officially named Healy Seamount. The full cruise report for HEALY-0302 can be found at

6 Figure 1. Track of HEALY-0302 September HEALY-0405 Overview: In 2004 a second, 20-day cruise, HEALY-0405 was conducted from October 6 to October 26, 2004, originating in Nome and ending in Barrow, Alaska. The cruise covered approximately 6700 km in 20 days and completed most of the mapping of the 2500-m isobath (begun on HEALY-0302) as well as a detailed survey of the foot of the slope over a segment of the continental margin east of Barrow, AK. The total area surveyed during HE-0405 was approximately 20,000 sq. km (5830 sq. nmi). The cruise transited northward from Nome over the Northwind Ridge until it intersected the 2500-m isobath at approximately N, 154 W, the point where the 350 nmi cutoff limit from the coast of northern Alaska intersects the 2500-m isobath on the eastern flank of the Northwind Ridge. Ice was first encountered ice at about 76 N and by 77 N the ice was very heavy (9/10 to 10/10) with many ridges and very few leads. Progress was slow and we often had to backup and ram but, nonetheless, we managed to continue mapping the 2500-m isobath up the Northwind Ridge until approximately N. During this time, we covered approximately 100 nmi in 4 days. Data was difficult to collect in these conditions but we were able to continuously map the 2500-m isobath to its furthest north point. About 5000 sq. km (1458 sq. nmi) of seafloor was mapped during the transect to the north and back.

7 At N, the HEALY had great difficulty breaking through the ridges (one ridge took more than 8 hours to break through) and the decision was made to move south to the relatively ice-free waters of the continental slope east of Barrow. This area was chosen so that we could define the foot of the slope in the central portion of the northern Alaskan margin. The foot of the slope can be used in this region as a starting point for determination of the Gardiner Line one of the formula lines used for making an ECS submission under UNCLOS Article 76. The survey of the foot of the slope area began on October 18 and continued until October 24. During this time, complete overlapping multibeam-sonar data was collected over a region of approximately 15,435 sq. km (4500 sq. nmi), that ranges in water depth from 800 m to 3800 m. The survey not only delineated the foot of the slope, but it also revealed a complex margin with drift deposits, suggesting contour currents, that are cut by numerous canyons. The full cruise report for HEALY-0405 can be found at Figure 2. Cruise track for HEALY-0405
8 HEALY-0703 Overview: HEALY-0703 was conducted from August 17 to September 15, 2007, with both embarkation and disembarkation via helicopter transfer from Barrow, Alaska. The cruise track covered approximately 10,000 km (5400 nm) in 30 days (Figure 3). The primary objectives of the cruise were: 1- to complete the mapping of the 2500 m isobath that began on HEALY 0302 and HEALY 0405; 2- to begin to define the Foot of the Slope around the the northern and eastern edges of Chukchi Cap; and; 3- to further map an area of pockmarks originally discovered on HEALY Secondary objectives included the recovery and re-deployment of two High-Frequency Acoustic Recording Packages (HARP s), autonomous recording packages designed to record ambient noise levels at the ice margin for periods up to one year, and: the deployment of up to four ice buoys and continuous ice-observation by representatives of the National Ice Center. All objectives were achieved, far beyond expectations. Using a nominal swath width of approximately 7 km, the total area surveyed during HE was approximately 70,000 sq. km (20,400 sq nm). The cruise departed Barrow at approximately 1800L on 17 September and steamed northward approximately 50 miles and successfully recovered the first of two HARP buoys. The second was recovered 25 miles further to the northwest. Details of this recovery as well as a description of the purpose and capabilities of the buoys can be found in the HARP Buoy Report later in the cruise report. We next conducted a patch test and a deep CTD cast at the steep southeastern edge of the Chukchi Cap. We first encountered ice at approximately 76N. It was large pieces of thick, multi-year ice but, broken up enough to allow relatively easy passage at 3-6 knots (though we did have to back and ram occasionally). We continued northwest to the intersection of the 2500 m isobath and the U.S./Russian maritime boundary line where we then began an exploratory, zig-zag pattern to better define the foot of the slope. No definitive foot of the slope was apparent until a long excursion to the north revealed a clear transition between the slope and flat-lying abyssal plain sediments at approximately 81 15N. We made several more north south transits and consistently found this same slope/plain transition occurring on the northern end of the cap above 81N. We continued to run a zig-zag pattern in the north-east quadrant of the cap and also found and developed several prominent topographic highs, one which shoaled above 2500 m and may allow the re-definition of the 2500 m isobath. A well-developed foot of the slope was traced down and then back up the eastern side of Northwind Ridge, revealing a very sharp and clear slope/abyssal plain transition with the abyssal plain sediments consistently occurring at a depth of approximately 3820 m. Following this transition to the north allowed us to define a continuous foot of the slope around the northern most extreme of Chukchi Cap to the northern most point or our survey (82 17N); at this point, the slope/plain transition appears to continue to the north and east. Returning south, we mapped a seamount that rose from abyssal plain depths (3820m) to less than 2200 m at approximately 80 47N and W and then proceeded to transit southwest to carry out a detailed survey of a region in which pockmarks were discovered on a previous leg. We left the ice at about 77N but ran into occasional large packs of flows until about 75 N.
9 Throughout this period (17 Aug to approximately 5 September) ice conditions were variable but for the most part very light considering the latitudes we were at allowing survey speeds to average about 6 knots. Ice flows large enough to support deployment NIC ice buoys were difficult to find but three flows were found and three buoys deployed. A fourth buoy was deployed in open water at the far western extreme of our survey. Details of the ice buoy deployments and ice observations can be found in the NIC trip-report included in this document. On HEALY-0302, several large and well-defined pockmarks (probably related to gas extrusion) were discovered in a shallow region of the Chukchi Cap at approximately 76 30N and W. NOAA s Office of Ocean Exploration asked us to further expand this survey and generate a better map of the distribution of these pockmarks. Our plan called for a survey of two areas, one where the pockmarks were already discovered and one slightly to the north and the east of the pockmark area where there is more of a depth transition and thus we might better understand the relationship of depth to pockmark formation. Our survey of the second (not previously surveyed) region revealed no pockmarks but did show a remarkable series of closely spaced, NW-SE oriented, parallel grooves in depths of approximately 400 to 500 m. Given the remarkably parallel nature of these features, they appear to be related to ice-sheet flow rather than individual icebergs scours. Even more intriguingly, south of these grooves, as the water depths get a bit deeper, there appear to be a series of large, dune-like features that appear erosional in origin in the high-resolution subbottom profiles. We speculate that these may be related to flow under an ice-shelf that is not grounded but with near the seafloor. When we reached the pockmark area, just a few miles south of the scoured region, the winds and seas greatly increased (50 knot winds, 15 foot seas) creating less than optimal mapping conditions but the size and stability of the HEALY allowed us to continue. An approximately 40 km x 14 km area was mapped revealing numerous pockmarks of various sizes, but typically about m in diameter and m deep. Simultaneous collection of subbottom profiles revealed an apparent relationship to subsurface faulting but the nature of this relationship will need further study. Most remarkable was a circle of pockmarks (approximately 20 of them) forming a ring that is approximately 4 km in diameter. Upon completion of the pockmark survey, the HEALY transited south to re-deploy the two HARP buoys that were recovered at the beginning of the leg. These buoys were successfully re-deployed approximately 90 and 75 miles off Barrow, to be recovered next year. The HEALY arrived off Barrow at 0700L on the 15 th of Sept with transfer of the science party by helo commencing at approximately 0900L. The full cruise report for HEALY-0703 can be found at

10 Figure 3. Ship-track for HEALY 0703 HEALY-0805 Overview: HEALY was the fourth in a series of cruises designed to map the seafloor on the northern Chukchi Cap in order to explore this poorly known region and better understand its morphology and its potential for an extended continental shelf under UNCLOS. The mutlibeam echo sounder on board the HEALY was the primary tool, supplemented by the Knudsen subbottom profiler and deep sea dredging operations. The primary targets for the mapping were the delineation of the 2500 m depth contour and the foot of the continental slope the area where the continental margin transitions into the deep sea floor. In addition to its usefulness for Law of the Sea, the seafloor mapping data we collect is also valuable for better understanding seafloor processes, fisheries habitat, and as input into climate and circulation models that will help us predict future conditions in the Arctic. Three ancillary programs also took place during HEALY-0805: 1- the recovery of High-Frequency Acoustic Recording Packages (HARP s) that are designed to make long-term measurements of ambient noise in the Arctic and that had been deployed on HEALY-0703; 2- the deployment of several different types of icemonitoring buoys by personnel from the National Ice Center (NIC), and; 3- the daily observation by a specialist from the Fish and Wildlife Service of both bird and marine mammal sightings. Summary reports of each of these activities are presented at below. HEALY departed Barrow on 14 Sept and commenced operations with both mapping and the successful recovery of two HARP hydrophones that had been deployed on HEALY From the HARP sites we steamed north to pick up mapping of the region thought to represent the base of the slope in the vicinity of 82 0 N and W.
11 Surveying continued east following the morphologic expression of the base of the slope until approximately W where the character of the morphological expression of the base of the slope changed and we switched to a reconnaissance mode of surveying. This mode of survey continued until we reached the easternmost extent of our survey at approximately W. From this point we traveled westward mapping several regions that we suspected shoaled above 2500 m (they did) and then began dredging operations (on 30 August). A total of 3114 linear nautical miles were surveyed (5767 km) on HLY08-05 covering an area of approximately 34,600 sq. km (assuming an average swath width of 6 km). A total of seven dredges were taken on HEALY-0805, four on the southern portions of the Alpha/Mendeleev Ridge complex, two on ridges north of the Chukchi Borderland and one in the northwestern Northwind Ridge area. The first dredge site on the southern Alpha/Mendeleev Ridge complex yielded samples from what appeared to be an outcrop of layered sedimentary rock that appeared on shipboard examination to be non-marine in origin. The second dredge from the same vicinity contained over 200 pounds of mud and ice rafted debris. The third dredge, from another feature on the southern Alpha/Mendeleev Ridge Complex, also brought back only mud and IRD. The fourth dredge, from the same general vicinity as the third, was predominantly mud and IRD however there where interesting iron concretions and manganese crusts along with one sample of a possible altered ash deposit. The fifth dredge, from the northern extend of the Chukchi Borderland, recovered over 1000 pounds of mud with about 10 pounds of IRD of various rock types. The sixth dredge from a very steep (about 60 degree) slope on the northern Chukchi Borderland was mud free and contained over 200 pounds of what appear to be basalts. Finally, the seventh dredge from the western wall of Northwind Ridge had very little mud but over 700 pounds of rock that probably represented both outcrop and angular tallus from the foot of the steep slope from which it was dredged. Samples from this dredge represented a range of rock types including sedimentary, metamorphic, and possibly basaltic. The full cruise report for HEALY-0805 can be found at
 from north to south, Dredge Sites 1 and 2 are at the same location and represented by a single icon; dredge sites 3 an HEALY-0806 Overview: HEALY-0806 was part")
12 Figure 4. Healy Ship Track 14 Aug 5 Sept Dredge sites indicated by small blue icons. Dredges are numbered sequentially (1 7) from north to south, Dredge Sites 1 and 2 are at the same location and represented by a single icon; dredge sites 3 an HEALY-0806 Overview: HEALY-0806 was part of a two-ship operation led by scientists from the U.S. Geological Survey and the Geological Survey of Canada (operating a seismic system on the Canadian icebreaker Louis S. St. Laurent). For details of these operations please see: Childs et al, HEALY-0905 Overview: With the success of the two-ship operation in 2008, a second joint Canadian/U.S. operation HEALY-0905 was conducted in The primary objective was to take advantage of the presence of two very capable icebreakers to collect seismic data in support of delineating the extended continental shelf for both Canada and the United States in regions where a single vessel would have difficulty due to ice-cover. A secondary objective of the joint program was to take advantage of the two vessels to collect high-resolution multibeam echo-sounder data in regions where it would be difficult to collect data with one vessel. In addition to the collection of seismic and bathymetric data, each vessel also carried out ancillary projects including meteorological, oceanographic and ice studies; the Healy was also equipped to sample the seafloor with dredges.
 and the Healy rendezvoused on 11 August and conducted a seismic source calibration experiment to document the source levels and source signatures of the LSSL s airgun array.")
13 The Louis S. St. Laurent (LSSL) and the Healy rendezvoused on 11 August and conducted a seismic source calibration experiment to document the source levels and source signatures of the LSSL s airgun array. After concluding the seismic source calibrations (on 12 August), the LSSL deployed its hydrophone streamer, the Healy took the lead and the vessels stayed together in the ice until 7 September. By the 7 th of September the ice had diminished to the point that the vessels were able to separate, the LSSL continuing to collect seismic data and the Healy collecting multibeam bathymetry and sampling the seafloor with dredges. Over the course of the expedition, the LSSL collected more than 4000 km of high-quality multichannel seismic reflection, refraction and gravity data (Figure 5) and the Healy collected 9585 km (5175 nmi) of multibeam bathymetry, subbottom profiler and gravity data (Figure 6). Assuming an average swath width of 6.9 km the total area mapped was 66, 135 sq. km (19,280 sq. nmi). The multibeam bathymetry collected during these transects revealed a remarkably flat abyssal plain with an average depth of around 3850m and changes in depth of less than 20 m over hundreds of kms. On several occasions the mapping priorities changed and the bathymetric surveys were conducted over targets of interest. Amongst these targets of interest were the mapping of the foot of the slope in an area on the southern side of the Alpha-Mendeleev ridge complex (at approximately N, W) and the examination of several topographic features that were implied on earlier bathymetric compilations. One such feature which appeared as a single 100 m contour (above the abyssal plain) on a Russian chart, turned out to be an 1100 m high, 26 km long, 7.5 km wide seamount. Figure 5. Seismic data collected by LSSL during joint HLY0905.

14 Figure 6. HLY-0905 track line. Point A is rendezvous point for LSSL and HEALY on 11 August. Point B is where the two vessels separated on 7 Sept Point C is newly mapped seamount. On 7 September, the ice conditions had evolved to the point where the LSSL could continue to collect seismic data without the Healy breaking ice in her lead. At this point the Healy left the LSSL and started to map independently. The Healy transited to the northern end of Chukchi Cap and proceeded to survey and occupy 5 dredge stations located on relatively steep slopes amenable to recovery in situ material with a dredge. More than 800 kg (1520 lbs) of rock material was recovered from these dredge sites with much ice rafted debris but also many samples that appear to representative of the outcrop. The majority of the material recovered appeared to represent several types of basalts. There was also a large amount of manganese crust, and in the Chukchi region, numerous metamorphic rocks. These samples will be sent to the appropriate labs for full description and analyses. Four ancillary programs also took place during HLY-0905: 1- the recovery of High- Frequency Acoustic Recording Packages (HARP s) that are designed to make long-term measurements of ambient noise in the Arctic and that had been deployed on HLY-0805; 2- ice observations and the deployment of several different types of ice-monitoring buoys by personnel from the National Ice Center (NIC); 3- the launch and recovery of a SeaEagle glider by representatives of the U.S. Navy supplemented by XBT measurements and meteorological observations, and; 4- the daily observation by a NOAA marine mammal observer of both bird and marine mammal sightings. The full cruise report for HEALY-0905 can be found at details of the LSSL leg can be found in Mosher et al

15 HEALY-1002 Overview: HEALY-1002 was the third two-ship joint Canadian/U.S. operation, and the second led by scientists from the U.S. Geological Survey and the Geological Survey of Canada (operating a seismic system on the Canadian icebreaker Louis S. St. Laurent). For details of these operations please see: Edwards et al, Figure 7. Cruise track for HEALY 1002
16 HEALY-1102 Overview HEALY-1102 was the fourth in a series of two-ship, joint Canadian/U.S. ECS mapping programs. The primary objective was to take advantage of the presence of two very capable icebreakers to collect seismic data in support of delineating the extended continental shelf for both Canada and the United States in regions where a single vessel would have difficulty due to ice. In the context of the Law of the Sea, the seismic data is needed to establish the sediment thickness in order to define the Gardiner Line (a line denoting points where the sediment thickness is 1% of the distance back to the foot of the slope). The logistical difficulties of collecting seismic data in ice-covered regions make it much more likely that the data can be collected successfully if two icebreakers participate, one in the lead to break a path for the second following with the towed seismic acquisition system. A secondary objective of the joint program was to take advantage of the two vessels to collect high-resolution multibeam echo-sounder data in regions where it would be difficult to collect data with one vessel. In the context of the Law of the Sea, the multibeam bathymetry is used to establish the position of the foot of the slope and the location of the 2500 m depth contour, each critical components of the establishment of an extended continental shelf. In addition to the collection of seismic and bathymetric data, gravity data was also collected by both vessels. Each vessel also carried out ancillary projects including meteorological, oceanographic, wildlife and ice studies; the LSSL carried a large Autonomous Underwater Vehicle (AUV) to test the feasibility of using AUV s deployed from icebreakers in ice-covered Arctic waters for seafloor mapping, and the Healy was equipped to sample the seafloor with dredges should the opportunity arise. Researchers on the Healy also hoped to explore the feasibility of using a small autonomous airplane (UAV) to map ice and wildlife around the vessel, but were denied permission by the USCG and thus the program was moved to the LSSL. This report focuses on the activities of the Healy with a summary of each of the ancillary programs presented in the Appendices; for details of the LSSL cruise, please see Mosher et al The LSSL departed Kugluktuk, NWT on 18 August while the Healy departed Barrow, Alaska on 16 August, hoping to rendezvous on the northern Chukchi Cap on the 23rd of August. The LSSL was not able to fuel in Kugluktuk and continued on to Tuktoyaktuk to fuel there. Strong winds and high seas prevented fueling in Tuktoyaktuk forcing the LSSL to depart without fueling but with the understanding that the HEALY would provide fuel at the rendezvous point. While waiting for the LSSL, the Healy proceeded to a region approximately 200 nm WNW of Barrow to continue mapping the margin off the north slope of Alaska in order to delineate the foot of the slope. Before commencing this survey a CTD was taken and a patch test was conducted to calibrate the static offsets of the sonar system. Details of these operations can be found in the Chief Scientist s Daily Log, below. Enroute to the survey area an Uptempo Buoy with 50 m long thermister string was launched (see NIC Ice Report Appendix XXX). Survey work in this area was completed on 21 August when it was necessary to depart in order to meet

17 the LSSL at the rendezvous point; a total of approximately 25,000 km 2 (7500 nm 2) of multibeam sonar data collected in this area (Figures 8 and 9). Figure 8. North Slope FOS survey August 2011 The vessels rendezvoused at approximately 78 o 36 N, 163 o 49 W at 1500Z on the 23 rd of August. 250,000 gallons of fuel were transferred to the LSSL and science planning and coordination meetings went on during the day. At approximately 0400Z on the 24 th of August the Healy took the lead and a remarkable, almost continuous, 750nm seismic line was collected across the top of Chukchi Cap, west of Nautilus Basin, over Alpha-Mendeleev Ridge, across Makarov Basin and partially up the Lomonosov Ridge. Multibeam sonar data was also collected continuously along the 750 nm line (Figure 9). Ice conditions on the Lomonosov Ridge were such that it was impossible to collect seismic data so at this point the LSSL and the Healy changed positions and the LSSL began to lead the Healy to optimize multibeam sonar data collection. During collection of multibeam sonar data on the Lomonsov Ridge, the Healy reached its furthest north point o N 159 o E. Moving south from the Lomonosov Ridge multibeam sonar surveying focused on mapping the foot of the slope in the area of Marvin Spur (Figure 9). Heavy multiyear ice made mapping difficult but with LSSL in lead, useful data were collected. On 3 September, the LSSL separated from the Healy to deploy an AUV equipped with multibeam and single beam sonars (see Mosher et al., 2011 for discussion of AUV operations) while the Healy continued collecting multibeam sonar data on its own until 6 September; these data were of much reduced quality due to the heavy ice conditions present (Figure 10). During this period the Healy stopped next to a thick flow to deploy an ice buoy and provide a 2 hour ice liberty for the crew.
18 Upon completion of AUV operations, the vessels joined up together and proceeded with the LSSL in the lead, optimizing multibeam sonar data collection while mapping the foot of the slope around the eastern side of the Makarov Basin (Figure 9). Ice conditions were heavy with thick multiyear ice common and much backing and ramming required. Nonetheless the two-vessel combination allowed useable bathymetric and high-resolution subbottom data to be acquired. The survey of the foot of the slope around Makarov Basin was followed by a long transit to the southeast across Alpha/Mendeleev Ridge and into Stefansson Basin (Figure 9). The LSSL led the Healy for most of this transit but data collection on top of Alpha/Mendeleev Ridge was not a priority for Canadian ECS objectives and thus the transit took place at speeds less than optimal for good data quality. Nonetheless, the subbottom profiler and multibeam sonar data revealed that for several hundred kilometers, the crest of the ridge had a chaotic, 30-50m relief that resulted in complex hyperbolic echoes on the Knudsen profiler. Several times during this transit, the vessels reversed positions so that the LSSL could attempt to collect seismic data, but each time the seismic lines had to be aborted due to very heavy ice conditions. The transit continued until the 12 th of September when the vessels reached of Sever Spur, a prime target for Canadian ECS mapping. The LSSL deployed seismic gear at the approaches to Sever Spur and was able to collect seismic data for 18 hours before ice conditions required recovery of the seismic system. The vessels swapped positions again and proceeded to the east until approximately 80 o 9 N, 119 o 10 W when ice conditions prevented both vessels from progressing further east. At this point the survey was turned southwest to once again examine the transition from Sever Spur into the Stefansson Basin (Figure 9). At the western edge of this line the seismic gear was deployed again and seismic data collected for another 11 hours. At about 1800Z on the 16 th of September the LSSL separated from the Healy to launch it AUV (see Mosher et al. 2011) while the Healy continued to map Sever Spur on its own. The vessels rejoined on 19 September and began a transit into Canada Basin hoping to again collect seismic data. During the deployment of the seismic gear the LSSL noted a strange noise coming from one of their shafts. Investigation by small ROV revealed that the main propeller had moved on the shaft and was loose. Operations ceased while the LSSL waited for guidance from Canadian Coast Guard Headquarters. During this interval the two vessels rafted together and exchanged hospitality. The LSSL received word to proceed directly to the Northwest Passage and requested that the Healy accompany her for some of the way through the ice. This brought to a close the joint science operations of the program. Despite this slightly premature ending to the joint program, all of the objectives originally outlined were more than met. On 21 September, the two vessels began a transit towards the entrance to the NW Passage, with the Healy in the lead to ease passage of the LSSL through the ice. The Healy continued to collect multibeam sonar data during the transit over the Canada Basin. The vessels stayed together until mid-day on the 22 nd when ice conditions lessened to the point that the LSSL was comfortable transiting on her own. At this point the Healy and


19 LSSL exchanged salutes and separated with the LSSL heading for the NW Passage and the Healy heading towards Dutch Harbor. Figure 9. Trackline for HEALY Cross-hatched lines represent seismic data collection lines. Multibeam sonar data collected on all lines.
20 Figure 10. Multibeam Sonar survey and AUV deployjment in area of Marvin Spur. Note difference of quality in multibeam sonar data when LSSL broke ice ahead of Healy (southern line) and when Healy collected data on its own (northern line).green box represents area of Canadian AUV deployment. The Healy averaged over 16 knots transiting to Dutch Harbor, arriving at 0900L on 28 Sept. and bringing HEALY-1102 to an official end. Total track covered on HEALY-1102 was 11,447 km (6181 nm) with 9188 km (4,961 nm) of multibeam sonar data and 875 km (472 nm) of seismic data collected in support of ECS purposes. These data were collected in average ice conditions of 9/10 s ice cover and at an average speed of 3.5 knots in the ice. ECS multibeam data collection covered an area of approximately 58,000 km 2 (16,960 nm 2 ) adding approximately 20% to the U.S. Arctic multibeam sonar data holdings. In addition to the primary ECS mapping mission of HEALY-1102, seven ancillary programs were accommodated on a non-interference basis. These programs included: 1- Meteorological observations (including 47 RAWINSONDE balloon deployments) and daily forecasts conducted under the supervision of CMDR Ivo Prikasky, U. S. Navy. See Appendix A. 2- Ice observations, analyses and reporting along with the deployment of one UpTempO buoy, 2 AXIB seasonal buoys, and 8 SVP TechOcean and METOCEAN buoys as part of the U.S. International Arctic Ice Buoy Program. The ice program on HEALY-1102 was under the supervision Pablo Clemente-Colon, National Ice Center. See Appendix B. 3- Deployment and development of a geo-referenced ice camera for ice and other studies Roland Arsenault Center for Coastal and Ocean Mapping Univ. of N.H. See Appendix C. 4- Ocean Acidification measurements under the supervision of Lisa Robbins, U.S. Geological Survey. These measurements sampling of water bottles from included 8 CTD stations, 515 discrete underway
21 samples for ph, 350 discrete underway samples for C0 3-2 and 9000 continuous measurements of ph, pco 2, and TCO 2. See Appendix D. 5- First deployment of small unmanned aircraft from moving icebreaker (LSSL) in the Arctic for ice and marine mammal observations. Followed by 11 more flights, eight from LSSL and three from ice (including three night flights). Supervised by Capt. Steve Wackowski U.S. Air Force. See Appendix E. 6- Marine Mammal Observations by Leanna Russell, CH2MHILL. During the 40 days of the ECS science program 13 bearded seals, 13 ringed seals, 5 unidentified seals and 5 polar bears were seen. No whales were observed. During the transit through the Bering Straits to Dutch Harbor, 24 fin whales, 1 humpback and 12 gray whales were observed. See Appendix F. 7- Bird Observations Sophie Webb U.S. Fish and Wildlife Service
22 SCIENTIFIC PARTY Last Name First Name Institution Position Mayer Larry University of New Hampshire Chief Scientist Armstrong (CAPT. ret) Andrew NOAA co-chief Scientist Calder Brian University of New Hampshire Scientist Arsenault Roland University of New Hampshire Scientist Mitchell Garrett University of New Hampshire Grad Student Flinders Ashston University of New Hampshire Grad Student Fandel Christy University of New Hampshire Grad Student Beduhn Tami University of New Hampshire Grad Student Miao Dandan University of New Hampshire Grad Student Alavera Jorge University of New Hampshire Grad Student Hall John Geol Survey of Israel Scientist Moore Barbara State Dept. Scientist Chayes Dale Lamont Doherty Earth Observatory Chief of Everything Roberts Steve LDEO/UCAR Asst. Chief of Everything Prikasky (LCDR) Ivo USN (LCDR) Scientist FWC Dearing William USN (E-5) Forecaster FWC Thompson Matt NAVO Scientist Lamberton Natalie NAVO Scientist Buczkowski Brian USGS Scientist Knorr Paul USGS Scientist DeFore Chris USGS Scientist Wynne Jonathan Univ. of South Florida/USGS Scientist Robbins Lisa USGS Scientist Brumley Kelley Stamford University Grad Student Clemente-Colon Pablo National Ice Center Scientist Orlich Alice National Ice Center Scientist Collin Jacques Canadian Ice Center Scientist Russell Leanna CH2MHILL Community Participant and MMO Webb Sophie USFWS Scientist Wackowski (Capt USAF) Steve USAF Scientist/UAV Resio Jennifer NGA OGN Scientist Assigned to USCG Street David Canadian Hydrographic Service Scientist

23 SCIENCE SYSTEMS REPORT HLY1102 Technical Report Dale N. Chayes Steve Roberts Version Date: Tuesday, September 27, 2011 Instrument Lab Lamont-Doherty Earth Observatory of Columbia University Palisades, NY USA
24 Table of Contents Introduction Mapserver Configuration for HLY Other Ship Tracks: Default ship track Real-time Multibeam Terascan Receiver Performance (for NOAA satellites) DMSP Encryption Satellite orbit information Reachback (Iridium system) EM122: SIS projections: Real-time data access SIS background grids Generating sound speed profiles for SIS SIS dateline problem SIS gridding Helm display: Built In Self Tests: Noise Measurements Test conditions: Page 24 of 235 August 31, 2011
25 Watchstander Workstation: Watchstanders: Equipment: Knudsen 320 subbottom profiler POS/MV-320s: High latitude performance: Alignment at high latitude Heading accuracy estimate: POS/MV #1 (SN 2306) POS/MV #2 (SN 3723) POSPaq logging Number of satellites used MRU CTD CTD performance Starboard Staging Door Wind Birds LDS Time stamping LDS Acquisition management Data Distribution pco2 System Science Sea Water System (SSW) SSW Pressure Gauge in BioChem Lab Page 25 of 235 August 31, 2011
26 SSW relief valve in BioChem Lab SSW Science Pressure Transducer SSW Latency Flow through sensors Reference Hydrophone Hull Temperature sensor ADCPs Gravity Meters Science AIS receiver Aloftconn, Aftconn and Main Lab web cameras Revision History of this document Page 26 of 235 August 31, 2011
27 Introduction This report documents the technical performance and status of science and science related systems during HLY1102 from Barrow, AK to Dutch Harbor, AK and the preceding transit, HLY11TD, from Seward, AK to Dutch Harbor to Barrow. HLY1102 was a two ship cruise with the US Coast Guard icebreaker Healy and the Canadian Coast Guard icebreaker Louis S. St-Laurent (LSSL) in support of both nation s Extended Continental Shelf mapping programs. There were various ancillary programs collecting data about sea ice, marine mammals, birds, weather, oceanography and ocean chemistry. Dr. Larry Mayer of the University of New Hampshire Center for Coastal and Ocean Mapping was the chief scientist on the Healy and Dr. David Mosher of Natural Resources Canada in Bedford, Ontario was the chief scientist on the LSSL. The primary mapping tools for the ECS cruise were the Kongsberg EM122 multibeam on the Healy and the BIO seismic system on the LSSL. BGM3 marine gravity meters were operated on both ships: two on the Healy and a loaner from the UNOLS gravity meter pool on the LSSL. This was the third two-ship ECS mapping cruise by the LSSL and the Healy. The authors of this report sailed on all three. Table X: Major events during HLY1102 Date Event XX X Y Depart the cruise ship pier in Seward, AK Arrive Dutch Harbor Depart Dutch Harbor Personnel, equipment, and stores transfer by helicopter at Barrow, AK Rendezvous with the Louis S. St-Laurent Arrive Dutch Harbor, AK Mapserver The Healy s real-time Geographic Information System (GIS) was extensively used during this leg for planning and execution of this cruise as well as keeping track of other vessels operating in the Arctic (Polarstern, Amundsen, and Langseth.) Configuration for HLY1102 A number of new data layers were added for this leg including: HLY1102 Plan, LSSL AUV, added processed multibeam data from CCOM, GeoCAM, SailWX ships, Langseth s cruise plan. 27
 by a cron-driven script running on map-4.")
28 Other Ship Tracks: Added plots of other ship (Polarstern, Langseth, and Amundsen) tracks from data extracted from the sailwx.info web site using a cron-driven script running on a shore-side machine at Lamont and pulled out to the ship over the Reachback (low speed Iridium) by a cron-driven script running on map-4. Figure X: Plot of other ship s (Langseth, Polarstern, Amundsen, and Louis S. St-Laurent) tracks during HLY1102 Default ship track Changed the default ship track layer to be called Current Cruise rather than have to edit it every time. Real-time Multibeam Real time gridding of our EM122 multibeam data using MB-System version was exhibiting a surprising number of large outliers. This was identified as an issue with book keeping the beam edit flags as applied by the EM122. We reverted to using a slightly older version of MB-System (5.1.2beta1862.) Terascan During this cruise we routinely monitored and processed directly received imagery from NOAA AVHRR satellites and from Navy DMSP RTD satellites. GeoTIFF (georeferenced TIFF) images were generated and provided to the Mapserver. Receiver Performance (for NOAA satellites) There is still the issue with the degraded NOAA satellite passes and the huge random changes in the receive signal strengths. The SeaSpace groom report from spring 2011 (which was received long after the season started) indicated a possibility that the L/S Band feed is damaged or degraded. Coast Guard should engage SeaSpace and verify if there is a problem with the SeaSpace hardware and/or interference - perhaps from the VSAT system. 28

29 Figure X: Screen from WDS showing rapid 15dB changes in received signal strength during a NOAA- 18 pass. DMSP Encryption There is still the issue with the DMSP unencrypted to encrypted transition zone that we operate in. This significantly degrades the usability of this data since many of the passes are never collected due to being in the wrong "mode" and most are truncated in the middle of our area of interest. During this cruise we operated the system in both encrypted and unencrypted at high latitudes but there was no clear advantage to either one. The correct solution (which has long been in the works) is to get an updated decoder than can switch modes in the middle of a pass. Satellite orbit information Once we got out of VSAT range the orbital updates for the WDS system stopped because the automated updates that the SeaSpace technician claimed to get working during the most recent groom was in fact not working. I then let David Hassilev pursue this further. Shortly after we got out of VSAT range, we noticed that the automatic update of satellite orbit information for WDS was not being correctly applied to achieve correct antenna pointing. Investigation demonstrated that the automated updates that the SeaSpace technician claimed to get working during the most recent groom was in fact not working. David Hassilev (ATG/ESU Seattle Science) verified that the ed information was reaching the WDS computer (via fetchmail) but not being properly processed. He worked on fixing the update scripts. 29
30 As part of the next groom, SeaSpace should be carefully supervised and system should be thoroughly testing, including delivery of orbital information. Reachback (Iridium system) The Healy s science Reachback low bandwidth Iridium network connection was used extensively during this leg, primarily to carry traffic to/from the Internet via is shore-side paired unit. There were sporadic issues with the system that required occasional reboots of one end or the other, each of which resulted in backups of minutes to several hours. On the whole, the system Figure x: Screen capture from the Reachback on September 3, 2011 showing the high ratio of failed calls on Channel #2 relative to the other channels. This high failure rate is likely related to the radios, antennas, and/or connections. File: reachback z.png worked as expected, and perhaps somewhat more reliably than on other similar legs. 30
 swapped antenna cables between Channel 2 and Channel 1 (see elog entry) but the problem stayed with Channel 2 as shown in the figure")
31 Figure X: Screen capture from Reachback showing the high failure rate for Channel #2 compared to the other channels. File: reachback z.png David (Hassilev) swapped antenna cables between Channel 2 and Channel 1 (see elog entry) but the problem stayed with Channel 2 as shown in the figure below. 31
32 Figure X: Screen capture from Reachback showing a long period (4 to 5 hours) for all four channels. File: reachback z.png EM122: SIS projections: We tried, but could not figure out how to get SIS to use a polar stereo projection using the proj package. You can enter projection information but the editing capability does not work and the test does not work. There is a built-in Universal Polar Stereo Projection whose default orientation results in north being to the lower right corner of the Geographical display when working on the western side of the Arctic.. We explored changing the central meridian to 155º West (to match what we use in Mapserver) but there did not seem to be an option to to do that since it is a UTM projection. Real-time data access We have had concerns about the validity of the real-time raw.all files created by logging the UDP datagrams redistributed from SIS using their datagram distribution tool because they do not have exactly the same mix of datagrams as the raw.all files logged on disk by SIS. To solve this and to provide near real-time access to the raw.all files logged by SIS, we exported the SIS data file system from the SIS PC to emgate from which we can automatically transfer it using rsync to our archive where it is used for processing and archiving. This also allows access to the sound speed profiles (.asvp files) used by SIS from emgate. SIS background grids Used UNH/CCOM post-processed multibeam data to generate background grids for display by SIS on the Watch 32
33 Generating sound speed profiles for SIS Steve wrote a new application (in Perl) that generates SIS asvp-format sound speed files from XBTs (in Sippican MK21 format, XCTD files provided by the Louis S. St-Laurent, and SeaBird CTD files in cnv format.) The tool (profile2asvp.) This was used extensively during the cruise to construct sound speed profiles. We were allowed to use expendable CTD profiler data from the Louis during the cruise but only for sound speed profiles. Most of the sound speed profiles used during the two-ship part of the program were derived from the XCTD data. Some were derived from our own XBT and CTD data. SIS dateline problem SIS, like many other software applications (including Caris, Fledermaus, and MB-System), does not handle data spanning the dateline (180 degrees) gracefully. Steve did some testing of proj and found that it seems to handle the dateline correct. SIS gridding Under some circumstances, hdds.exe exits much more often than others. This is presumably related to the gridding specifications but it seems to happen more frequently at high latitudes (above 80º), sometimes as often as 10 times per hour! Every time hdds is re-started, it increments the line number. This causes issues with the data flow that CCOM established for post processing so during some time periods we instructed the watch standers to stop restarting hdds.exe. When the data on the Geographical window is critical to surveying we restart hdds.exe and live with some lines with only a few pings. Helm display: On several occasions the Helm display failed for no apparent reason. The typical cure is to exit and restart the Helm application. The video connector at the bottom left of the Helm display is also subject to occasional disconnection because there are no screws holding the VGA adapter and cable end connector into the receptacle on the monitor. Built In Self Tests: We collected and logged BIST (GUI and TRu) tests when opportunities presented themselves during the cruise. GUI TX BIS tests fail due to cold seawater. Further examination using the TRU BIS Tests shows more detail. Noise Measurements We collected a sequence of TRU BIST data along with recordings of reference hydrophone data over a range of shaft RPM as listed in the table below on September 28th prior to arrival in Dutch Harbor, AK. 33
34 This set of measurements shows that when the vessel is making way and has a stable flow under the hull, the noise level is almost completely independent of speed below 12 knots. This is in agreement with our noise measurements on Healy. It would be very helpful to have a set of measurements with all of the main engines shut down (and running on the Auxiliary Diesel Engine (ADE) but the ship was not comfortable shutting down the mains under current conditions. Test conditions: All active sonars (EM122, Knudsen 320, both ADCPs, SRD500) were secured. Seas: 6 foot swell, 3 foot seas (as reported by the bridge) it was dark Wind: about 20 knots from 320 Engines: all tests were done with #1 MDE Water depth was in excess of 1,000m during the entire test The TRU results were recorded (telnet -l filename.txt) between the two 0 knots tests the TRU was rebooted because it reported a connectivity error. Time (UTC) Speed (turns for x knots) Spectral level (re 10V) at 12 khz from LV App TRU BIST spectral level (db) Comment 1128 All sonars off kts , kts , kts , kts ,
35 Time (UTC) Speed (turns for x knots) Spectral level (re 10V) at 12 khz from LV App TRU BIST spectral level (db) Comment kts 28 RPM , kts , kts -98 (-97 to - 100) 79.7, 79.7 Power cycle TRU kts , kts Full TRU BIST kts na na Full GUI BIST Watchstander Workstation: Watchstanders: As is always the case for cruises where there is a full-time underway watch like this one, a substantial amount of time is spend training and trying to educate watchstanders and in reminding them when things go wrong. Equipment: One Apple 23 Cinema display failed on August 30. We moved a smaller (20 ) display into it s location. We no longer have a spare large format LCD monitor on board. Later in the cruise the second 23 Cinema display started to show signs of problems with it s backlighting. On September 13th we requested that STARC (SIO) provide two replacement displays at the Dutch Harbor port call. Knudsen 320 subbottom profiler When the ADU5 failed (-----date---- time-----) we reviewed why the navigation input to the Knudsen was coming from the ADU5. To the best of our recollection this was an old arrangement. We should provide POS/MV data from the remote LDS node in IC/Gyro. The four ports on the USB serial multiplexer (Keyspan USB-49LW) on that note are full but there is one serial port on the back of the computer that might work. Custom plots of Knudsen data were generated at the request of the science party. 35
36 The standard Knudsen plots available through the Data Catalog were updated. POS/MV-320s: High latitude performance: As the result a long dialog w/ Applanix support, we expected to receive a high latitude firmware update by the middle of August but it was not available. With the current firmware version, these units will not re-align north of about 80º latitude. Alignment at high latitude The following table shows the maximum latitude that various versions of POS/MV firmware will self-align. POSPaq is capable of generating GAMS-aided alignment at higher latitudes in postprocessing. Received a firmware update to from Applanix on September 19th and installed it shortly before the end of the day (UTC) while we were at 79º North. After installation the receiver aligned and started navigating in 10s of seconds. We (and Louis) were hove-to in heavy ice and drifting at about 0.4 knots. Table X: Firmware versions and codes for the Healy s POS/MVs Firmware Version Maximum Alignment Latitude Firmware Code V4.17? S/N 3723: 1EJBW-NTC3-PT5E V4.24 SN 2306: JX908-Z96D-0HP0 V º SN 2306: 28PJP-D4SW-0YXY S/N 3723: 954C6-1W5D-MYNS V º S/N 2306: UAS53-XWG6-3R7S 5.05 Unknown, worked at 79º 10 N on SN 3723 SN 3723: 1EJBW-NTC3-PT5E SN 2306: UAS53-XWG6-3R7S Heading accuracy estimate: There have been issues with the #2 unit showing high values for estimated heading accuracy when #1 does not. This issue has been with us since the #2 POS/MV was installed and we are continuing to work with Applanix to resolve it. 36
 for part of 2011-09-02.")
37 Figure X: POSPaq DOP prediction for based on a current almanac. Figure X: POS/MV #2 heading accuracy plot (during the period when the #2 POS/MV was connected as our primary) for part of There does not appear to be a strong correlation between the periods of decreased accuracy and the DOP predictions. 37
 POS/MV #1 was used as the primary source during this cruise except for the")

38 After Figure X: Version info for POS/MV #2 after firmware update to 5.05 on September 19, 2011 POS/MV #1 (SN 2306) POS/MV #1 was used as the primary source during this cruise except for the period when it reset at high latitude. We switched the outputs of the two POS/MVs so that we were using the second POS/MV as primary from about 09/01/ :48UTC to 09/19/ :40UTC when we switched back. The current plan is to continue to use the first POS/MV for the remaining two cruises. 38
39 Figure x: Screen shot of the #1 POS/MV on September 26, Coast Guard RF broadcast RTCM corrections are provided from an external (AG132) DGPS receiver POS/MV #2 (SN 3723) Applanix provided a high latitude update on September 20th. The firmware was updated to From elog entry Message ID: Entry time: 09/20/ :05:15: We applied it to the #2 POS/MV (SN3723) - Re-installed POS MV fw v5.04, w/ POSLoader and the auth code - power cycle - Copy the contents of the v5.04 release "POSLoader" directory to a new folder. - Delete the exisiting.aac file and replaced it with the (small) update file (MV505.acc - Ran POSLoader for the new.aac update, - power cycle - After restart, ran "POSConfig" (from an older firmware update) and selected "Update" - power cycle again The POS came up, aligned and started navigation in 10s of seconds. We are not driving (just drifting w/ the ice) so the attitude data has not settled down yet. Auth codes for firmware version 5.0x are: SN 3723: 1EJBW-NTC3-PT5E SN 2306: UAS53-XWG6-3R7S As soon as we got underway after the firmware update GAMS calibrated and the errors settled down. However, the large excursions in estimated heading accuracy continued. Figure X: Screen shot of the #2 POS/MV on September 26, This unit has internal DGPS corrections via WAAS. This dual frequency GNSS receiver is producing position accuracy estimates about half the size of the estimates for POS #1 which is single frequency and using CG corrections. 39
40 POSPaq logging During large segments of the northern reaches of the cruise we logged long segments of PosPaq data. This data can be used to recalculate heading and attitude for post-processing and will be useful to Applanix for analyze the behavior of these systems at high latitude. Number of satellites used They (both) appear to be much more selective with respect to which (and how many) satellites are used in the computation compared with the ADU5 and the AG132. See attached plot for an example. Figure X: Plot of the number of satellites used in computing position as reported in the NMEA 0183 formatted $XXGGA messages from the two POS/MVs, the Trimble AG132, and Ashtech/Thales ADU5 GPS/GNSS receivers on August 24, MRU6 The original multibeam on the Healy was a SeaBeam As installed, it was configured with a Seatex (now Kongsberg Seatex) MRU6 vertical reference. In the SB2112 configuration it was not provided with external GPS position or heading aiding. The sensor was mounted in a fixture on the aft bulkhead of IC/Gyro. The original sensor was SN 225. At the very end of 2002, when the Healy was getting ready to depart for McMurdo, the ship had trouble with the MRU6 and a spare (SN 1510) was purchased. In April or May, SN1510 was returned to Kongsberg Seatex for a firmware update. 40
41 During this cruise we tried the spare but found that it had lost it s not-so firmware, presumably because it s internal (Lithium) 10-year battery backed program memory had failed because it had spent so little time with external power. SN 225 worked worked properly but is well past it s recommended (2 year) calibration date. Table X: Approximate costs to refurbish an MRU6 based on an from Kongsberg Seatex Support (September 4, 2011) Item Cost (NOK) Cost (USD) (approx.) New battery Labor to replace battery (1hr) 1, Calibration 21,500 3,853 CTD A few CTD casts were taking on this cruise. The primary goal of these casts was to collect data for accurate sound speed profiles in support of the EM122 multibeam data for ECS mapping purposes. They were also sampled for the Ocean Acidification ancillary program. Table X lists the stations. Table X: CTD stations during HLY1102 File Number(s) Station Max Depth Comments 001, ,150m Seasave was configured for a12 bottle rosette but the hardware was a 24 bottle rosette. Split the upcast into two files m ,350m ,850m Serious, sporadic, discrepancies between the two temperature and conductivity sensors ,000m Still some issues with disagreement between sensor pairs 41
42 File Number(s) Station Max Depth Comments ,000m ,050m Changed cable for #1 SBE3 temperature sensor before this station. Performance is much better m Differences are small CTD performance There were non-trivial issues with the performance as evidenced by differences between the pairs of redundant sensors (temperature and conductivity.) Some of this may well have been caused by the lack of attention to the temperature in the Starboard Staging bay after the roll-up door had to be left open due to electromechanical difficulties. At least two times, the sensor end of the CTD was measured (with a Fluke IR Thermometer) at approximately -4ºC. At least some of the issues improved after replacing the cable between the primary SBE3 temperature sensor and the SBE9. This change was made between cast 007 and
43 Figure X: Plot of the upper 1,000m of CTD 004 (Station 3) showing significant discrepancies between the #1 (Red) and #2 (Black) temperature sensors between 400 and 950m. The two Conductivity (dark blue and light blue) sensors show similar differences the depth range between 0 and 200m 43
44 Figure X: Plot of differences between the primary and secondary temperature (black and red) and conductivity (green and blue) sensors for CTD cast 007. Note the large differences between sensors. Although the behavior is somewhat improved relative to earlier casts, they are still much bigger than is reasonable. 44

45 Figure X: Plot of differences between the primary and secondary temperature and conductivity sensors for CTD cast 008. Note that the differences are substantially smaller than for the earlier casts. This improvement came after changing the cable for SBE3 temperature sensor #1. Figure X: Temperature differences for the last CTD station (009) Starboard Staging Door The roll-up door was a problem on this leg. Several times it did not open correctly. Because it could not be closed there were problems maintaining the CTD sensors at a safe (above freezing) temperature. The EMs worked on the door early int he cruise (on the day w/ rafted w/ the LSSL.) Late in the cruise they identified the problem as a failed gearbox. We missed the opportunity to take a CTD late int he cruise because the door could not be raised. Wind Birds The starboard RM Young windbird stopped reporting data on at The data path comes from the Bridge to a cable in the back of the SDN rack which used to connect to the SCS computer but was re-routed (via in-line connectors) to the SIO Met/TSG system in Aftcon from which UDP datagrams are broadcast. Trouble shooting on September 8 found that the RS-422 to RS-232 converter was not secured to the serial multiplexer of the SIO data system and had come loose. 45


46 Figure X: Inline connections for the RM-Young windbird data at the back of the SDN rack. Figure X: Serial multiplexer for the TSG/Met computer showing the loose RS-422 to RS-232 converter for the Port RM Young Windbird. 46


47 Figure X: Plot of windspeed and direction for September 8, 2011 showing the return of data from the starboard RM Young windbird at about 1630Z. LDS Time stamping Checked the time stamping and time synchronization of LDS (and lds0) with a newly written Python app. Figure X: Zoomed plot of the difference between the timestamp in the $xxgga message from the Thales (Ashtech) ADU5 and the timestamp the bridge. 47

48 Figure x: Histogram of the time stamp differences between the NMEA $xxgga messages from the ADU5 and those applied by LDS running on lds0. The tight cluster and small offset indicate that time stamping and synchronization are working correctly. LDS Acquisition management Started new cruise during flight ops at Barrow. Ended cruise at pier in Dutch Harbor. Monitored data loggers. Restarted the logger for the ADU5 and TSG/Met system when they failed due to spurious characters from the sources. Data Distribution Generate the end of cruise data distribution for the chief scientist and for transfer to R2R. Generate 1 minute averaged underway data file. This was requested by several scientist. Identified some issues that needed fixing when the code was updated to use this years sensor additions and changes. pco 2 System A flow through system to measure the partial pressure of Carbon Dioxide in seawater and the atmosphere (pco 2) developed by Taro Takahashai of Lamont-Doherty with funding from NOAA was temporarily installed by Tim Newberger after the 2010 shakedown. 48
49 The system requires checking multiple times per day keep an eye on the water level in the equilibrator, the manometer, and the gas flows. Periodic maintenance includes changing gas bottles (for the flushing nitrogen) and air filters. On HEALY ,048 underway pco 2 measurements were made. Steve Roberts added a QC plot of this data to the data catalog (see Figure X.) Figure X: Example plot of pco 2 data from the Healy s data catalog. The process of developing the necessary documentation to support a TCTO which will is necessary to get approval for a permanent installation is being led by SIO. As of the end of August there does not appear to have been any progress on getting the TCTO documentation developed and submitted. 49
50 Figure X: Example of pco 2 data quality plot showing substantial latency between temperature measured just inboard of the Science Sea Water (SSW) intake (SST) and in the equilibrator. The approximate time lag in this example is 20 minutes. 50
 temperature and the temperature in the")
51 Figure X: A plot of data from the flow through PCO2 system for September 26, 2011 showing significant latency between the intake (remote or SST) temperature and the temperature in the equilibrator. 51


52 Figure X: Ship track of Healy during HLY1102 showing the location of the example latency plot above. 52
53 Figure X: Mapserver plot showing sea surface temperature measured along track in the vicinity of the latency example above. Science Sea Water System (SSW) When working in heavy ice the system is still prone to interruption and/or reduction of flow. The strategy for reducing the impact of ice chips, more water is diverted overboard, reducing the amount of water available for science use. SSW Pressure Gauge in BioChem Lab The pressure gauge on the outboard bulkhead in the BioChem Lab (next to the bypass valve and the fume hood) sticks frequently (all the time.) It should be repaired or replaced. SSW relief valve in BioChem Lab This relief valve does not have a low enough set-point to protect the PVC plumbing used in the TSG and flourometer system. A appropriate relief valve should be procured and installed. SSW Science Pressure Transducer During this cruise the SSW pressure transducer for the TSG/MET system was installed in plumbing that services the forward Climate Control Chamber. Due to plumbing repairs in the CCC, this segment of plumbing was isolated and the logged pressure was not indicative of the actual pressure. This transducer should be moved so that it reflect the same pressure as the gauge in Biochem. 53
 in the flow though the Healy s Science Sea Water system (SSW) is significant when operating in ice mode.")
54 Figure X: The SSW pressure gauge and pressure limiter in the BioChem Lab. SSW Latency Delay (latency) in the flow though the Healy s Science Sea Water system (SSW) is significant when operating in ice mode. In addition to the long pipe run from the motor room to the TSG in the Biochem Lab, a substantial amount of water is contained in the ice separator. 54
55 Figure x: Plot showing the latency (transit time) of seawater based on the temperature measured by the SBE3 Temperature sensor (Remote - blue) in the Motor Room (AMRx) near the intake and the temperature inside the SBE45 TSG (Local) in the Biochem Lab. The small spikes in the TSG trace or typical of small bits of ice blocking the flow. An evaluation of latency using cross correlation was done in Matlab for Day 228 (shortly after departure from Dutch Harbor) where there were very large temperature fronts. The temperatures and calculated results are shown in the following figures. 55
56 Figure X: The Remote and Local temperatures for Day
57 Figure x: calculated cross-correlation between Remote and Local temperatures. The top plot shows the correlation coefficients. The center and bottom plot show estimated latency in minutes. The bottom plot is scaled to skip the very high calculated latency around 1300Z which is at the same time as the very low correlation coefficient. The mean latency for the day is 6.99 minutes. Flow through sensors The Healy s flow through sensors for this leg included a SeaBird TSG (SBE45), Dissolved Oxygen sensor (SBE43), a remote temperature sensor (SBE3) and a Turner Flurometer. A water flow meter was also logged. There were a few instances of ice blockage and flow reduction. There were many instances where blockage seems to have resulted in ice chips melting and generating artificially fresher seawater at the sensors. 57

58 Figure X: Temperature, salinity and Oxygen spikes associated with flow rate changes, possibly caused by melting of ice chips in the SSW. 58
 was generated late in the cruise and run during the transit south to Dutch.")
59 Figure X: Photograph from the Healy s Aloftcon camera taken at 0300UTC on September 9, 2011 showing 10/10th ice cover at the approximate time of the data spikes in the flow through data shown in the figure above. Reference Hydrophone An updated software package (ref-hydrophone-save-data) was generated late in the cruise and run during the transit south to Dutch. The previous version stored averaged power spectra. The current version stores the as-collected digital data for post processing. It also generated three displays to aid in deciding when to store data as shown in the figure below. The top plot is a simple time-series of the measured voltage: in this case showing the outgoing multibeam (and subbottom) and bottom return in shallow water. The middle plot is the zoomed in (10kHz - 20kHz) averaged (over 2 samples), peak hold, power spectra of the data. The bottom trace is the 10 sample average of the RMS power spectra. The cursors enable picking frequencies and amplitudes. 59


60 Figure X: A screen capture from the second generation data acquisition software for the Reference Hydrophone. A set of noise test measurements were taken on September 20, 2011 prior to arrival in Dutch Harbor. The preliminary results of this test are described in the EM122 section of this report. 60

61 Figure X: Screen capture of the reference hydrophone data acquisition application. This data was collected during a transmitter BIST test sequence while all of the Healy s other sonars were secured. The top plot is a time series. The middle and bottom plots are short term time averaged spectra. The middle shows the full frequency range (0 to 50 khz) while the bottom plot plot is zoomed in (10 to 20 khz) to show more detail. The structured signal shows the individual sectored transmissions of the EM122. Hull Temperature sensor A SBE48 Hull Temperature was installed on September 28, 2010 (elog: and visually inspected in Honolulu (June 2011) during the NSF ship inspection carried out by JMS prior to departure for HLY11TD. The Hull Temperature sensor is magnetically coupled to the inside of the hull at the forward end of the Transducer Void and provide a proxy for water temperature that is independent from the Science Sea Water (SSW) system and thus is not effected by issues associated with pumps and ice clogging the SSW intake and/or plumbing, nor is it effected by changes in flow rate or pressure of the SSW system caused by changing demands. Figure X: Photograph of the SeaBird SBE48 Hull Temperature Sensor on the hull in the Transducer Void. Photo by Dale Chayes, June 12,
 is significantly reduced. There is significant lag in this rise which is assumed to be the result of the hull warming the seawater.")
62 Figure X: This plot (from the Healy on-board data catalog) shows data from September 9, 2011 (HLY1102) documenting the rise of the Hull Temperature Sensor (SBE48) - upper plot, blue trace around 2100Z when the ship speed (bottom plot, green trace) is significantly reduced. There is significant lag in this rise which is assumed to be the result of the hull warming the seawater. 62

63 Figure X: An example of the SSW temperature rising on both the remote temperature sensor and the temperature sensor inside the TSG is shown here late in the day when the ship is stopped and drifting with the ice. There is also a small rise in the Hull temperature sensor. ADCPs The OS75 and OS150 CTDs ran under control of UHDAS during this cruise. Data quality was monitored remotely by Jules Hummon. A large fraction of this cruise was out of VSAT range with severely limited remote access. As reported in the section on the POS/MVs, we switched the outputs of the two POS/MVs so that we were using the second POS/MV as primary from about 09/01/ :48UTC to 09/19/ :40UTC when we switched back. 63


64 The current plan is to continue to use the first POS/MV for the remaining two cruises. Due to the change in heading source, ADCP phase calibrations must also be checked during the period when the #2 POS/MV was in use. A very preliminary look at the heading difference (bias) between the headings reported by the two POS/MVs suggests that it is on the order of 0.015º. The heading bias difference in EM122 is currently set at 0.024º based on the patch test done early in this cruise. Gravity Meters At a port call (Seward, AK) prior to this cruise the Roll gyro was replaced in BGM3 S/N 221 The two BGM-3 marine gravity meters worked well during this cruise. On-board processing was done routinely by Brian Buczkowski of USGS using code provided by Dan Scheirer (USGS.) Figure X: Example plot of data processed gravity provided by USGS 64
65 Science AIS receiver The science AIS receiver worked normally during this leg. It was very helpful to have this data in the Mapserver in real-time to help in keeping track of the Louis S. St-Laurant during rendezvous and in two ship operations. Aloftconn, Aftconn and Main Lab web cameras The web cameras worked well during this cruise. There was more than normal interest in the Aloftcon camera in part due to the GeoCamera that was brought by the science party. REVISION HISTORY of this DOCUMENT This section captures revisions to this document. Comments, corrections, additions, etc. should be sent to Dale Chayes Date Author Comment Dale Chayes Started X Dale Chayes Various updates and additions Dale Chayes Move to local SVN repo and add keywords$rev$ fix address Revision history Dale Chayes Updates and additions, including more on the Reachback Channel 2 issue $Id$ Dale Chayes Updates and additions from Steve s feedback Dale Chayes Update ADCP section based on comments from Jules and Steve 65
 August 15, 2011: JD 227 1600Z: (0800L) Science team gathered at the SAR hanger in Barrow for embarkation process. Everything ran smoothly and all were on board by 1500L.")
66 CHIEF SCIENTIST LOG HEALY August 28 September 2011 Barrow Dutch Harbor NOTE: LOG WILL BE KEPT IN GMT WITH REFERENCE OCCASSIONALLY TO ALAKSA DST TIME (ADST = GMT 8) OR CENTRAL TIME (CT = GMT-6) August 15, 2011: JD Z: (0800L) Science team gathered at the SAR hanger in Barrow for embarkation process. Everything ran smoothly and all were on board by 1500L. August 16, 2011: JD Z: (0800L) HEALY underway. The plan is to head to the northeast (filling small holes in margin coverage) to a point at about 3000m depth north of one of the linear ridges that we can use for pitch, heading and latency patch test. We will start with Pitch test on steep feature south of CTD station, then do Heading test on long (14 mile) line over three linear features and then move to deep water (3000) where it is flat and do roll bias test. Estimated steaming time to site about hours. This will give us time to train watch standers. Figure 11 - Overview of track leaving Barrow 2330Z: Stopping for CTD cast approximate water depth 3212m. Lisa Robbins will trip bottles for acidification work. Ivo will also launch weather balloon. 66

67 August 17, 2011: JD Z: Launch CTD Z: CTD 001 stopped at 3171 m. 0123Z: CTD 001 on the way back up. Bottle configuration file error stopped at 165 m from surface there will be two files for this CTD. 0259Z: CTD 001 on deck. Plans for Pitch, Heading and Roll Bias Tests: Figure 12 - Planned Pitch Bias Test 67


68 Figure 13 Plan for Heading Bias Test Figure 14 Plan for Roll Bias Test 0325Z: Preparing to launch UpTempO Buoy 68
 0534Z: Ended Pitch line 0, began turn line 1 to come about. 0613Z: Started Pitch line 2 (westward).")
69 0330Z: Buoy in water N W Figure 15 Launching UpTempO buoy 0341Z: Underway from buoy site en route to patch test. 0459Z: Start Pitch line 0 (eastward) 0534Z: Ended Pitch line 0, began turn line 1 to come about. 0613Z: Started Pitch line 2 (westward). 0701Z: End of Pitch line 2 start heading to beginning of Heading line 0754Z: XBT- launched T Z: Start of Heading Bias Line 1 running SW After crossing two of the ridges, we have concluded that they are too broad to do a useful heading test. We will abort the line and run the heading test over the small knoll that is to the east. 69

70 Figure 16- Revised Heading test 1134Z: Start of Heading Line Z: Weather balloon launched 1220Z: End of Heading Line Z: Beginning of Heading Line Z: End of Heading Line 2 No heading bias found. En route to Roll Test area to northwest. 1608Z: XBT T-5_00126 taken 1628Z: Approaching begin Roll Bias test WP Initial plan for Barrow Margin Survey assuming sediment thickness will get us to 350 cutoff line even from conservative FOS there is no need to spend inordinate amount of time (which it will take) to search for foot of slope at end of McKenzie Delta. We will concentrate on gaps closer to margin. If analysis deems we must map McKenzie Delta end we will be better situated to do this in the future. 70

71 Figure 17- Initial plan for Barrow Margin FOS survey 1647Z: Start Roll Bias Line Z: End Roll Bias Line 1, beginning turnabout 1842Z: Begin Roll Bias Line Z: End Roll Bias Line 2, completing patch test computations, preparing to come on margin survey line. Roll Bias found and changed to deg. 2037Z: Begin WNW heading margin survey line at 12 kn. 2345Z: Noticed that swath was narrowing rather than widening as depth increased. Evaluated performance in manual mode at 55 each side versus normal mode of automatic and at 10 kn rather than 12 kn. Manual 55 seems to result in wider swath, but will evaluate quality during next processing cycle. August 18, 2011 JD Z: Slowed to 6 kn and deployed XBT T5_127. After deployment resumed speed of 12 kn and will evaluate multibeam performance. 0050Z: 12 kn speed seems to have no negative effect on system performance. 0151Z: Processing of line segment in manual swath width mode indicates that outer beam data are satisfactory. We will remain in this mode. Ended WNW line and began turn to come on ESE line. 0222Z: Started ESE line. 71
72 0400Z: Mayer on watch 1219Z: Try switching stb side to 60 degrees 1229Z: Try switching port side to 60 degrees 1248Z: The swath width increased but the outer edges are very noisy 100 m of relief not worth it just more to edit switch back to +/-55 manual. 1402Z: Try auto 75/75 as we get shallower 1431Z: Back to +/-55 and manual 1600Z: Armstrong on watch 1602Z: XBT 1640Z: Ended ESE line and began turn to port to come onto WNW line 1710Z: Began line to WNW 1945Z: Passing through some scattered ice at reduced speed for about 30 min. 2100Z: Began adjusting swath width to determine settings for best coverage 2122Z: Settled on 60 max angle port and starboard, in manual control, for multibeam sector coverage. 2200Z: Adjusted track to starboard to widen track line spacing and reduce swath overlap. August 19, 2011 JD Z: Launched XBT T7_129 and entered new sound speed profile. (XBT numbering system did not update. This file has the same sequence number as the previous T5 cast.) 0451Z: Placed multibeam in automatic sector control. 0600Z: Mayer on watch. 0812Z: XBT T5_00131 taken. Profile has very thin temp layer Steve is entering but will match surface with TSG temperature. As he is doing this TSG temperature is changing not a pretty picture Z: Armstrong on watch. 1604Z: XBT T5_00132 taken and entered as new SVP. 72

73 1627Z: Reducing speed for propulsion system testing. Speed will vary for the next ~40 minutes. 1800Z: Ended ESE line and began loop turn to come onto WNW line. 1927Z: Began WNW line; adjusting spacing as necessary for overlapping coverage. 2000Z: Passing through occasional patches of broken up ice on this line. 2023Z: Refraction artifact is notable; entered CTD cast to see if results improve. No improvement noted, so went back to latest XBT-derived profile. 2241Z: Entered SVP profile derived from World Ocean Atlas values from surface to 300 meters, then CTD to depth. Refraction artifacts are much reduced; will stay with this SVP for now. 2245Z: Crossed a distinct change in slope; see figure 8. Figure 18 Knudsen subbottom profile over area of change in slope. August 20, 2011 JD Z: Dropped XBT T5_ Z: Refraction problems continue, with fairly sever frowning. Attempted to resolve with an SVP based on XBT temperature and salinity from the CTD. This seemed to improve things for a while, but the frown returned. Analysis of near-surface temperature and salinity from shipboard sensors shows drastic changes in both over very short distances. We will prepare for a CTD to 500 meters. 0445Z: Dropped XBT T and launched CTD for cast at N W. for a 500 meter cast, including water samples. No refraction while stopped 73
74 0521Z: CTD back on deck. Underway, refraction returned almost immediately. Loaded new CTD and refraction remained. 0533Z: Stopped again to see what happens to refraction with new SVP. 0600Z: Mayer on watch Manually entering 1400 m/sec at the keel has improved (somewhat) the frown this is an unrealistic value we will return to using the sensor value and have to process out later. Both CTD and XBT show thin (10 m thick) very warm and low salinity layer this layer has surface temperature of 7 degrees (going to -1 by 10 m) and surface salinity of 22 psu increasing to 26 or 27 psu by 10 m. The quandary is why does it go away when we stop and get worse when we are steaming. We went through a number of scenarios that would cause the TSG to have very different values from the water around the xducer (though the thermister at the transducer head and the TSG are similar in their values). The real kicker is that manually changing the surface temp just doesn t help all that much. Steve Roberts suggests that maybe the hull is displacing the 10 m thick warm low salinity layer so that the interface is depressed under the hull and rises out to the sides this would cause issues as the ray tracing assumes horizontal layers. This is one of the few suggestions that does not have fatal argument flaws. As an experiment we will see the effect of changing speed on the refraction problem. 0802Z: XBT T warm low salinity layer now about 20 m thick. Will wait till we get back further to east where layer is thinner and refraction seems worse. 0855Z: Steve entered XBT and used CTD salinity not much of an improvement. Changing manual swath width to +/- 55 degrees. 1601Z: XBT T taken. Despite 35 knot winds and 3-5 foot waves the XBT still shows a strong surface layer with warm low salinity water. 1810Z: Armstrong on watch; refraction somewhat improved, but frowns appearing some of the time. August 21, 2011 JD Z: Dropped XBT T5_ Apparent errors in the profile, likely due to wire blowing against hull in heavy wind. Will not use this XBT for a sound speed profile. 0245Z: Ended ESE turn and began ~14 nmi. track to south to fill in an unsurveyed area. Increased speed to 12 knots. 0405Z: Came on line heading WNW. 0420Z: Reduced speed to 10 knots to improve data quality. 0600Z: Mayer on watch 0745Z: coming around to head ESE now heading into sea still heavy winds and high seas (25-30 knots, 5-7 foot seas) 74

75 0800Z: XBT T taken 0856Z: XBT T entered using salinity from CTD Z: Changing swath to auto 75/75 as we get in shallower water serious refraction has returned again in this area. Water is colder and more saline. 1125Z: Beginning turn. Should come back and check area from 0900 through 1140Z with water column tool may be gas in record. Figure features to be investigated for possible association with gas 75

76 Figure 20 Location of chirp profile in Fig Z: XBT-T5-140 taken 1643Z: LSSL is now same distance from rendezvous point as we are we will put on another engine and bring speed up to 15 knots we are heading in the right direction. 1800Z: Armstrong on watch 1820Z: Turned onto line heading 288 to extend coverage to the south. 2214Z: Completed line and turned north to 344 en route to next waypoint. 2245Z: Crossed change of slope and character of seafloor from lumpy bottom to smoother bottom with less gradient (Figure 11). Appears that we are now on abyssal plain. 76
77 Figure 21 Change in slope and character of seafloor August 22, 2011 JD Z: Dropped XBT T5_ Z: Launched weather balloon. 77
78 0440Z: Crossed a change in gradient on seafloor. Subbottom profile shows either two layers of stratification or some sort of side echo. Figure 22 Gradient change on seafloor from subbottom profile 0557Z: Change to manual +/- 55 degree swath width 0600Z: Mayer on watch 0605Z: Changed from deep to very deep ping mode to try to improve S/N on outer beams 0700Z: TD-0142 Deep Blue XBT taken. 0715Z: Slowing as we enter ice 78
 that the Russian")
 and MBES record over it")
79 Figure 23 Overview of margin survey August 2011 We crossed over a spot in the western Canada Basin (73 57N, N) that the Russian chart showed to have an 800m small round feature (Fig 14) nothing there. Figure 24 - Feature on Russian Chart -(left) and MBES record over it (right) 79

80 Crossed another feature on the Russian chart and again nothing there (Fig 15). Figure 25 - Another feature on Russian chart that was not there 1500Z: XBT-T7_00143 taken 1700Z: Armstrong on watch, speed is varying as the bridge reduces speed when approaching ice floes. 1942Z: Shifted MBES from very deep to auto mode and system went to deep. Lost some swath coverage. 1955Z: Began picking up Northwind Ridge slope in outer beams. 1959Z: Nadir beams tracking up the slope. 2305Z: Dropped XBT T7_00144 in transit over Northwind Ridge, and applied new SVP. The prominent warm surface layer from earlier in the cruise seems to be abating. August 23, 2011 JD Z: Running diagonally down slope on western margin of Northwind Ridge. 0600Z: Mayer on watch continuing to run (17 knots) towards rendezvous point 1445Z: ADU-5 stopped sending attitude data Dale will reset 80

81 1450Z: Have finally arrived in vicinity of LSSL. Picking them up on AIS. We are turning to port to find a good piece of ice and they will come steaming slowly towards us. Currently about 5 miles away. Maneuvering to find good piece of ice for rafting. Note the rendezvous point chosen by LSSL Captain is significantly further north (25 miles) than the original point which was designed to start us just south of the E-W running seismic line collected on HLY0503 to allow us to tie into this line. We will have to decide whether it is worth steaming back the 20 or so miles to cross that line. 1454Z: ADU-5 is back up and running. 1514Z: Stopping for rafting Greeted by Santa piping us in!!!! Figure 26 CGGS Louis S. St. Laurent coming alongside Healy 1645Z: Brow set up --- Throughout the day: Ship s company visits and exchanges, Captain s meeting, Science planning meetings throughout the day. August 24, 2011 JD Z: Brow removed, all science party aboard and accounted for. Survey watch reset. 81

82 0351Z: Clear from Louis S. St. Laurent and underway for seismic line starting point, some 25 n. mi. to the southwest, following LSSL. 0632Z: LSSL has reached the starting point, turned toward the north, and is preparing to deploy gear; Healy will overtake and take position ahead. Steve entered LSSL XCTD-12 into MBES Z: Mayer on watch coming ahead of LSSL as they begin to stream gear 1650Z: LSSL having some problems with seismic gear HEALY stopped 0700Z: XBT T taken. 0811Z: David called from LSSL streamer leaking they will pull in and try to swap out with second streamer. 0908Z: LSSL deploying gear again. 0954Z: guns in the water increasing speed to 3 knts 0959Z: increasing speed to knots 1053Z: David Mosher reports all up and running and sonobuoy deployed 1220Z: Crossing spectacular iceberg scours m deep all oriented NNE-SSW Figure 27 - large iceberg scours on Chukchi 1503Z: XBT T7_0147 taken. 1700Z: Armstrong on watch 1900Z: Crossing area of pockmarks on seafloor 82

83 XBT labeled T7_00148 Figure 28 Pockmarks on Chukchi Cap seafloor 2100Z: For a bit of time we have been seeing satellite constellation limitations; it appears that the crane operations on the flight deck have blocked some satellites from view, although no extended serious loss of positioning has occurred. August 25, 2011 JD Z: Mayer on watch leading as LSSL collects seismic knots, 8 cables ahead. 0704Z: Launched XBT T Z: LSSL called concerned about maneuvering of HEALY 1615Z: Trouble with both POS both claim no satellites in use Dale looking into it. 1620Z: Coming back.. 83

84 Figure 29- HEALY maneuvering between about 1125 and 1135Z 25 August 1700Z: Armstrong on watch 2026Z: Changed the EM 122 along-track beam steering from 0 to 1 forward, to see if we could reduce the near-nadir side echoes in the data. 2310Z: Dropped XBT T5_00151, and after processing, entered as new SVP using salinity from yesterday s LSSL XCTD. August 26, 2011 JD Z: Changed the EM 122 along track beam steering from 1 forward to 2 forward. 1 was better than 0, maybe 2 will be better still. 0500Z: Mayer on watch continuing to steam north at knots with HEALY leading LSSL by about 8 cables and LSSL collecting seismic and HEALY collecting MBES Our track intersects (or comes close to) two IAPB ice buoys one of these buoy s metadata describes it as being located on the Russian manned ice-station NP38. We are trying to find out if this is still manned. 0658Z: XBT T5_00152 taken wire broke at about 600 m. Will continue to use XBT profile. 1010Z: Data getting increasingly noisy as we get into heavier ice. Depth consistently at about 3290m we will try very deep mode to see if it improves S/N. 1155Z: Weather balloon released. 1358Z: Crossing through WP4-1505Z: XBT taken - T-5_
85 1623Z: LSSL to launch helo to observe the draft Report draft on HEALY is forward = 28 feet, center = 28 7 and aft 29 feet. 1700Z: Armstrong on watch 1809Z: LSSL reports that USAF Raven UAV flight ops are underway. Flight was successful, video data was recorded, and the UAV safely landed on LSSL. 2305Z: Launched XBT T5_00154; wire broke off at just less than 500 m. (renamed T5_00154A) 2310Z: Crossed a change in seafloor and subbottom layer slope, visible on Knudsen plot. 2325Z: Launched another XBT in open water, failed to update sequence number so this cast will be recorded as XBT T5_00154B (see 2305Z entry). 2343Z: Launched weather balloon Figure 30 Sharp change in seafloor and subbottom profile August 27, 2011 JD Z: Mayer on watch beginning to hit some heavy ice 85
86 0700Z: XBT T broke at 300 m. 0732Z: LSSL called trouble with seismic gear slowing down. Two guns out maybe related to sharp turn to get on track. LSSL says guns caught up in in ice and they are maneuvering to free them up. They have spare guns but only one sled so will have to swap out guns. 0815Z: While stopped waiting for LSSL took XBT T broke at 1300 m but good till there. Very similar to 154B so will leave 154B in as active profile. 0830Z: LSSL has gear on board. HEALY will maneuver back to LSSL and come around to start track again. 0840Z: LSSL called have two punctured hoses in guns figure 2 hours not enough time for CTD or to map areas of interest (about 20 miles east of here) so we will wait for now unless we get word that it will take longer. 1100Z: LSSL ready asks us to back down about 4-5 cables to clear path and then LSSL will fall behind and deploy gear. 1130Z: Recovering gear leak in streamer will pull and deploy spare 1330Z: Deploying gear again yet another leak hauling in to assess situation. They will be down for approximately 5 hours. We will run a line to the east to connect up with our line that was looking for the FOS from HEALY 0805 and where we did not find a convincing FOS. 1705Z: Armstrong on watch, we are completing a turn to head back toward LSSL on a line parallel to our previous track. 1900Z: Approaching LSSL; we will close, cross ahead, and clear ice forward. ~1935Z: Cpt. Wackowski launched Raven from LSSL with infrared camera. Raven passed along Healy starboard side heading outbound ahead of ships. 1950Z: Making way ahead of LSSL; LSSL will be deploying gun and streamer. 2329Z: Backing up to make second run at multiyear floe. Path behind us is filling in fairly quickly, leaving lots of broken pieces for LSSL to negotiate. August 28, 2011 JD Z: Mayer on watch. Steve Wackowski has had two successful Raven launches from the LSSL. First used visual imagery, second used IR. Here are images from each. 86

87 Figure 31- Raven Flight 1 - Imager of HEALY Figure 32 - Raven Flight 2 - IR image of HEALY Steve Lilgren also provided interesting image of HEALY and LSSL from satellite imagery. 87
. 88")
88 Figure 33 - RadarSat image of LSSL and HEALY 0729Z: Backing and Ramming 1007Z: Backing and Ramming 1700Z: Armstrong on watch 2118Z: Healy just struck large piece of multiyear ice and got pushed seriously off course; a power problem with the starboard shaft exacerbated the situation. Bridge called Louis to notify them and attempted to smooth the turn as much as possible (Figure 24). 88

89 Figure 34 Track after being pushed off course by ice 2327Z: Dropped XBT T5_00158 while stopped waiting for LSSL to close. Cut off at ~800 m when we started moving again. Probably will not use for SVP. LSSL has closed to about 0.5 nmi. 2346Z: Launched weather balloon from flight deck. August 29, 2011 JD Z: Mayer on watch 0908Z: Message coming to MB console that too few sound velocity samples were received sensor is re-initialized. Steve found that the computer in the winch room that sends svp data had crashed. He rebooted it. 0950Z: Stopping to let LSSL catch up will try an XBT. Taken -- T5_00159 went to about 1700 m but unrealistic values 1008Z: LSSL stuck HEALY looping around to pass on their starboard side and then come around in front on their starboard side. 89

90 Figure 35 Healy to the rescue - LSSL stuck 1050Z: LSSL clear moving on. 1052Z: Stuck again we will back down in front of them 1112Z: LSSL finally free moving on again. 1700Z: Armstrong on watch 1640Z: LSSL stuck again. HEALY will head back to try to break her out. 1710Z: Healy completed racetrack as before (see 1008Z and Figure 25) passed up Louis port side, and moved into previously broken track. LSSL was able to get moving again and has regained the track. Healy will try to maintain 0.5 nmi. for now. 1717Z: LSSL reports some difficulty with seismic array, but reports that they are coping for the moment. 1725Z: All is reported going ok on LSSL 1820Z: LSSL stuck again; Healy is backing down the broken track to see if we can dislodge LSSL that way. 90
91 1850Z: Moving again; LSSL gear seems to be ok 1930Z: Backing and ramming; lots of broken pieces piling up astern, to the extent that LSSL is unlikely to be able to get through. 1945Z: Healy swinging around in racetrack to re-clear path for LSSL. 2015Z: Another loop coming up. 2100Z: Backing closer, going ahead, backing again, going ahead, etc. trying to get LSSL free of the broken ice in the track. Lots of shaking. 2142Z: LSSL freed for the moment. 2230Z: LSSL pulling gear because of twist in sled. 2330Z: LSSL reports that in trying to get sled aboard, streamer got on top of ice. They will have to recover the streamer, then try to figure out how to get it in the water again. 2350Z: LSSL reports they are ready to go. Healy has mechanical issues that will delay us 30 min. August 30, 2011 JD Z: LSSL has streamer problems and must recover and repair. Turns out problems are severe and will require all night to repair. We will do CTD and possibly deploy NIC buoy. 0253Z: Putting CTD_004 and rosettes in the water from the starboard A-Frame. 0400Z: Mayer on watch 00503Z: CTD on deck. 0521Z: Preparing to launch seasonal ice buoy 0548Z: Buoy launched will now start small survey of slope between A/M ridge and Makarov Basin we will do this until nominal meeting time LSSL of If they call sooner we will break off survey if they are further delayed we will continue on with it. 1450Z: Finished up small survey parallel to Makarov Basin/ AM Ridge intersection. Have now joined up with LSSL they report they will not be ready until 1530Z. We are going to take the opportunity to reboot SIS to see if we can resolve a display gridding issue. 1458Z 1510Z: Rebooted SIS and ran BIST test. Test satisfactory; restarted SIS with new survey. 1556Z: LSSL gear streamed getting underway 1600Z: Armstrong on watch 1650Z: Noticed that no backscatter is showing up in the SIS window. 91
92 1830Z: LSSL stuck; we are doing racetrack to pass alongside and ahead to attempt to free them. 2045Z: Started new SIS survey 2126Z: Backing and ramming Z: Launched weather balloon 2359Z: Healy stopped with hydraulic problems. August 31, 2011 JD Z: Problems resolved; back underway 0330Z: Sitting still waiting for LSSL to get closer. Noticed that EM122 is getting good swath and depths, and that depth is approximately 3930 m, about 100 m deeper than Canada Basin. IBCAO depth here is 3826 m. 0400Z: Mayer on watch Profile crossing into Makarov Basin from Alpha/Mendeleev Ridge 92

93 Figure 36_Chirp profile crossing into Makarov Basini from A/M Ridge 1446Z: Crossed the International Date Line 1615Z: LSSL held up by ice clog; cleared by Healy backing close and going ahead 1853Z: Lost most satellites for a bit, but regained after a bit 2130Z Although seafloor is very flat, subbottom layers are undulating as in Figure

94 Figure 37 Undulating sediment layers below flat seafloor in Makarov Basin September 1, 2011 JD Z: Mayer on watch 0403Z: LSSL DIW (stuck) HEALY backing down to try to free up. 0420Z: LSSL free 0840Z: LSSL stuck again swinging back to try to free up 1114Z: And again 1429Z: Looks like we are crossing the FOS at base of Lomonosov Ridge. 94

95 Figure 38 -FOS going from Makarov Basin to Lomonosov Ridge 1600Z: Armstrong on watch 1630Z: traveling upslope on the Lomonsov Ridge, the subbottom profile gets rather poor returns from the sloping seafloor. However, when we stop for ice or otherwise, good returns with clear layers on the seafloor are recorded as in Figure

96 Figure 39 Subbottom layers showing up when Healy is stopped on slope of Lomonosov Ridge 1645Z: LSSL stuck, Healy looping around to free. 1927Z: Noticed that POS MV is all red, with only 2 or 3 satellites, and with growing position errors, ultimately showing about m. 1958Z: As POS 1 never returned, so Dale switched the SIS navigation to POS 2, which is tracking satellites ok and showing green. 2150Z: Passed through waypoint 40 and continued slightly to allow LSSL to reach the waypoint. LSSL stopped to retrieve seismic gear. Healy continued on to regain the new line and wait for LSSL. 2202Z: Dropped XBT T5_00160 while stopped waiting for LSSL 2225Z: LSSL has taken station ahead, we are moving down broken path, initial speed to be 6 kn. with a 1 nmi. gap. We can adjust speed as necessary when we have an idea of how the EM122 performs. September 2, 2011 JD

97 0001Z: Speed of 6 knots seems to be the maximum for reliable sounding. 0340Z: Stopped while LSSL takes XCTD Z: Mayer on watch 0443Z: Reached northernmost point of track 88 o N 159 o E -- all downhill from here. Heading toward Marvin Spur Figure 40. Furthest north point of cruise 0656Z: Not tracking bottom on EM122 and Knudsen probably ice under xducers stopping and will backdown 0703Z: Starting up forward again seems to have cleared it. 0728Z: looks like more ice right at the critical FOS we will back down again 1530Z: Approaching Marvin Spur sharp depth change but looks like ice under xducer will back down 1545Z: heading forward again Knudsen showing 3900 then big jump to 3500 m Z: Armstrong on watch 1635Z: Asked LSSL to turn early to 085 to try to keep base of Marvin Spur in swath 1756Z: Crossing dateline 1830Z: Passing over another toe of Marvin Spur 97
98 2100Z: Another Marvin Spur toe 0043Z: Stopped for flight ops with LSSL helo September 3, 2011 JD Z: Underway again; backing to get clear and then going ahead. 0155Z: Increasing speed above 4 kn to get through heavy section of broken ice in path. 0400Z: Mayer on watch. We have noted that ice is closing in and that LSSL is far ahead have called bridge and asked to close distance but still maintain 4 knts. 0652Z: LSSL puts on 4 th engine. 0945Z: cyclo trip!!! Will be at least an hour. 1130Z: We are way behind in terms of getting to the AUV launch site by 7AM suggest we head right to launch spot woke up David on LSSL. Agrees but he is concerned that pond that they were aiming for has closed up. They will scout out new launch site and we will simply follow them there. LSSL puts on 5 th engine. 1140Z: underway we will try to break through at high speed we are not worrying about data we can come back when we survey on our own. LSSL heading to a pond they identified yesterday. 1230Z: LSSL having engine problems stopped. 1245Z: LSSL Capt. Rothwell has intuition about open water heading to dark cloud on horizon 1300Z: Launching helo to scout for open water. Found an area we ll be heading to it., 1450Z: LSSL found spot and is clearing it out now we are holding off till they are set up. 1600Z: LSSL deploying AUV alongside for ballast adjustments 1630Z: The AUV is stable in the water, still attached to the crane; we are getting underway for independent mapping and ancillary program while LSSL remains on station for AUV mission. 1740Z: Backing and ramming to get through heavy ice 1755Z: We will divert somewhat northward to evaluate a possible site for ice buoy deployment and possible ice liberty 1920Z: Maneuvering for a place to lay to against the ice for ice buoy deployment. 1925Z: Nope; moving forward again 98
99 2000Z: Stopped at site for buoy deployment and ice liberty September 4, 2011 JD Z: Underway from ice liberty; heading south to get clear, will turn and pass 1 mi east of waypoint 2 and head for following waypoint Z: Mayer on watch 0416Z: real problems with data quality some of it sidelobe issues try changing to 5 deg forward along direction tilt not much of a difference 0427Z: back to 2 deg along direction tilt 0932Z: We have been trying all sorts of things to improve data ratcheting, stopping, backing down, etc. but nothing really seems to help. Ice is thick and there are no leads. 1015Z: Out of desperation (nothing to lose) we have started playing with some of the settings on the SIS. We have taken it out of high-density mode with the hope of increasing the S/N (at the cost of beam density) and have put it into equiangle mode with the 45 deg fixed swath this should create many overlapping beams and hope to increase S/N. Finally we have shut off the aeration filter in the hope that it will make it respond faster after losing bottom track. Difficult to say but these changes may have helped. 1500Z: OOD has found a opening in the ice he thinks may be suitable for CTD. He will head over there and see if he can open it up. Ice too thick back to surveying 1539Z: OOD sees another possibility for CTD about 2 miles to port will head there. 1600Z: Armstrong on watch 1645Z: CTD in the water; depth approximately 2900 m 1745Z: Extended beam coverage to 60 each side but only got 54. Began some setting experimentation to see how much we could obtain. 1800Z: Did BIST test at Dale s request 1845Z: BIST complete, results satisfactory. Back on line in data acquisition mode. 1920Z: Recovered CTD, dropped XBT 2000Z: Attempting to spin slowly and fill in a circle of soundings in the open water pool; unable to complete spin, continued on through the ice. 2100Z: Following break in slope on Marvin feature 2205Z: Backing and ramming 99
100 September 5, 2011 JD Z: Reached SW end of this feature and encountered massive ice ridge that we will have to skirt. After getting around the ridge, we will set course to rejoin the planned track. 0100Z: Apparently we didn t reach the end of the feature; we are now tracking a ridge to port and will resume adjusting courses to follow the base of the slope. 0400Z: Mayer on watch 0530Z: Steve noticed a double bottom that appeared to be confusing the EM122 reduced the forward tilt to 2 then 0 and this seemed to reduce the problem. 0649Z: Crossed date line again mapserver and SIS both complaining 0812Z: stopped for engine swap 0816Z: underway again 0947Z: Have completed the initial circumnavigation of this part of Marvin Spur. 1600Z: Armstrong on watch 1644Z: Crossing dateline 1835Z: Bridge has sighted open water about 2 miles off the starboard bow; we will divert to take CTD 1918Z: Stopped in open pool for CTD and water samples at depth 1937Z: CTD in the water 2214Z: CTD on deck and XBT T5_00163 dropped; surface ice sample collected from sea surface at the stern 2250Z: Underway from CTD site September 6, 2011 JD Z: Completed loop to return to original track paralleling previous swath 0057Z: Moved into the track of broken ice from yesterday to see if data improves 0115Z: left track to maintain spacing fro adjacent line. 0225Z: Backing and ramming 100
 and then had to extricate from the ice with the LSSL. Finally they brought it on board at about 1600L on 5 Sept.")
101 0440Z: Mayer on watch LSSL has called they have recovered the AUV after it aborted its mission at 3000m depth. The vehicle surfaced under the ice and they were able to locate (eventually) and then had to extricate from the ice with the LSSL. Finally they brought it on board at about 1600L on 5 Sept. They are finishing up an ice buoy deployment and a CTD and then have suggested that we break off our survey and meet up with them at a waypoint due south of where we are. This is about 18 miles from our position and about 29 miles from where they are we should get there at about the same time as we will maintain mapping speed. Figure 41- Overview of Marvin Spur coverage Sept 2011 red track HEALY, green track LSSL 0411Z: backing and ramming need to get around a large ridge 0500Z: Breaking off Marvin Spur survey to join up with LSSL. 0630Z: After coming off spur have asked bridge to speed up so that LSSL will not have to wait too long for us. 0900Z: Have joined up with the LSSL at WP2 (in Fig 31). Unfortunately the FOS appears to be seaward of this location we are at a depth of about 3870 m when basin floor is typically 3910 or so. We will head west a bit and get on basin floor to begin transit up slope. 0935Z: Just got a beautiful crossing of FOS at 3910 m will have LSSL turn around and head to WP3 we will follow their track and should get a nice crossing going up too. 101

102 E W FO Figure 42 _ FOS heading west into Makarov Basin 1140Z: Changing back to high-density beam forming now that we are following in LSSL s wake. Will see if there is improvement in data quality or range. 1709Z: Crossing the 2500 m contour at N W 1920Z: Adjusting track to turn south toward wp100 early as 2500 m contour from EM122 is turning to the south, suggesting that the peak of this feature is south of the charted location. It is possible that the feature is irregular, and that the peak is to the north, but we will definitely get significant coverage of depths less than 2500 m. 2045Z: Stopped for flight quarters send David H. and spares to LSSL to try to reestablish wireless IP connection and for Alice O. to return. 2110Z: Helo on deck 2125Z: Helo away 2130Z: Deployed XBT T5_00164; unreliable looking curve, we will not apply to SVP. 102

103 2335Z: Secured from flight quarters and began making way. While drifting with the ice for 2 hours during flight ops (Figure 33), at approximately 0.5 knot to the SE, we moved off into deeper water. Figure 43- Drifting with ice pack to SE at 0.5 knot September 7, 2011 JD Z: Mayer on watch Noticed we were doing about 2.5 knots for the last hour or so beautiful data but we need to try to gain time on schedule so have asked to kick it up to 4 knots. 0700Z: Reached the FOS 3911m 3920m will continue on a bit more and then turn south 103


104 Figure 44 FOS - into Makorov Basin - 7 Sept 0700Z 0950Z: Steaming along the basin floor heading south. Track is closing in quickly we suggest we increase speed to 5-6 knots to stay closer to LSSL. 1314Z: Switched to long phase to try to increase S/N 1500Z: Reached WP at end of line David wants to turn southwest so we do. Has sent modified waypoints for next segment. 1600Z: Armstrong on watch, crossing over seafloor promontory. 1714Z: Crossed 2500-m contour at approximate position N, W. 1800Z: Dale C. reports that CTD temperature is -4 C, and therefore the sensor water bath is frozen, rendering the CTD unusable for at least 24 hours. No CTD between flight ops today. 104

105 1930Z: Appears to be no abrupt transition to the basin on this southern side of the promontory we just crossed, as the depths have dropped gradually to ~3900 m and have flattened out. 1943Z: Computer running the EM 122 SIS crashed; the EM122 is not operating while we bring the system back up. The subbottom profiler continues to operate. Notified LSSL Chief Scientist and we agreed that there is no need to stop the ships over this flat part of the basin. 1950Z: EM122 and SIS running again; Windows still rebuilding volume. 2043Z: Established comms with C130 aircraft ; Healy reports visibility 1nm with snow, wind 280 T at 25 kt; course 145 T speed 5knots. 2057Z: Healy is stopping, backing, and will leave track to close an ice floe and set up for air drop. C-130 CG1709 made 4 passes from port to starboard and dropped 3 pump cans with spare parts on ice about 400 meters to starboard. Healy moved to get closer so ice team could walk out and recover cans. Figure 45. C-130 dropping supplies to Healy and LSSL 2252Z: Ice team has picked up all cans, tag lines and parachutes and is returning to ship. 2300Z: NIC Ice buoy sent down in basket for ice team to set out. 2305Z: Ice buoy set on ice 2325Z: Ice team back aboard; Healy beginning to make way to take station astern of LSSL 105
106 2345Z: Back in the LSSL track line. September 8, 2011 JD Z: Mayer on watch 1016Z: We are approaching the waypoint to turn SE across the A/M Ridge but we have not reached the basin floor so they will not have a FOS point here have asked LSSL to turn to 3000 to hope to get to deeper water. 1033Z: LSSL agreed but seems dead set on going over WP have not come around yet 1037Z: Have finally come around after going through WP 1220Z: Finally down to 3912 m no clear slope break will turn around and head back to A/M Ridge now. 1600Z: Armstrong on watch 1615Z: Determined that LSSL was moving towards the rhumb line, where MBES coverage would be duplicated. Advised LSSL science and directed Healy bridge to stay on great circle track even though ice breaking is necessary. LSSL will regain planned great circle track. 1630Z: Stopping for flight quarters 1706Z: Secured from flight quarters, dropped XBT T5_ Z: moving forward to join LSSL track now that LSSL is back on great circle. September 9, 2011 JD Z: Backing and ramming(?) to get through broken rubble in track. 0112Z: Stopped while LSSL completes drills 0400Z: Mayer on watch 0830Z: We are crossing an amazing area of many small hyperbolic echos on the Knudsen EM122 shows highly corrugated seafloor (consistent with hyperbolic echoes) looks like ice scour but at 2400m??? Will be interesting to see processed MBES 1030Z: We have changed phase ramp to normal and to deep mode to increase spatial resolution 1048Z: Switching back to very deep mode to increase S/N ice is thickening. 106
107 1359Z: Have been going over the hyperbola for several hours first FM images show nothing coherent doesn t look like bedforms or ice scour have slowed to 2.5 knots to see if we can get a clearer picture of what they are. 1502Z: back to 5 knots 1600Z: Armstrong on watch; the ice is 9/10 to 10/10 and filling in the track fairly quickly. 1609Z: Backing and ramming through heavy rubble left in the track 1730Z: We may have left the region of hyperbolae as we crossed the ~2200 m depth contour. Only smaller, less numerous hyperbolae are present. 1930Z: Crossed T3 track from September 22, 1968 at N, W, allowing John Hall to meet up with himself 43 years later. 1956Z: Chief Scientist from LSSL called requesting increase in speed as this data has no priority for his cruise objectives. We will try to maintain 5 knots. 2010Z: LSSL reports shaft problems that will require them to stop. Healy stopped about 1nm astern LSSL. 2053Z: LSSL reports all 3 shafts on line and making way; Healy following suit 2230Z: Seeing hyperbolae on seafloor again, at depth ~2200 m. September 10, 2011 JD Z: Stopped for 23 minutes while LSSL breaks through thick ice. The path is completely closing in front of us. 0400Z: Mayer on watch -- continuing over hummocky topography 1200Z: Hyperbolic echoes on Knudsen finally end. 1330Z: LSSL at waypoint both LSSL and HEALY will look for openings for CTD station. 1407Z: At site for CTD 1430Z: CTD in water 1540Z: CTD on surface 1553Z: CTD on board; maneuvering to take station ahead of LSSL 1600Z: Armstrong on watch 1515Z: Began moving forward ahead of LSSL; target speed knots.; en route to wp
108 1730Z: It appears that our strategy in the lead will be to go ahead at 6 8 knots for a while the stop and wait for LSSL to close up, then go ahead again, and so on. 2135Z: LSSL sent helo out with dipping echo sounder, probably to obtain additional 2500 m soundings, since we are passing over that depth. 2145Z: stopped by large ridge; backed and rammed through, but left huge blocks in the path and LSSL could not get through; maneuvering to free LSSL. 2320Z: LSSL sending helo and ice observer out to see if conditions are any better ahead. September 11, 2011 JD Z: LSSL giving up on seismic pulling gear 0055Z: Dropped XBTs T5_00166 and T5_167; both appear to be bad, with temperatures around 5 C and irregular curves. Did not apply as SVP. 0105Z: Making way astern of LSSL, briefly until stopped by ice; backing and ramming to get through rubble pile. 0250Z: Making about 6 knots, data looks ok. 0345Z: Data getting poor and sparse as the track is closing behind LSSL; maybe better to stay within about a mile 0400Z: Mayer on watch 0420Z: The quality of the data we collect is much improved if we are closer to them (i.e. within a mile). Talked to OOD and OPS about trying to keep us closer even if it means speeding up. 0435Z: Switching to long phase ramp and equiangular to try to increase ability to detect bottom (at cost of resolution). 0520Z: LSSL stuck B&R we are waiting 0525Z: Back underway 0920Z: Track is closing up very quickly and we are having difficulty tracking bottom. LSSL seems to need to go fast to break ice and then slow down or stop and wait for us this puts them too far ahead. We can go slower but will never get to Sever Spur so we will just march along and hope for the best. 1032Z: LSSL having electrical problems have stopped we are waiting for them. 1204Z: Take XBT T-5 _ Z: LSSL reports they should be back on line in 40 minutes 108

109 1430Z: LSSL back on line backing and ramming 1600Z: Armstrong on watch 1620Z: Spoke with Chief Scientist LSSL; we will try to maintain 6 knots SOA, but will slow and call LSSL if any unusual seafloor feature appears that warrants better bathymetry. 1745Z: Chief Scientist on LSSL is altering course slightly by adding a new waypoint 146 to cross an existing seismic line more advantageously. LSSL will want, ice permitting, to redeploy seismic gear near the new waypoint. 2045Z: Crossed dip in seafloor as seen in Figure 36; may be a channel of some sort along the base of the Alpha-Mendeleev Ridge complex, and may coincide with the FOS. Figure 46 Subbottom profile coming down from Alpha Mendeleev Ridge onto Canada Basin September 12, 2011 JD Z: Crossed over abrupt 100 m rise (Figure 37) in the seafloor on the featureless abyssal plain detected on the chirp subbottom profiler. Unsure if this feature will appear in MBES as ice was causing poor returns. 109

110 Figure 47 Feature rising abruptly from Canada Basin 0140Z: Feature has passed from range 0203Z: Healy took over lead 0301Z: LSSL deployed seismic gear 0318Z: LSSL stuck in rubble, Healy will try to free them by backing down. 0358Z: backing to within 10 meters did not do the job; Healy will loop around to try passing along LSSL side. 0400Z: Mayer on watch 0423Z: LSSL freed up we are ahead of them now they are still streaming seismic 0520Z: LSSL stuck heading back to free them up 110

111 This is yet a new style of surveying -- epi-cyclic - steam ahead of LSSL LSSL gets stuck come back and free them up then steam ahead. Sometimes the HEALY gets pretty close to the LSSL to try to free her. Figure 48 HEALY backing to LSSL to try to free her 0540Z: LSSL free underway again 0644Z: LSSL giving up on seismic will pull the gear 0745Z: LSSL ahead HEALY following std mapping setup 4-6 knots nm behind LSSL - - heading for Sever Spur 1600Z: David wants to deploy seismic gear HEALY will get ahead of LSSL for a while before they deploy. 1602Z: Armstrong on watch 1630Z: LSSL is astern, assessing the ice to see if they can deploy gear 1828Z: LSSL deploying seismic gear, and will send us modified waypoints based on helo ice observations. 111

112 1900Z: Following revised track to avoid large floes 2000Z: Crossing over transition (Figure 39) from soft sediment to harder reflectors FOS? Figure 49 Transition from Canada Basin to slope with reflectors 2255Z: LSSL blocked by pan of ice; we are circling to free them September 13, 2011 JD Z: Crossed into Canadian EEZ; bottom rising steeply on charted high (Figure 40). 112

113 Figure 50 Bottom rising steeply on feature in vicinity of Sever Spur 0147Z: At waypoint 151, altering course gradually to head for waypoint 152, LSSL following astern. 0230Z: Depth is dropping back down abruptly. 0400Z: Mayer on watch Got the AUV track line from last year David wants to go over this as a check on the AUV echosounder it is somewhat south of our track line it falls directly on the rhumb line from WP10 WP11 (while we are steering the great circle). Have asked the bridge to meet up with this line so we can duplicate AUV line. 0520Z: As we are getting shallower coverage is increasing change swath angle to +/-54 also getting strong specular sidelobe increase forward tilt to 3 deg. 0530Z: Switching back to +/45 deg swath angle 0830Z: LSSL stuck going back to try to free them up. 0950Z: Free at last free at last. We re underway again. 113

114 Z: Several more stops and back to LSSL 1243Z: Captain reports that we cannot take LSSL where they want to go Captains chatting assume we will pull the gear and LSSL will attempt to lead. 1259Z: LSSL called they will pull their seismic gear in one hour we will wait here until then. Dale will do BIST test and see if he can change projection of SIS display to match the MapServer display. 1444Z: Gear pulled LSSL moving ahead to start MB survey 1600Z: Armstrong on watch, regaining planned track and crossing over top of elevated feature, depths somewhat less than 2400 m. 1800Z: On flat seafloor; subbottom profile is showing a lens of material (slump?) resting on top of main body of sediment. Figure 51 Lens of material at eastern base of slope of isolated elevated feature 2100Z: Bottom is rising, in what should be the main part of the slope. September 14, 2011 JD Z: Passing over the E edge of some elevated seafloor terrain on the generally upward trending slope (Figure 41). 114

115 Figure 52 Elevated feature on the slope 0400Z: Mayer on watch 0513Z: LSSL reports it cannot make further progress to the east so will turn south before WP and pick up track to WP151 now we will follow. 0530Z: LSSL called - having electrical problem with shaft will be another 15 minutes have asked MST s to take XBT 0548Z: XBT-T5_0169 taken good to 1830m - matched well with LSSL XCTD 63 Steve will use XCTD --getting underway 0838Z: Steve Wackowski reports launching UAV from LSSL first night flight with IR camera 0902Z: unfortunately UAV had equip failure and crashed while flying ahead of HEALY and LSSL good video recorded until then 1242Z: LSSL not making much progress last ridge took 18 rams got through and then got stuck about a minute later. David called will wait for Capt Rothwell to get up and then may turn west. 1530Z: LSSL stopped waiting to launch helo 1600Z: Armstrong on watch 1645Z: Making way again, through heavy ice, keeping speed up as needed to get through tight corners in track, abandoning track to SW and heading W. 2045Z: Seafloor is beginning to rise as indicated on Russian map and, more subtly, on IBCAO. 2118Z: Over the top. 115
116 September 15, 2011 JD Z: Mayer on watch We are starting to cross a significant topographic feature that is not on either the Russian or IBCAO maps. From base of about 3000 m it is rising to at least 1850m 0440Z: Over the top interestingly the far (southwestern) side is about 400 m shoaler than the northeast side 1148Z: Balloon launched 1342Z: David called wants to give the seismic a try. Wants HEALY to go in lead to see how it works. Need to put 3 rd engine on will take half hour. 1443Z: Ahead of LSSL they say it s very nice back there track looks good will deploy seismic gear at 1500Z. 1515Z: Waiting while LSSL is deploying gear ice under xducers will back a little to see if we can clear. 1522Z: XBT-T5_170 taken good to 1830 m. 1600Z: Armstrong on watch, stopped awaiting signal from LSSL to make way. 1634Z: Making way ahead of LSSL. 2000Z: Most data on this line is poor as we are breaking pretty heavy ice. 2205Z: Left Canadian EEZ, incremented line number in SIS. September 16, 2011 JD Z: About at the base of the slope of the outermost ridge; very poor multibeam data; captured faintly L 0142Z: LSSL is stuck; looping to free them 0330Z: LSSL is moving forward. 0400Z: Mayer on watch 0430Z: Captain called she says we are probably nearing the end of our ability to lead LSSL many tough ridges ahead. Called Dave and told him he will talk with Capt. Rothwell and put crew on standby to pull gear. Just as we are talking we get hard stuck 0449Z: Decision to pull gear we are trying to turn around David provided new waypoint back down line so we can pick up bathy and 3.5 along track we just came down. 116
117 0505Z: Gear pulled LSSL coming around to take lead. 0520Z: Underway behind LSSL 0930Z: Arrived at WP2 on mapserver mapserver and my discussion earlier with David had us offsetting to northeast and taking reciprocal line back to WP155A(2) LSSL bridge had us turning southwest they called David much confusion final decision we will just follow the LSSL to southwest and then reciprocal for 20 miles then on direct line to 155A(2). One lesson learned they need to be able to talk on the phone and see MapServer at the same time 1019Z: The previous line running was very noisy with the track closing rapidly we note that now that we have turned to heading 216 the track is staying open, we have much less noise and are collecting good data. Wind is coming from 315 at about 20 knots earlier now about15 knots. 1129Z: As we came around to course 310 the track is closing up again true wind 317 speeds 10 knots not as bad as reciprocal course earlier. 1433Z: We are crossing over area that has been well mapped on earlier leg LSSL and HEALY will speed up to try to make up some time 1501Z: crossed pre-mapped area slowing back to knots 1524Z: LSSL reports that they have to stop for an hour to adjust engine room gland. We will slow to 2 knots as we approach them. 1600Z: Armstrong on watch. David reports that helo has found pond in general vicinity of waypoint 4; we will continue following LSSL in that direction, either until LSSL releases us and continues toward pond for AUV, or they change plans. 1603Z: XBT T5_00171 complete, good profile. Will stay with LSSL XCTD SV profile, though. 1800Z: Seafloor has remained flat with flat-lying sediment on subbottom; no sign of any alternate FOS out here; 1807Z: No sign of any change in seafloor as we crossed an IBCAO 3500-m contour to port; David and I have agreed that nothing else is likely to show up as an alternate FOS and Healy is detaching from LSSL en route waypoint w5 to start AUV operations. HEALY will head off alone attempting to better map Sever Spur. 1915Z; In pretty heavy ice; not getting very good soundings. 1930Z: Informed by the bridge that the ship would be stopped for about 20 minutes for Quarters. 1943Z: Quarters is over, making way again. 2135Z: Beginning to see upward slope at nadir and on subbottom profiler. 2153Z: Stopped briefly; about 4 minutes; no explanation 2207Z: Heavy area; backing and ramming multiple times. 117

118 September 17, 2011 JD Z: Came to all stop for engine repair. 0250Z: Dropped XBT_ Z: Making way again, coming onto new heading for waypoint w Z: Mayer on watch 0600Z: coming over the top of a high very tough going lots of backing and ramming data is not the best but usuable. 0717Z: Big thick flow having real difficulty getting through Z: We are really not getting much in terms of bottom returns so we will try a new approach the hokey-pokey. Stop the ship tilt the beams from -10 degrees to +10 degrees in about 2 degree increments. We then steam ahead about a mile and do it again. See Figure 43 for difference. HOKEY-POKEY Figure 53. "HokeyPokey" survey vs standard attempt to get data in heavy ice 1030Z: Approaching end of line will start slow turn 1410Z: Clear 40 m step up on the Knudsen (Figure 44) 118
.")

119 Figure 54 Step up heading NE toward Sever Spur 1537Z: We steamed through nice open pond called bridge to remind them that we were looking for open water for CTD station 1600Z: Armstrong on watch, continuing Larry s hokey-pokey approach. 1736Z: Encountered large pool of open water; stopping for CTD and engine repairs; will be in place until approximately 1800 Local time (0100Z). 1805Z: CTD in the water, target depth about 50 m off bottom, which should be about 3200 m. 2052Z: CTD on deck. 2117Z: Dropped XBT T5_00172a; auto sequencing failed, so this XBT file overwrote the last file. Steve has backup, and will save data as 172, so this XBT is labeled 172B. The SVP from the XBT with CTD salinity applied matches the SVP from the CTD; we are applying the SVP from the CTD. September 18, 2011 JD Z: Making way forward in pool to deploy AXIB Seasonal buoy. 0242Z: Buoy deployed. Moving to resume line over ridge toward new waypoint w6, on two engines while work on third continues. 0400Z: Mayer on watch Continuing down back side of outer ridge on Sever Spur goal is to map southeast to southern spur of inner ridge and turn WSW heading to LSSL position should also see if this ridge connects to one southwest of it. 0800Z: Approaching end of line we have come over the second rise and are now on back side we will turn to WSE and head to LSSL rendezvous point Have to try to run at 5-6 knts to get there in time will not collect much useful data 119


120 0835Z: Knudsen shows that 2 nd ridge is starting much sooner than charts show but there is a deep between the two (Figure 44) 0930Z: Huge ridge we literally bounce off it maneuvering to try to get around it. Well. We are trying to maneuver around it not getting very far. 1009Z: Have gotten around it are moving again. Figure 55- Deep between ridges on Sever Spur 1528Z: Crossed over Canadian EEZ started new file 1600Z: Armstrong on watch 120
121 1650Z: Crossing an elevated feature, visible in subbottom, but not apparent in mbes display 1720Z: Tough spot; backing and ramming; got some mbes ridge visible to starboard in mbes. 1900Z: Heavy ice is slowing our rate of advance to about a 3 knot average (harmonic mean). September 19, 2011 JD Z: Joining up with LSSL; we will take lead and transit to first waypoint, then from there to next waypoint, LSSL will simulate towing seismic to see if ice conditions will permit them to deploy the gear. 0225Z: David called to say that seismic is not feasible on this heading in this area; LSSL will lead to the next waypoint; then we will reassess. 0230Z: LSSL in lead; we will keep pace with LSSL and accept whatever data we can get. 0400Z: Mayer on watch David has sent a series of alternative waypoints further west if the ice is not conducive for seismic at WP we are approaching decision will be made when we read original deployment point. 0600Z: Got to WP and LSSL determined that they will not be able to make way with 2 shafts and track is closing fast. Spoke with David decision is to have LSSL take lead and continue on original southerly track (not western alternative) and try to maintain 5 knots so that we can get to long E-W seismic line with enough time to complete. The E-W seismic line is David s highest priority now. 0639Z: LSSL has pulled ahead we are getting underway behind them 1100Z: Continue to steam along very flat seafloor with limited coverage because of our speed approx m every once and while LSSL has to stop to back and ram and we take advantage of that to Hokey Pokey fills in some of the coverage 1459Z: David called wants to deploy seismic gear will stay with the original waypoints (eastern line). Bridges will coordinate switch 1537Z: Moved ahead of LSSL they will begin streaming gear 1550Z: XBT T5_00174 taken good to 1830 m 1600Z: Armstrong on watch. 1945Z: Got word from LSSL (via Ops) that LSSL center shaft is out of service, and that joint science mission is essentially ended. LSSL is conferring with CCG HQ to determine next steps. Rafting is TBD. Healy will stay in this location and attempt repair of CTD hangar door. Expect some additional information tomorrow morning. 121
122 2130Z: Taking this opportunity to switch back to the primary POS MV unit, and reset the the projection in the SIS coverage display so orientation matches the MapServer. September 20, 2011 JD Z: Mayer on watch still waiting for resolution of LSSL issues. Also HEALY in attempt to fix door to CTD room has left it in stuck closed mode so for now we can t even take a CTD ship will look into this further. 1600Z: Armstrong on watch; we are bringing engines up to prepare to come alongside LSSL for rafting. 1615Z: Making way to take position for mooring starboard side to LSSL. 1855Z: Rafted to LSSL. We will not be maintaining a survey watch during rafting. September 21, 2011 JD Z: Mayer on watch. Unrafted and getting underway. LSSL has determined that its main prop has loosened on the shaft and has backed off a little they have to secure the shaft and prop. They need to go to drydock and we need to escort them to open water asap. The shortest route to open water appears to be SW heading ~222. They would like to do this at between 6 and 7 knots which is too fast for good data collection we will do what we can but getting LSSL to open water is now primary mission. This is not much of a compromise as we are basically over abyssal plain. Looks like open water is approximately 200 m to SW. 1212Z: Christy noticed that previous watch did not log a change in file at the EEZ crossing. There was an automatic line change 1107Z that may be very close or exact but this should be checked. 1600Z: Armstrong on watch 2050Z: Came to stop to allow LSSL to launch ROV for shaft/propeller inspection. 2215Z: LSSL ROV on deck, resuming transit out of ice. 2230Z: Reducing speed for repair of minor flooding in a lower deck space. September 22, 2011 JD

123 0400Z: Mayer on watch. We continue to lead the LSSL out of the ice averaging about 6 knots. Data is reasonable but not much to see as we cross the Canada Basin. At about 0400Z we note that new waypoints have appeared on the MapServer indicating that we will not be heading to the nearest open water but rather continue south through the ice heading SE towards entrance to NW Passage. Can only assume that LSSL has requested our assistance to that point. 1230Z: Crossing interesting feature visible in subbottom profile, Figure 46. Figure 56 Subbottom profile of sediment bending on seafloor 1600Z: Armstrong on watch. 1730Z: Stopped so LSSL could do an additional ROV check on their propeller; we will take a CTD to 500 m. 1752Z: CTD in the water 1930Z: CTD on deck; flight quarters to receive LSSL. 1955Z: Secured from flight quarters; dropped XBT T5_00175; good to 1830 m. LSSL passed close aboard for parting exchange of salutes the two ships departed on their separate tracks; LSSL for the NW Passage and Healy for Barrow Margin mapping area. 123
124 September 23, 2011 JD Z: Passed off southern end of large lens with no internal reflectors resting on the seafloor (Figure 47). This lens of material has been below us for about 25 miles. We pulled last year s profile from nearby and see the same feature. Figure 57 Southern end of lens on seafloor 124


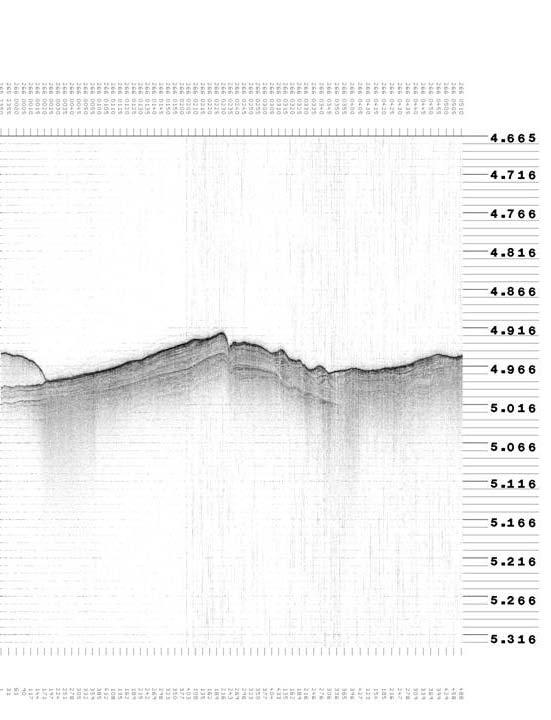

125 Figure 58 Composite of lens and sediment distortion 125
126 0400Z: Mayer on watch - continuing to steam towards Dutch running above 16knts and MB data is looking fine. We are now in mostly open water thought there are still patches of ice about. 1130Z: Bottom is starting to slowly shoal. On Knudsen we are seeing more indications of transported packages (these more chaotic and showing erosion on surface) probably seeing distal influence of MacKenzie Delta. 1300Z: SVP alarm on SIS the water temp on TSG has risen considerably in last few minutes (about 0.5 deg) we have asked for new XBT. 1313Z: TSG temp has fallen again and SVP alarm is off so we will leave as is for now but clearly we are getting into more complicated water masses. 1315Z: XBT-TD_00177 taken shows a thin (about 20 m thick) warm layer of about 0 deg C on surface. Will ask for this profile to be entered as TSG is also showing warming of surface water. 1530Z: Knudsen showing very rough bottom BACKSCATTER LOOKING INTERESTING SHOULD LOOK AT BACKSCATTER HERE!!! 1600Z: Armstrong on watch. 1920Z: Coming onto westward Barrow Margin survey line. Slowing to 8 kt, launch XSV S2_00179 and XBT T5_00181 (no 178 or 180). 1940Z: Drops complete, resuming 15+ knots survey speed. 2325Z: End 1 st westward line, begin turn onto eastward line. 2347Z: Turn completed, beginning eastward line; reducing speed to 8 knots to launch XSV and XBT. September 24, 2011 JD Z: XSV S2_00183 and XBT T5_00186 (no 182 or 184, 185). 0400Z: Mayer on watch Just finishing up Barrow Margin survey. Final line to west and then full steam ahead to Dutch. 0618Z: Finished up small hole in Barrow Margin survey and heading to Dutch official ECS data collection completed for this leg. 1300Z: Coming up on the shelf. Asked for XBT but MST s cant do it because of Polar Bear initiation. 1437Z: Attempted T7 XBT but broke at 15 m depth. 126
127 1442Z: Took XBT T7_ got to bottom shows remarkable change at 70m is it real??? 1531Z: Took XBT TD_ maybe a bit better. 1600Z: Armstrong on watch 1749Z: Deployed Ocean Drifter buoy at 16 knots 2250Z: Crossing an area of sloping beds and a small syncline seen on subbottom profiler beneath thin sediment cover. Figure 59 Truncated tilted layers, anticline and syncline September 25, 2011 JD Z: Changed to Alaska Daylight Savings Time; changed SIS to new survey in Mercator projection and realigned coverage and helmsman displays 0400Z: Mayer on watch Steaming to Dutch Harbor 127
128 September 26, 2011 JD Z: Passing through Bering Straits clear and calm passing close to Big and Little Diomede Islands CG doing nav training. 0500Z: Stopping for anchor and small boat drills. September 27, 2011 JD 270 Steaming to Dutch Harbor September 28, 2011 JD 271 Steaming to Dutch Harbor 1700Z: Sept 2011 ADT Arrived Dutch Harbor. 128
129 HEALY XBT/CTD LOG STA NUM CRUISE LONGITUDE LATITUDE CAST DEPTH 001avg.cnv HLY avg.cnv HLY avg.cnv HLY avg.cnv HLY avg.cnv HLY avg.cnv HLY avg.cnv HLY avg.cnv HLY
130 CTD 001 CTD
131 CTD 004 CTD
132 CTD 006 CTD
133 CTD 008 CTD

134 XBT LOG 134

135 XBT LOG 135
136 136
137 137
138 138
139 139
140 140
141 141
142 142
143 143
144 144
145 145
146 146
147 147
148 148
149 149
150 150
151 151
152 152
153 153
154 154
155 155
156 156
157 157
158 158
159 159
160 160
161 161
162 162
163 163
164 164
165 APPENDIX A - USN METOC Report CMDR Ivo Prikasky Fleet Weather Center, Norfolk Strike Group Oceanography Team Operations Officer ivo.prikasky@navy.mil HEALY 1102 Post-Deployment Report Fleet Weather Center, Norfolk (FWC-N) Mobile Environmental Team (MET) consisting of myself and AG2(AW) William Dearing deployed onboard USCGC HEALY (WAGB-20) from 15 August to 28 September 2011 in support of HLY 1102 deployment in the Arctic Ocean. The area of operations included the Chukchi Cap, the Makarov Basin and the area around Sever Spur. The MET deployed as a part of the science party led by Chief Scientist, Dr. Larry Mayer of the University of New Hampshire Center for Coastal and Ocean Mapping/Joint Hydrographic Center (UNH-CCOM/JHC). The HLY 1102 was a joint US-Canadian operation with the Canadian science party embarking on CCGC LOUIS S. ST. LAURENT (LSSL). The primary purpose of the joint HEALY-LSSL mission was to collect mapping and geologic data in support of delineating the extended continental shelf in the western Arctic Ocean for both the United States and Canada. The extended continental shelf is that region beyond 200 nautical miles (from shore) where a nation can show it satisfies the conditions of Article 76 of the United Nations Convention on the Law of the Sea. The critical data required for fulfilling the conditions of Article 76 are bathymetric and seismic data. USCGC HEALY is equipped with an EM-122 Multibeam Echo Sounder (MBES) to collect bathymetric, high-resolution subbottom data and the LSSL is equipped with seismic gear to collect multichannel seismic reflection and refraction data. Two other Navy commands were represented on this mission. The Naval Ice Center (NIC) ice analyst Steve Lilgreen and the NIC Chief Scientist Pablo Clemente-Colon (NOAA) provided sea ice guidance and led a program of routine characterization and assessment of sea ice conditions, and deployed buoys in support of the International Arctic Buoy Program (IABP). The NIC team worked hand in hand with Canadian Ice Service analysts embarked in the HEALY and LSSL. The Naval Oceanographic Office (NAVO) embarked two GS civilians from their Hydrographic shop, Matthew Thompson and Natalie Lamberton who stood watch overseeing the multibeam sonar and processed the raw bathymetric data. They ensured that all bathymetric and seismic data collected during the mission would be delivered to NAVO. Goals of FWC-N MET during this deployment were as follows: 165
166 Perform and transmit RAWINSONDE upper air meteorological observations in an operationally relevant timeframe to ensure receipt by the Fleet Numerical Meteorological and Oceanographic Center(FNMOC) in support of current model run and Arctic model validation/verification project as tasked by NOOC Obtain and transmit surface atmospheric observations in an operationally relevant timeframe to ensure receipt by FNMOC in support of current model run Conduct a proof of concept to demonstrate that FWC-N is fully capable of supporting Arctic operations Obtain and transmit XBT data to NAVO Obtain and archive all available meteorological and oceanographic data collected during the cruise. The data would be turned over to FNMOC, NAVO, Naval Research Laboratory (NRL) and Naval Postgraduate School (NPS) for further use and research Collect and archive sun photometer measurements to be used as validation points for NRL s satellite retrievals of aerosol properties in support of the Maritime Aerosol Network (MAN) Gain first-hand forecaster operational experience and knowledge of Arctic environment Develop and foster relationships with embarked science team and USCG personnel The goals were accomplished as follows: 47 RAWINSONDE upper air observations were performed and transmitted to FNMOC via FWC-N watchfloor All surface atmospheric observations taken during the cruise were transmitted to FNMOC via FWC-N watchfoor AG2(AW) Dearing supported the ship, embarked science party, Canadian helicopter detachment, and USAF UAV detachment with full spectrum METOC services with the assistance of FWC-N watch floor. Lessons learned were generated and included in the MET Post-deployment report 62 XBT drops were transmitted to NAVO Raw data from the automated shipboard sensors and 8 CTD casts were archived and transported back for future use by FNMOC, NAVO, NRL, and NPS Sun photometer measurements collected during the cruise would be transported back for delivery to NRL Cross-training was conducted between AG2 Dearing and the ship s Marine Service Technicians (MSTs) MET received training from NIC and Canadian Ice Service ice analysts Great deal of information exchange occurred between the MET and other science party members. MET participated in nightly 166
167 science seminars presented by other embarked scientists. I received training in hydrography, ice observation and analysis, and stood break-in OOD watch for a part of the cruise MET deployment during HLY 1102 provided highly valuable experience in Arctic forecasting and operations. The MET demonstrated that FWC- N is fully capable of providing METOC services in the Arctic region. The HEALY s crew and the Chief Scientist were highly satisfied with the services provided by the MET and the Chief Scientist expressed the desire to continue cooperation on future Arctic missions. As the Navy expects increased operations in the Arctic region, Navy METOC community needs to take advantage of this tremendous opportunity and continue this partnership in the future. Very respectfully, CDR Ivo Prikasky, USN Fleet Weather Center, Norfolk Strike Group Oceanography Team Operations Officer ivo.prikasky@navy.mil 167
168 APPENDIX B - National Ice Center Report Pablo Clemente-Colon Chief Scientist National Ice Center - NOAA September 28, 2011 NIC/CS-E/RA3:PCC MEMORANDUM FOR THE RECORD FROM: SUBJECT: Pablo Clemente-Colón, Chief Scientist National Ice Center - NOAA Sea Ice Science Team Trip Report USCGC HEALY HLY1102 Arctic Cruise, Barrow, AK/Dutch Harbor, AK, August 15 to September 28, 2011 HIGHLIGHTS NIC, CIS, and IARC provided sea ice analyses and routine on board sea ice observations during the cruise NIC provided targeted remote sensing data collection coordination and analysis in support of cruise routing and science A collaborative experiment in coordination with CSA, CIS, MDA, KSAT, and e-geos included multi-satellite and dual-polarization data collection and sea ice observations for validation USIABP buoys were deployed throughout the cruise on a non-interference basis TEXT The primary science objective of the 2011 USCGC Healy cruise HLY1102 is to support seismic operations on the Canadian Coast Guard icebreaker Louis St. Laurent (LSSL) and to collect morphologic data in support of determining the extended continental shelf (ECS) of the United States and Canada. The Healy departed from Barrow, AK on 15 August, 2011 and returned to Dutch Harbor, AK on 28 September with most of the cruise being carried out as a two-icebreaker mapping mission continuing joint ECS data collection started in 2008 and continued in 2009 and The Healy joined the LSSL on 23 August near 165º 54 W 78º 17 N. The ships parted company on 22 September near 138º 38 W 75º 54 N. The cruise Chief Scientists is Larry Mayer, from the Center for Coastal and Ocean Mapping (CCOM)/Joint Hydrographic Center (JHC) at the University of New Hampshire (UNH) sharing Chief Scientist responsibilities with Andy Armstrong, from NOAA/NOS and JHC. The area of operations included the Chukchi Cap, the Makarov Basin and the area around Sever Spur. Throughout the cruise, the National Ice Center (NIC) provided sea ice guidance and led a program of routine characterization and assessment of sea ice conditions. The Healy Sea Ice Science Team included Steve Lilgreen, a NIC Analyst, Jacques Collin, a CIS Ice Service Specialist (ISS), Alice Orlich, an ice observer and Research Assistant at the International 168
169 Arctic Research Center (IARC) University of Alaska Fairbanks (UAF), Roland Arsenault, a data visualization Research Scientist from the University of New Hampshire, AG2 William Dearing, a weather forecaster from the Navy Forecast Weather Center (FWC) in Norfolk, and myself. NIC personnel both on land and aboard worked before and during the cruise to secure access to required imagery for tactical support providing near-real time analysis and daily tailored sea ice support during icebreaking operations. Collaboration on a Canadian Space Agency (CSA) Earth Observation research project with MDA, and CIS has resulted in unprecedented planned collections of RADARSAT-2 single and cross-polarization imagery in support of the joint ECS cruise. This is in addition to available Envisat ASAR imagery through the British Antarctic Survey (BAS) PolarView and the Kongsberg Satellite Services (KSAT) ICEMAR projects and to some COSMOS/SkyMed X-band collections done by e-geos as a demonstration of high-arctic capabilities. A daily sea ice brief was given by the NIC Analyst to the Healy s Commanding Officer (CO) and the Co-Chief Scientists after he and the CIS Ice Service Specialist obtained, shared, and analyzed, imagery and other products to produce analyses or forecast trends of sea ice conditions throughout the following segments of the cruise. Before each brief, a sea ice science coordination team meeting was conducted where we reviewed weather forecast and potential impact on sea ice conditions, analyzed imagery, data access issues, visual sea ice observations and charting, as well as progress with the geocamera data processing. Thanks to a waiver secured by the NIC from MacDonald, Dettwiler and Associates (MDA), owners of RADARSAT-2 (R-2), sharing of all R-2 data collected during the joint segment of the cruise, i.e., 23 August-23 September, was allowed for full and free exchanges between NIC and Canadian Ice Service (CIS) and between the Healy and the LSSL securing full access via ftp to the R-2 SAR imagery aboard both icebreakers. These data will be consolidated into a database to be used by participants in support of a CSA Earth Observation Applications Development Program (EOADP) R-2 dual-polarization sea ice research project. We were also able to successfully test secondary access to SAR imagery as a backup option through an innovative low-bandwidth approach that uses Java technology and provided courtesy of BAS and KSAT. Help with the Java setup on the NIC analysis laptop and network support was provided by David Hassilev, who provided IT support for the Healy. The Sea Ice Team carried out a program of routine observations for characterization of the sea ice cover for the validation of remote sensing imagery, techniques, and operational analysis. This included the collection of photographic evidence and assessments of ice type and thickness as the Healy navigated through the marginal ice zone (MIZ) and the pack ice. The UNH s geocamera System deployed by Roland aloft the Healy conning tower collected georeferenced images of ice conditions while underway, a ground-breaking approach in the region. The geocamera hardware consists of a digital AXIS camera mounted on a pan and tilt unit both being controlled by a computer. Recorded position from GPS and platform motion from an attitude sensor are then used to ortho-rectify and georeference the images in order to add them to the remote sensing database for analysis and validation of sea ice concentration and floe sizes. Remapping and mosaicing of some of the geocamera imagery was achieved during the cruise with additional tuning and application to a larger set of the collected data sought. Unfortunately, the geocamera panning system failed during the cruise most likely due to the extreme vibrations experienced during icebreaking. Complementing the geocamera observations, a higher resolution but static Healy AXIS aloftconncam recently installed by Steve Roberts, who provides science systems support for the Healy, showed an unexpected capability to support sea ice type characterization over a wide area. Work on correcting and georeferencing these additional images started aboard, after calibration of the camera was accomplished, with a very encouraging mosaicing of a few test images done by the end of the cruise. Furthermore, the expectation is that the addition to this high resolution forward-looking wide-angle camera of two 169
170 additional cameras looking to the port and starboard sides will provide a much more robust mechanism to visualize the sea ice conditions around much of the ship than a single panning camera. Future use of a roughed panning camera can be focused toward downward observations along the side of the ship to provide a close view of the ice floe and snow cover thickness as well as stages of growth and melting characterization. In addition, we look forward to explore the potential applicability to sea ice of the observations collected by CAPT Steve Wackowski, USAF using the RAVEN unmanned aerial vehicle from the LSSL. The NIC personnel provided sea ice analysis insight and information to personnel from the Navy FWC participating in the cruise, which included CDR Ivo Prikasky in addition to AG2 Dearing, a key interaction as the Navy develops its concept of operations and prepares for increased activities in the Arctic. Discussions on the daily launch of weather radiosondes by FWC led to the potential for collaboration, particularly if ozone sondes can be included, during the upcoming sea ice and atmospheric chemistry BROMEX2010 field experiment in the Beaufort Sea next March. The NIC team also provided three science talks aboard the Healy covering sea ice characterization, changes of the Arctic sea ice pack, the role of the buoy program, and the NIC and CIS sea ice charting and analysis. Presentations on sea ice charting and the egg code were also prepared for the Healy Captain, OPS, and the Co-Chief Scientists. The Sea Ice Team routinely provided input to the onshore NIC and CIS analysts during the cruise as well as compared the in-situ observations with other remote sensing analyses and products available, particularly, confirming the relative high presence of FYI and Second Year Ice (SYI), versus MYI in the pack and positively impacting the centers assessment and analysis. While in ice, Alice conducted systematic and routine hourly sea ice observations from the bridge, daylight providing. Supporting photographic evidence from the observations was collected to study specific features and characteristics of the transited ice. This system is a continuation of the ship-based sea ice observation program that she and Jennifer Hutchings, a Research Assistant Professor at IARC, have conducted from the LSSL since The forward-looking and port-side webcameras mounted on the LSSL captured ice conditions throughout the ECS mapping campaign, as they had for the previous 6 annual Canadian Joint Ocean and Ice Study (JOIS) cruises. The port-side camera is trained on a measurement pole set perpendicular to the ship, which aids in the estimation of ice thickness and snow cover. This growing image collection will aid in the analysis of sea ice concentration and type throughout the Beaufort Sea and Canadian Basin during the melt and freeze-up seasons. Given that the Alfred Wegener Institute (AWI) Polarstern icebreaker transected some of the general pack ice region later traveled by the Healy, Alice requested their sea ice assessment from Stefan Hendricks. Once received, these data will also be added as part of the cruise database. Alice collected two ice cores while assisting in the deployment of an Environment Canada ozone, carbon dioxide, bromine monoxide and meteorological observations buoy (O-buoy). These samples will be used to identify the floe s age and structure which aid in the monitoring of the buoy and understanding of the floe condition. Additionally, the samples were shared with Lisa Robbins and Jonathan Wynn of the USGS also aboard the Healy during this cruise. This spontaneous sea ice sampling collaboration was the first opportunity for Robbins and Wynn to examine young and multi-year sea ice to determine the presence and concentration of the mineral ikaite, a study relevant to their research on ocean acidification and the carbon cycle in the Arctic. As part of the efforts to maintain and expand the U.S. Interagency Arctic Buoy Program (USIABP) network, buoy deployments were carried out as an ancillary program and on a non-interference basis as time permitted during the cruise. The buoys and equipment were brought on board at Seattle, WA, Kodiak, AK, and in Dutch Harbor, AK. METOCEAN and TechOcean ocean drifters left onboard can be available for additional deployments by MSTs pending coordination with the Polar Science Center (PSC), or if not deployed, will stay onboard for pickup in Seattle. 170
171 The initial deployment was of an UpTempO (Upper Temperature of the Ocean) buoy (ARGOS #610530) on 17 August in open water to the south of the ice edge in the southern Beaufort Sea just north of the continental shelf. First observation of sea ice occurred on 18 August at ~11:30 am (AK time) with 0-2 tenths concentration of melting floes of multiyear ice (MYI) origin up to several meters in diameter as we moved north to meet the LSSL. Deployment of SVP (Surface Velocity Program) TechOcean and METOCEAN drifters in open ocean, within the MIZ and on sea ice were done throughout the cruise. SVP deployments on ice depended on suitable opportunities for the Healy to stop and allow on ice operations or access to the LSSL reconnaissance helicopter flights. On 3 September, two SVPs, METOCEAN 12 (ARGOS #98978) and a TechOcean (ARGOS #83465), were deployed from the Healy around 154 º W 88 º N on a stable first year ice (FYI) floe and about 5m from each other to track their relative robustness and compare their performance. Using the helicopter on the LSSL, Alice deployed another SVP, METOCEAN 13 (ARGOS #98986), on a MYI floe side-by-side an O-buoy that she also helped deploy for the Canadian buoy program on 5 September near 166 º W 88 º 6.16 N. METOCEAN 2 (ARGOS #37180) SVP was then deployed on second year ice on 7 September around 158 º W 86 º N. SVPs are in fact open ocean drifters that come assembled with a 15m drogue attached to the buoy with a steel wire. In order to deploy the SVPs on ice we cut the wire near the end of the rubber tip that extends from the bottom of the buoy and hand-drilled a less than 1 ft bore hole on the ice to accommodate the rubber extension on the underside providing added stability by packing snow around the base of the buoy. Given the number of unused drogues collected, I suggest that for the Arctic program s potentially ice-deployable SVPs, a hook on the wire can be added so that drogues can be attached or detached depending on whether we want on ice or on water deployment. Two AXIB (Airborne expendable Ice Buoy) seasonal buoys, AXIB 011 (ARGOS #46517) and AXIB 012 (ARGOS #46516), were also deployed within the pack ice on 30 August at 169 º W 85 º N in a small area of nilas within a 5/10 FYI pack with up to 4/10 Old ice floes around and on 17 September at 125 º W 80 º N on an open but rapidly closing fracture within a 7/10 MYI pack, respectively. Additionally, a third AXIB, the first successful airborne deployment of these seasonal buoys, was dropped from a USCG C-130 ADA flight over open water coincident with this cruise near 73N W on 23 August (ARGOS #46514). On our way back, away from the ice edge toward the Alaska coast, we deployed TechOcean buoys in open water at 148 º W 71 º N on 24 September at 00:11 UTC (ARGOS #83466), 157 º W 71 º N at 17:50 UTC (ARGOS #83468), 163 º W 70 º N on 25 September at 01:40 UTC (ARGOS #83467), and at 167 º W 69 º N at 10:07 UTC (ARGOS #83469). ACTION ITEMS Assemble all NIC and CIS RADARSAT-2 imagery collected during the 23 August to 23 September MDA-sanctioned sharing period Assemble all other imagery and data collected during the period including Envisat SAR, passive microwave, visible data as available, and sea ice analyses e-geos EULA to gain access to the CSK data acquired during the cruise Obtain geocorrected geocamera and aloftconncam sea ice imagery collected during the cruise from UNH. Estimate the cost and seek support to purchase and integrate two additional high-resolution AXIS aloftconncams for port and starboard views to the Healy for testing next season Discuss with CRREL, NASA and others the potential development of a sea ice cruise into the 171
172 pack ice with routine on ice opportunities for characterization of the ice floes via coring Catalog by day and UTC hour the photo observations from multiple camera sources available Secure sea ice observations made by Polarstern and compare to Healy and LSSL s Investigate potential utility and lessons learned from the RAVEN UAS flights on the LSSL Follow-on on with FWC-Norfolk and others on the possibility of adding ozone radiosonde launches during the upcoming BROMEX2012 field experiment Coordinate week visit to NIC for discussion and exchanges with Science and OPS analysts by Alice Orlich next spring Discuss with CIS potential ISS participation on NAIS meetings and committees. 172
173 APPENDIX C - GeoCamera Report Roland Arsenault Center for Coastal and Ocean Mapping/Joint Hydrographic Center University of New Hampshire Durham, N.H roland@ccom.unh.edu Background The original geocamera was conceived to help quantify ice coverage during the MishapX cruise to the western Antarctic peninsula in 2010 on the Nathaniel B Palmer. The marine mammal observers were seeking a method to augment their population data with ice coverage along their survey routes. The system implemented was based on a Canon 40D Digital SLR camera and a digital pan and tilt unit controlled by a laptop. The system was not waterproof and had to be under constant supervision, therefore it was deployed in the mornings, weather permitting, and recovered nightly or when threatening weather approached. The system successfully captured imagery and metadata which were processed into ice maps with a radius of up to 1KM around the ship. This initial prototype was deemed a success, but some weaknesses were identified in order to make the system more robust and capable of continuous deployment. geocamera V2.0 Version 2.0 of the geocamera is based on new hardware and is being deployed on a new vessel requiring new software to be developed for camera control and data processing. Hardware For deployment on the HLY1102 cruise, geocamera V2.0 was developed based on an Axis Q6034-E PTZ Dome Network Camera, an off the shelf security camera capable of operating in cold climates. Camera control as well as data collection and processing was done on a Dell Precision M6300 located in the Future Lab. The camera was installed outside of the AloftCon on the forward rail at an approximate height of 30 meters above the water line. 173

174 Figure 1: The geocamera V2.0 installed outside the AloftCon on the USCGC Healy. Software Scripts written in the Python programming language were developed to control the Axis camera over its VAPIX http-based API. Initial data processing scripts were also developed in Python with the goal to automate the creation of ice maps. Those initial command line scripts were easy to develop but were not very efficient. Processing time was many times longer than the collection time for a given data set, unnecessarily prolonging the iterative development process. The slow processing times along with the desire to have interactive control of some key parameters prompted the development of a new processing application written in C++ and featuring a graphical user interface (GUI). This new tool, called geocamtool, took advantage of the available graphics hardware to significantly accelerate the reprojection of images. This allowed interactive tweaking of some parameters using sliders while instantly seeing the results. 174


175 Figure 2: geocamtool interface showing project management options. Figure 3: The geocamtool's map editor showing a frame in its original perspective view. 175

176 Figure 4: A single frame shown reprojected onto the sea surface. Results Although data was collected almost continuously, the tools necessary to process that data were not ready until the last quarter of the cruise. The data processing pipeline still leaves quite a bit of room for enhancements and consequentially it currently takes roughly as much time to process the data as it takes to collect it. For this reason, only a few select portions of the data have been processed by the end of the cruise. The data to process was chosen to coincide with available synthetic aperture radar (SAR) ice imagery (RadarSat) that was captured when the ship was located within the satellite's field of view The USCGC Healy, followed by the CCGS Louis S. St-Laurent can be seen as bright dots in the SAR image taken at 2:51UTC on Maps from geocamera imagery were created form data around the time the SAR image was taken as well as 2 hours before and 5 hours after. The resulting maps were loaded into Qantum GIS and compared with the SAR image. 176


177 Figure 5: Features visible in the SAR image match the ones seen in the geocamera map generated from data acquired around the time the SAR image was taken. Figure 6: Image taken from the geocamera at about 2:50GMT on

178 Figure 7: A slight mismatch can be seen between geocamera images and the SAR image taken about 2 hours later, presumably due to ice drift. 178

179 Figure 8: Larger mismatch can be seen between the geocamera images taken 5 hours after the SAR image. A narrower map resulted from limited visibility. 179

180 Figure 9: Visibility was sometimes limited as can be seen in this image taken at 07:00GMT on Higher ice coverage was seen this day with numerous refrozen melt ponds. 180


181 Figure 10: Denser ice coverage and refrozen melt ponds as seen on

182 Figure 11: geocamera image from Mapsever The above maps were added to the ships on board map server making them available to all users on the science network. 182

183 Figure 12: Some maps produced from the geocamera were included as a layer in the ship's onboard mapserver. 183
184 Figure 13: A geocamera map from as a layer in the mapserver. Obstacles and challenges The geocamera is still far from being a turn-key product. Following are some of the issues that kept me busy during the cruise. Positioning and orientation It is important to know the position and especially the orientation of the camera relative to the ship's reference plane. At a height of about 30 meters and desired ranges exceeding 1000 meters, the angle formed between nadir and the far pixels exceeded 89 degrees. At such angles, a very slight change in angle can displace a pixel by hundreds of meters. The initial position and orientation of the camera was estimated using ship's drawing. Many days were then spent trying to get the camera to survey itself to a better approximation by measuring the pan and tilt angles necessary to get the camera to point at certain points on the ship with know positions. The goal was to achieve a good enough approximation to allow for automated processing of the data without the need for manual intervention to tweak the results to account for such positioning errors. The discovery on that the pan and tilt values were seemingly drifting out of calibration prompted me to change my approach to a manual mode of data processing so that tweaking of orientation values could be used to compensate for pan and tilt drift. Icing Despite having a heater and being rated to operate down to -40 degrees Celsius, icing was occasionally an issue. Internal temperatures were monitored and various combination of manually controlling the heater and fans were tried in attempts to minimize ice buildup. Although obtaining full ice imagery coverage during the cruise wasn't a primary objective, several trips were made up to the camera to manual clear the ice. 184

185 It was noted that the fixed AloftCon camera, which was mounted inside the AloftCon, suffered much less from such visibility issues. Figure 14: The camera's onboard heater was not always capable of preventing ice from collecting on the dome. Vibrations Significant vibrations were transmitted throughout the ship while braking ice. Those vibrations seemed to have been part of the pan/tilt calibration drift issues. Much more significant pan and tilt problems were observed on and upon inspecting the camera in person, grinding noises were heard as the lens was being moved. The camera was immediately decommissioned for the remainder of the cruise, and a fastener was found to have fully worked its way out when the camera was later dismantled. The fastener has been replaced and others who had started to come out have been tightened, but the camera has yet to be tested in order to assess if any permanent damage has occurred. 185

186 Figure 15: Loose screw. Processing performance About 1 Terrabyte of video and image data was collected during this cruise. This significant amount of data poses numerous challenges to developing a pleasant and efficient processing environment. OpenGL hardware acceleration, including the writing of custom shaders that run directly on the graphics hardware helped improve performance, but much more can be done to streamline the workflow. There simply was not enough time during the cruise to engineer a proper solution, so just enough software engineering was done to make the processing efficient enough to prove the concept within the timeframe of the cruise. geocamera 2.5 Video and images were concurrently collected from an Axis P1347 network camera, a fixed high resolution camera mounted inside the AloftCon. The processing pipeline was designed to also accommodate that data and during the final days of the cruise, a preliminary test map has been produced. 186

187 Figure 16: An initial attempt at creating a map from a fixed wide-angle camera inside AloftCon shows some remaining calibration problems. Due to its wider field of view, the lens produces more distortion that needs to be accounted for with proper calibration parameters. Multiple calibration datasets have been collected by recoding a chessboard pattern placed in multiple locations and orientations in the camera's field of view. The various lighting conditions present while collecting the different datasets did seem to have an adverse effect on the calibration procedure. We did not have the luxury of calibrating the AloftCon camera in a controlled indoor environment as was done with the geocamera V2.0. Future Considerations Having multiple indoor fixed cameras instead of a single outdoor camera capable of pan, tilt and zoom would most likely simplify the system. The higher resolution of the fixed cameras would partially compensate for the lack of zooming, but potential range would most likely decrease. Calibration of a camera with a fixed zoom would be simpler as opposed to calibrating a camera at multiple zoom levels. The simpler calibration would slightly be offset by the need for more precise calibration due to the wider angle lens of the fixed camera. The indoor cameras would also benefit from much less visibility issues due to icing. 187

188 Figure 17: Image from the fixed AloftCon camera. The wider field of view does come with a price of larger lens distortions. 188
189 APPENDIX D - OCEAN ACIDIFICATION REPORT Cruise Report: HLY1102 USGS research on ocean acidification Submitted by Lisa L. Robbins, USGS Participants: Dr. Lisa L. Robbins, USGS St. Petersburg, FL PI- Ocean Acidification Project, Paul O. Knorr, USGS, Brian Buczkowski, USGS Woods Hole, MA, and Dr. Jonathan Wynn, University of South Florida Background on Ocean Acidification: The ocean has absorbed approximately one-third of the total carbon dioxide (CO 2 ) emissions from fossil fuel combustion, cement production, and land use change during the past 200 yrs (Sabine and others., 2004). While this uptake may have moderated the rate of climate change, the uptake of CO 2 has also caused unprecedented changes to ocean chemistry, decreasing ph of the water and leading to a suite of chemical changes collectively known as ocean acidification. As another aspect of climate change, ocean acidification is an emerging global problem that will intensify with continued CO 2 emissions and will likely significantly impact marine ecosystems. The average ph of ocean surface waters has decreased by about 0.1 unit from about 8.2 to 8.1 since the beginning of the industrial revolution, with model projections showing an additional decrease of by the end of the century, even under optimistic scenarios (Caldeira and Wickett, 2005; NRC report, 2010). This change exceeds any known change in ocean chemistry for at least 800,000 years (Ridgewell and Zeebe, 2005). While ocean chemistry and the changes caused by increasing atmospheric CO 2 are well understood and can be precisely calculated, the direct biological effects of ocean acidification are less certain and will vary among organisms, with some adapting well and others not at all (ie., so called winners and losers). Within the next 100 years, it is likely that society will see significant changes in marine ecosystems and their services, based on the long term effects of ocean acidification (Raven and others, 2005). Arctic Science The Arctic Ocean covers an area of 14,056,000 km 2, has a fairly constant temperature near 0 C, and has some of the most and least productive areas in the world. Its cold waters absorb more carbon dioxide than warmer seawater. Meanwhile increasing mean annual temperatures in the region (1.8 degrees Fahrenheit over the past 150 years) has increased melting of Arctic ice. Up until recently, the perennial ice cover has prohibited significant equilibration with the post-industrial atmosphere, creating a polar mixed layer that is under saturated with respect to atmospheric CO2. Over the last three decades, retreat of summertime sea ice cover has increasingly exposed shelf and slope waters to the atmosphere and has allowed additional absorption of atmospheric CO2. The combination of these processes accelerates the rate at which ph and carbonate mineral saturation state decrease. Models have projected that the Arctic Ocean will become undersaturated with respect to carbonate minerals in the next 189
190 decade. However, some recent field results indicate that parts of the Arctic Ocean may already be undersaturated in the late summer months when ice melt is at its largest extent. The uncertainty of the models is based on lack of data. The USGS Ocean Acidification Team initiated establishing baselines to gauge future change as a response to the recognition by Department of Interior of this vulnerable ecosystem (Robbins and others, 2010a). Sampling water Cruise Details During the 6-week (August 15-September 27, 2011) UNCLOS (United Nations Convention Law of the Sea) cruise on the US Coast Guard Cutter Healy (Co-Chief Scientists: Larry Mayer and Andrew Armstrong), discrete and continuous underway water samples were collected and when possible, analyzed, to document the carbonate chemistry of the Arctic waters. These data are being used to test the waters saturation state with respect to calcium carbonate. These data are critical to refine existing models which fail because of lack of baseline data. Discrete water samples Discrete water samples were collected while underway following protocols outlined in Dickson and others (2007). Surface water samples were collected for measurement of ph, carbonate ion concentration, total alkalinity/total carbon, nutrients (NH 4, Silica, PO 4, and NO 2 +N), stable carbon and oxygen isotopic composition, elemental analysis, Dissolved organic carbon (DOC) and particulate organic carbon (POC). Water samples were removed from the sampling port of the vessel's flowthrough seawater system in the main laboratory (Figure 1). More than 515 ph and 350 [CO 3 2- ] discrete samples were measured underway. Table 1 lists the discrete samples that were collected aboard the Healy and that were either analyzed or were stored for analyses back onshore. These include: ph, CO 3-2, nutrients, O isotope, C isotope, metals, DOC, POC, DIC/Alkalinity, Generally, when the ship was traveling at 2-4 knots, ph and CO 3-2 samples were collected every two hours and analyzed. The rest of the samples were taken every 6 hours. When the ship traveled faster (~12kn), ph and carbonate samples were taken every hour and the rest of the suite of samples were taken every 4 hours. Particulate organic carbon samples were collected twice daily. Shipboard ph and [CO 3 2-] Analyses Approximately 30 ml of seawater were collected directly into cylindrical optical glass cells for ph T measurements on the total hydrogen ion scale, and into quartz glass cuvettes for [CO 3 2- ] measurements following the procedure of SOP6b (Dickson and others, 2007) (Figure 1). Cuvettes for both ph and [CO 3 2- ] were then placed into an aluminum cell warmer attached to a water bath at 25 C for approximately minutes. Shipboard ph measurements were performed using an Agilent 8453 spectrophotometer, purified metacresol purple indicator dye, and equations modified by Liu and Byrne (in press). Measurement of carbonate ion concentration was performed using an Agilent 8453 spectrophotometer, and methods of Byrne and Yao (2008). Figure 2 shows set up of both spectrophotometers. Figure 3 shows location of all ph and CO 3-2 samples that were measured. 190
191 Underway Continuous Measurements Approximately 9,000 continuous measurements of ph, pco 2, and TCO 2 were performed between August 23, 2010 to September 28, 2011 using a flow-through Multiparameter Inorganic Carbon Analyzer (MICA) (Figure 4) and Seabird SBE49 CTD attached to the flow-through system of the USCGC Healy. Geographic, salinity, temperature, and fluorometric data were also collected using a shipboard Ashtech ADU5 GPS system, a SeaBird SBE45 Thermosalinograph, and a Seapoint SCF Fluorometer. A complete description of these can be found in the main section of this report. The intake of the shipboard flow-through system was located approximately 8 m below the sea surface on the port side of the vessel. Water entered the sampling baffles at depth, was pumped to a sea chest for separation of ice, and was then pumped to a multi-port sampling manifold located in the ship's main laboratory. Seawater was then fed to a custom made PVC de-bubbler containing a Seabird SBE49, prior to being transported to the intake port of the MICA. Measurements were taken and logged approximately every 7 minute except for during a MICA flushing cycle that occurred for approximately 10 minutes each hour. The MICA was calibrated using Certified Reference Material from Professor Andrew Dickson of the University of California at San Diego. Precision and accuracy for each channel for ph, 2 ppm pco 2, and 2 μmol/kg for TCO 2. Early during the cruise, problems with the equipment did not permit its full functioning until after August 23. The Autonomous Flow-through (AFT) System was also used to collect ph and pco 2 (seawater data). However, issues with data drift and periodic equipment failure, probably due to the extremely cold water, made running this machine impractical for the entire cruise. These two pieces of equipment were shut down at the end of August. pco 2 air Monitoring A Picarro CO 2 Isotopic Analyzer was set up on the main deck, in the bow. The intake tube for the analyzer was attached to the flagstaff on forecastle, approximately 3 meters from the deck, and was fed through a standpipe on the deck down into the main deck. The analyzer recorded air pco 2 and carbon isotopic composition of the pco 2 every two seconds. These data will be averaged/condensed down to match the recorded times of the MICA, and provide a baseline of atmospheric CO 2 concentration. Figure 5 shows the set-up of the Picarro in the bow of the Healy. CTD Stations Discrete Vertical Profile Samples Discrete samples from vertical profile (CTD Stations) casts were collected at 8 locations (see map in Main Report). For all of these casts, a 24-bottle Niskin rosette (12 L bottle volume) with an electronic trigger was fitted with a Seabird SBE 911plus CTD and altimeter. The CTD provided salinity, temperature, depth, fluorescence, and dissolved oxygen data. The rosette was lowered to determined depth and bottles were tripped at select depths as the rosette was brought to the surface. Water samples were collected from the Niskin bottles for the full suite of discrete analyses and included ph, CO 3-2, δ 18 O isotope, δ 13 C isotope, nutrients, metals (ie., alkalis and alkaline earths), total dissolved inorganic carbon/alkalinity. In addition, waters from specific bottles were collected and filtered for identification of microbial components. Both of these analyses will be performed back in St. Petersburg, FL. Samples for microbiological analyses were collected from bottles retrieved at certain depths, filtered through 5.0um and 1.0um Pall cartridge filters and a 0.22um Sterivex filter, and stored at -20C. These were designated as Micro1. Also, at specific locations and depths, 125ml water 191
192 samples were taken, fixed with Lugols and stored in dark bottles at 4 C. See appendix for list of samples taken at each station. These samples are designated as Micro2. The deepest CTD was to 3200m. Note: CTD Station 1 had a saving/naming error and therefore was also labeled as station 2. The other stations, 3-9 were located at single stations. Ice samples Nilas ice samples were collected at three localities (Station 5, 6 and 8), cuttings from hand core taken during ice liberty and, 2- ~1- meter cores were collected at, N, W with the help of Alice Orlich. These samples were prepared in the Healy refrigerator for further analysis back in Tampa/St. Petersburg, FL. Ossicle Experiment Additionally, a small experiment utilizing ophioroid ossicles was performed during the trip in which individually weighed ossicles were bathed in continuous flow Arctic seawater. The date and time the ossicles were put into the Arctic water, was recorded. The integrated time and saturation state of the waters will be calculated using data collected aboard the Healy. The ossicles will be weighed and analyzed at Vanderbilt University. Data Analyses On board, discrete data and MICA data were merged with ship s sensor data to provide cross validating of data using CO2calc (Robbins and others, 2010) analyses. Disclaimer Reference herein to any specific commercial product, process, or service by trade name, trademark, manufacturer, or otherwise does not constitute or imply its endorsement, recommendation, or favoring by the United States Government or any agency thereof. References Cited Dickson, A.G., Sabine, C.L., and Christian, J.R., editors Guide to Best Practices for Ocean CO2 Measurements. PICES Special Publication 3, 191 pp. Byrne, R.H. and Yao, W.S., 2008, Procedures for measurement of carbonate ion concentrations in seawater by direct spectrophotometric observations of Pb(II) complexation. Mar Chem 112: Caldeira, K.; Wickett, M.E., 2003, "Anthropogenic carbon and ocean ph". Nature 425 (6956): doi: /425365a. PMID bon%20and%20ocean%20ph.pdf. National Research Council (NRC), 2010a, Ocean Acidification: A National Strategy to Meet the Challenges of a Changing Ocean. Committee on the Development of an Integrated Strategy for Ocean Acidification Monitoring, Research and Impacts Assessment, National Academies Press, Washington, DC. 192
193 Raven, J. A. and others, 2005, Ocean acidification due to increasing atmospheric carbon dioxide. Royal Society, London, UK. Ridgwell, A., and Zeebe, R. E., 2005, The role of the global carbonate cycle in the regulation and evolution of the Earth system. Earth Planet. Sci. Lett., 234, Robbins, L.L., Yates, K., Feely, R., and Fabry, V., 2010a, Monitoring and assessment of Ocean Acidification in the Arctic Ocean: Scoping Paper for Arctic Mapping and Assessment Program, Open-File Report , 9p. Robbins, L.L., Hansen, M., Kleypas, J.A., and Meylan, S.C., 2010b, CO2calc Application for desktop and iphone, Florida Shelf Ecosystems Response to Climate Change Project Ocean Acidification Task: U.S. Geological Survey Open File Report , 17p. Sabine, C.L., Feely, R.A., Gruber, N., Key, R.M., Lee, K., Bullister, J.L., Wanninkhof, R., Wong, C.S., Wallace, D.W.R., Tilbrook, B., Millero, F.J., Peng, T.-H., Kozyr, A., Ono, T., Rios, A.F., 2004, The oceanic sink for anthropogenic CO2. Science 305: Yamamoto-Kawai, Michiyo., McLaughlin, F.A., Carmack, E.C., Nishino, Shigeto. and Shimada, Koji., 2009, Aragonite undersaturation in the Arctic Ocean: Effects of ocean acidification and sea ice melt: Science, v. 326, no. 1098, p

194 Figures: Figure 1. Discrete water sampling for ph and CO

195 Figure 2. ph and CO 3-2 Spectrophotometers 195


196 Figure 3. Location of all ph and CO 3-2 samples during HLY1102 cruise. Figure 4. Multiparameter Inorganic Carbon Analyzer (MICA). 196

197 Figure 5. CO 2 Isotopic Analyzer set-up in the bow of the Healy. 197
198 Appendix: Samples collected at Stations Station 1 / 2: Samples retrieved N W Depth (m) ph CO3 Del18O D13C Nutrients DOC Mj ions metals Surface X X X X X X X 7 X X X X X X X 12 X X X X X X X 24 X X X X X X X 36 X X X X X X X 40 X X X X X X X 50 X X X X X X X 75 X X X X X X X 85 X X X X X X X 100 X X X X X X X 125 X X X X X X X 160 X X X X X X X 190 X X X X X X X 260 X X X X X X X 330 X X X X X X X 650 X X X X X X X 1000 X X X X X X X 1500 X X X X X X X 2000 X X X X X X X 2500 X X X X X X X 3171 X X X X X X X Station 3: Samples retrieved on N W Depth ph CO3 Del18O D13C Nutrients DOC Mj ions metals Micro1 Micro2 Surface X X X X X X X 8 X X X X X X X X X 25 X X X X X X X X 50 X X X X X X X 70 X X X X X X X X X 80 X X X X X X X X 150 X X X X X X X 200 X X X X X X X 240 X X X X X X X 350 X X X X X X X 500 X X X X X X X Station 4: Samples retrieved N W Depth (m) ph CO3 Del18O D13C Nutrients DOC Mj ions metals Micro1 Micro2 198
199 Surface X X X X X X X X X 10 X X X X X X X X X 20 X X X X X X X X X 50 X X X X X X X 75 X X X X X X X X 100 X X X X X X X 150 X X X X X X X 200 X X X X X X X 300 X X X X X X X 400 X X X X X X X 500 X X X X X X X X 650 X X X X X X X 1000 X X X X X X X 1500 X X X X X X X 2500 X X X X X X X 3350 X X X X X X X Station 5: Samples retrieved N W Depth (m) ph CO3 Del18O D13C nutrients DOC Mj ions metals Micro1 Micro2 Surface X X X X X X X X X 10 X X X X X X X 20 X X X X X X X 35 X X X X X X X 70 X X X X X X X 100 X X X X X X X 150 X X X X X X X 200 X X X X X X X 250 X X X X X X X 300 X X X X X X X X X 350 X X X X X X X 850 X X X X X X X 900 X X X X X X X 1800 X X X X X X X 2150 X X X X X X X X X 2860 X X X X X X X Station 6: Samples retrieved N W Depth (m) ph CO3 Del18O D13C nutrients DOC Mj ions metals Micro1 Micro2 Surface X X X X X X X X X 8 X X X X X X X 20 X X X X X X X 28.7 X X X X X X X 65 X X X X X X X 85 X X X X X X X 150 X X X X X X X 199
200 250 X X X X X X X 300 X X X X X X X X X 400 X X X X X X X 600 X X X X X X X 1000 X X X X X X X 1800 X X X X X X X 2250 X X X X X X X X X 3000 X X X X X X X Station 7: Samples retrieved N W Depth (m) ph CO3 Del18O D13C nutrients DOC Mj ions metals Micro1 Micro2 Surface X X X X X X X X X 8 X X X X X X X X 19.9 X X X X X X X X X 28.7 X X X X X X X 53.6 X X X X X X X 75 X X X X X X X 100 X X X X X X X 150 X X X X X X X 199 X X X X X X X 300 X X X X X X X 425 X X X X X X X 500 X X X X X X X 650 X X X X X X X 1000 X X X X X X X 3000 X X X X X X X X Station 8: Samples retrieved N W Depth (m) ph CO3 Del18O D13C nutrients DOC Mj ions metals Micro1 Micro2 Surface X X X X X X X X X 7.88 X X X X X X X X X 23.4 X X X X X X X X X 50 X X X X X X X 75.5 X X X X X X X 100 X X X X X X X 150 X X X X X X X 180 X X X X X X X 325 X X X X X X X 500 X X X X X X X 1000 X X X X X X X 1500 X X X X X X X 2499 X X X X X X X 3060 X X X X X X X 200
201 Station 9: Samples retrieved N W Depth (m) ph CO3 Del18O D13C nutrients DOC Mj ions metals Micro1 Micro2 Surface X X X X X X X X X 8 X X X X X X X X X 20 X X X X X X X X X 31.9 X X X X X X X 52 X X X X X X X 65 X X X X X X X 100 X X X X X X X 200 X X X X X X X 229 X X X X X X X 350 X X X X X X X 500 X X X X X X X X X 201


202 APPENDIX E - UAS Post Deployment Report Post Deployment Report USCGC HEALY/CCGC LOUIS S ST LAURENT August 15-September 28, 2011 Capt Stephen Wackowski A2/A2Q ISR Innovations National Defense Intelligence College MSSI Candidate Stephen.Wackowski@pentagon.af.mil DSN: COM:
203 Executive Summary From August 15 th to September 28, 2011 I deployed on the USCGC HEALY during the 2 nd leg of her summer 2011 Arctic deployment (HLY 1102). I embarked from Barrow, AK as a member of the science party led by Dr. Larry Mayer of the University of New Hampshire Center for Coastal and Ocean Mapping / Joint Hydrographic Center (UNH-CCOM/JHC).The mission was funded by the National Ocean and Atmospheric Administration (NOAA) and the National Science Foundation to continue the joint U.S.-Canadian Extended Continental Shelf (ECS) mapping effort. Joint Icebreaking/mapping operations were performed with the CCGS LOUIS S. ST. LAURENT (LOUIS). HEALY collected multibeam sonar while LOUIS deployed seismic air cannons to map the seafloor sediments. Both mapping systems are critical to present claims as designated by the United Nations Convention on the Law of the Sea (UNCLOS). Preparing bathymetric and seafloor sediment maps for UNCLOS submission was the primary objective of the mission. My research on Arctic Unmanned Aerial Systems (UAS) operations for the Defense Intelligence Agency s National Intelligence University (NIU) and the U.S. Air Force was conducted as a secondary science mission. The proposal was simple: To prove that Small Unmanned Aerial Systems (SUAS) operations were possible from moving icebreakers and the products derived from those flights would contribute to the mission by assisting in icebreaking operations, marine mammal detection, and search and rescue. Due to U.S. Coast Guard flight deck certification concerns regarding SUAS operations onboard the HEALY, I transferred to the LOUIS while underway. With the support of Canadian Chief Scientist Dave Mosher and LOUIS Commanding Officer, Capt Marc Rothwell, I received authorization to conduct a demonstration flight. On August 26 th, with myself as Pilot-in-Command and Flight Engineer Steve Lloyd (Tansport Canada) as mission commander, we conducted the first SUAS flight ever performed in the high Arctic from a moving icebreaker. RQ-11A RAVEN, serial number 0613 flew for nearly 30 minutes for a distance of 4.7km from its origination point on from the LOUIS. It was launched from the roof of the her bridge and recovered on the helicopter landing pad. A RAVEN remote video terminal was left onboard the HEALY and the RAVEN s full motion video (FMV) feed was viewed live on her bridge. Flight Engineer Lloyd served as the RAVEN mission commander for the remainder of the deployment. Over the coming weeks we conducted a series of successful day and night flights using both Electro-optical and Infrared cameras, both from the ship and on the sea ice. Through these flights, the benefit of on-demand, airborne FMV for intelligence, surveillance, reconnaissance (ISR) purposes was demonstrated for both crew of the LOUIS and HEALY. After the initial demonstration of the system s capabilites, it began to receive taskings from the CO/XO of the LOUIS. These culminated with requests for an ice reconnaissance mission to scout for a launch point for an autonomous underwater vehicle (AUV) and polar bear watch for a deployed ice buoy team. A dozen successful flights were logged while deployed with the LOUIS suffering only one total loss of an air vehicle (AV). Mission Genesis In May 2011, my NIU thesis topic was approved, National Security Impacts of Ice Free Arctic Summers, with Dr. Peter Leitner, NIU Faculty, as thesis chair and U.S. Senator Lisa Murkowski as reviewer. At the recommendation of Dr. John Farrell, Executive Director of the US Arctic Research 203

204 Commission, I pursued the opportunity to deploy on one of the USCGC HEALY s summer arctic icebreaking missions. Participating in a cruise would offer me the opportunity to interact with arctic scientists and directly participate in the Coast Guard s Arctic Icebreaking mission for my thesis research. Upon further investigation of the Coast Guard s ISR capabilities in the Arctic, a major shortfall in the ship s ability to collect operational airborne reconnaissance is revealed. In fact, the HEALY has no capability to conduct air operations because it does not deploy with a helicopter detachment, which is largely due to budget and manning constraints. With this shortfall in mind, my Commander, Mr. James Clark, Director, A2/A2Q ISR Innovations, supported my proposal to deploy with a SUAS system to demonstrate the Air Force s capability to collect ISR from SUAS platforms. This would also give the Air Force valuable data on the effectiveness of SUAS in the high arctic and the challenges faced in conducting UAS operations in extremely high latitudes. After drafting a proposal for SUAS operations in the Arctic, Dr. Farrell then introduced me to his colleague Dr. Mayer, the Chief Scientist for HLY Dr. Mayer enthusiastically supported my proposal and offered me a position on his science crew. Both Dr. Mayer and myself began to engage the Coast Guard on obtaining the proper authorization for UAS flights on the HEALY. RAVEN Launch from Arctic buoy A2Q and Air Force Special Operations Command had several battle tested and proven RQ-11A RAVEN s in their inventory slated for retirement and static display. Many of the systems had not been flown since 2004 when they primarily flew in Iraq and Afghanistan, but were still operable. With assistance of the SUAS Program Office at AFSOC, I was provided with extra equipment for the deployment. Additionally, AFSOC also sought a Federal Aviation Administration (FAA) Certificate of Airworthiness (COA) on my behalf for Arctic RAVEN flights encompassing the U.S.-controlled airspace north of Barrow all the way to the North Pole. Two weeks before my scheduled deployment the COA was approved the largest SUAS COA in history. While my participation in the HEALY s ECS mission for thesis research was approved, the proposal to fly RAVENs from the HEALY was still under consideration by Coast Guard Headquarters. On the recommendation of my leadership and SUAS advocates in the Department of Homeland Security, I proceeded to deploy on the HEALY with the necessary equipment to conduct RAVEN flights. Unfortunately, due to flight deck certification issues, permission to conduct ship-borne flights from the HEALY was denied. Immediately, Dr. Mayer engaged the leadership of the LOUIS on my behalf. After a brief static demonstration, the LOUIS s Commanding Officer and Chief Scientist gave me permission to conduct a test flight on the Canadian vessel. After reviewing the operating frequencies of the RQ-11A, the LOUIS Communications Officer determined the system posed little to no threat of interference with the ships system. Advantageously, the LOUIS had two flight officers on that were able to assist in SUAS operations. After the first successful flight demonstration, which resulted in the safe launch and recovery of the system, I was given permission to conduct flight operations for the remainder of the mission. 204
205 Deployment Goals Demonstrate that SUAS operations can be done SAFELY on/off board Icebreakers while underway - Complete Demonstrate Intelligence, Surveillance, and Reconnaissance (ISR) capabilities of SUAS to multi-agency science crew and Coast Guard Complete Stream Full Motion Video from RAVEN SUAS on to ROVER for o Sea ice ridge detection/monitoring -Complete o Marine mammal detection Incomplete/pending: No marine mammals seen or observed during cruise during flight ops; only one polar bear and two seals observed in beginning of cruise o Demonstrate usefulness in search and rescue scenarios - Complete o Detection and monitoring of oil spilled from ship or oil exploration Inconclusive: no way to test this scenario while underway Integrate lessons learned/ops concept into NDIC thesis research for Masters of Science in Strategic Intelligence - pending Alignment to National Strategy My research mission supported national strategic guidance as set forth in National Security Policy Directive 66, Arctic Region Policy, which originated with the Bush Administration and has not been countermanded by the current administration. Policy as it relates to promoting scientific international cooperation o Continue to play a leadership role in research throughout the Arctic region o Strengthen partnerships with academic and research institutions and build upon the relationships these institutions have with their counterparts in other nations Policy as it relates to national security and homeland security interests in the Arctic o Increase Arctic maritime domain awareness in order to protect maritime commerce, critical infrastructure, and key resources o Project a sovereign United States maritime presence in the Arctic in support of essential United States interests 205
 Cruise Speed 30mph Status A model retired from active military service.")
206 SUAS Airframe RQ-11A RAVEN Manufacturer AeroVironment Inc Launch Method Hand-launched Recovery Method Deep-stall landing Camera Payloads Color/Thermal Wingspan 4ft 3in Length 3ft (0.9m) Weight 4.2lb (1.9kg) Cruise Speed 30mph Status A model retired from active military service. B and DDL in active service RQ-11A seconds before first high Arctic flight RAVEN A model was selected as preferred airframe for Arctic Icebreaker flights due to several factors. Airframes had fulfilled lifecycle requirements and are retired from active service o Several RAVENs in A2Q, Air Force Research Laboratory, and AFSOC inventories were destined for scrap or display o Vast majority of airframes were repairable to 100% operational status o While loss/catastrophic damage to airframe was not preferred, it would not end the mission should an airframe be unrecoverable Systems operate on unencrypted analog frequencies Systems carry no classified equipment System is man-portable and requires only one trained pilot and an untrained assistant to operate 206

207 Raven capture by Canadian Coast Guard Cadet (flight 4) Flights Twelve flights were logged during deployment o One flight resulted in the loss of an air vehicle Nine of the flights originated from the LOUIS, the others were during dismounted operations from the ship. Nearly 10 hours of flight time was logged on 6 airframes In lower latitudes (south of 80 N) three night flights were conducted from the ship using the Infrared nose cameras. Selected highlights: Flight 1 Date: 26 August 2011 Duration: 27 minutes Launch: LOUIS antenna deck Recover: LOUIS Helicopter pad Camera: DAY/EO Notes: Initial safety demonstration for LOUIS CO/XO. Continued flight ops approved. 207

 HEALY on IR Camera (black hot) Flight 5 Date: 3 September 2011 Duration: 40 minutes")
 Autonomous Underwater Vehicle (AUV).")
208 View of the HEALY from RAVEN flight RAVEN flight 1 on final approach Flight 2 Date: 27 August 2011 Duration: 50 minutes Launch: LOUIS antenna deck Recover: LOUIS Helicopter pad Camera: Side look IR Notes: Cold weather test for battery performance no effects at 34 F. IR test in day conditions. LOUIS on IR Camera (white hot) HEALY on IR Camera (black hot) Flight 5 Date: 3 September 2011 Duration: 40 minutes Launch: LOUIS Helicopter pad Recover: LOUIS Helicopter pad Camera: Day/EO Notes: Launch of Defence Research and Redevelopment Canada s (DRDC) Autonomous Underwater Vehicle (AUV). RAVEN launched to monitor launch and assist in SAR if needed. Due to wind conditions landing approach was from LOUIS port bow direction. 208


 Note: Performed Ice reconnaissance in light snow.")

209 AUV awaiting launch Bow-directed landing approach Flight 7 Date: 5 September 2011 Duration: 49 minutes Launch: Ice buoy camp Recover: Ice buoy camp - snow Camera: Day/EO Note: Performed Polar Bear safety patrol. AV flew through freezing fog layer and front camera was iced over. Buoy camp aerial screen capture Forward looking camera gathering frost Flight 9 Date: 14 September 2011 Duration: 18 minutes Launch: LOUIS helicopter deck Recover: In flight loss Camera: Forward looking IR (Night/near total darkness) Note: Performed Ice reconnaissance in light snow. Back stab experienced failure mid-flight. Ice imagery with IR camera is excellent in night conditions. Flight occurred about 120 nm from magnetic north pole, magnetic compass did not deviate more than 10 degrees in level flight. 209

.")
 over navigation track (green) National Ice Center RADARSAT SAR Image overlayed For more efficient operations, ice")
210 Ice ridges 2km ahead of LOUIS (white Screen capture during flight failure Research Conducted/Mission Results Both ship s crews and science parties had a very positive reaction to the capability demonstrated by the flights. Of particular interest was the ability of the system to scout ahead of the ship for pressure ridges, cracks, and open areas in the ice. Icebreaking consumes extreme amounts of fuel, especially in hardened multi-year ice. The Chief Engineers from both vessels estimate consumption rates of 13,000-30,000 gallons of fuel a day during icebreaking operations (open water consumption averages 3,000 gallons a day). Much effort goes into finding the path of least resistance in the ice, as following lighter ice conditions means faster transit, and saving tens of thousands of dollars in fuel per day. Screen capture from HEALY mapserver, showing icebreaking path (red) over navigation track (green) National Ice Center RADARSAT SAR Image overlayed For more efficient operations, ice reconnaissance flights occur from the LOUIS and remote sensing data was used from the Canadian RADARSAT satellite constellation to chart ice conditions. Both 210

211 methods prove effective in many areas of mission planning, however, there were several capability gaps that have the potential to be filled by SUAS operations The HEALY is dependent on the LOUIS for underway air transportation and airborne ice reconnaissance. The LOUIS deployed with one ME-208 light mulit-purpose helicopter onboard with one pilot and flight engineer to man the airframe. Helicopter operations in the arctic is an expensive affair, with cost estimates from $1000-$2000 per hour of flight time. Ice reconnaissance is only one of several missions the helicopter has while underway; buoy deployments, gravimetric readings, and shipto-ship personnel transfers are included in its responsibilities. This limits time and resources available for scouting ice conditions. Furthermore, during periods of darkness manned ice reconnaissance is not feasible as neither ship is outfitted with a FLIR system. In this scenario, the RAVEN proved most useful. The IR cameras of the system worked very well in little-to-no light conditions. Pressure ridges in the ice showed up wonderfully at night. On September 2, LOUIS XO tasked us to Louis in Icebreaking lead, pressure ridges visible investigate whether current ice conditions allowed for open pools of water required for DRDC s AUV launch. If pools were found, we were to report location and disposition to the bridge. This offered an opportunity to display the utility and flexibility of the system. Within 30 minutes of tasking, a flight was in the air and after 45 minutes in the reconnaissance pattern an open pool of water was found that was deemed sufficient size for the AUV launch. We employed a standard search and rescue to find the pool. 211


212 Mission plan for Ice-free pond reconnaissance flight (screen capture of pond overlayed) The National Ice Center (NIC), a joint NOAA, USCG, and USN organization in Washington, DC deployed members on the HEALY and LOUIS as part of a sea ice science team. The team, led by the NIC Chief Scientist, Dr. Pablo Clemente-Colón, employed several innovative approaches to relay remote sensing data and provide icebreaking support imagery products onto the ships mission planning systems. Most of NIC s products are derived from RADARSAT-2, a Canadian-owned commercial satellite. The RADARSAT-2 orbits routinely cover the Arctic and offers valuable remote sensing data for icebreaking operations. The synthetic aperture radar (SAR) images acquired by the system are extremely valuable tools for wide area ice reconnaissance; however, spatial resolution of the images is limited to 100 meters. Also, above 78-80N, IP communications is limited to a 9600 baud iridium link. Even with these bandwidth limitations many imagery products are processed, uploaded, and integrated into the ships map servers within hours of the satellite pass. Again, the US has no national assets air or space that provide on-demand ice data for polar operations. While RADARSAT is a valuable tool, the US Government pays $5,000 on average for a 40km x 40km swath segment. Also, imagery taskings compete with other customers. Furthermore, the ice is constantly changing and on the move. During the RAVEN flights from the buoy camp, the ice moved 1.9 miles in less than 4 hours. UAS flights demonstrated an extremely valuable, cost effective method to validate remote sensing data. Challenges Environment The cold temperatures inherent to the Arctic did not seem to degrade the flight performance or endurance of the system. However, wind conditions are extremely unpredictable as there is very little weather data collected in the high Arctic for weather forecast models. In many cases, bad weather just 212
213 seems to appear out of nowhere. At least 50% of the cruise saw wind speeds above 15 knots. (20 knot winds are the recommended limitation of the system). Icing was also a concern, several days in late August early September see average temperatures hover around 32 F. Cloud and ice-fog layers were present almost every day of the cruise. Navigation An unexpected problem arose during high Arctic flights. The military coordinate grid system (MGRS) ends at 84N, at which point the polar grid coordinate system-north (PCS-N) takes place. Falconview, the military mapping program that can input automated navigation points into the RQ-11 before and during flight does not contain PCS-N therefore rendering the system useless for the RQ- 11A s above 84N. In conversations with the system designers and programmers, this issue has been resolved in newer systems. More important, the RQ-11A s magnetic compass is rendered useless within 200 miles of the magnetic north pole. The RAVEN autonav system uses a combination of GPS guidance and magnetic compass to navigate to waypoints, including its HOME. In many cases, the AV would not navigate to its way point unless the compass reading was within 20 degrees of magnetic north. Manual navigation required constant attention to a handheld GPS system to derive the AV s location. During two flights the AV was lost for up to five minutes at a time. Limiting Factors The system is largely at the mercy ofthe unpredictable weather in the high Arctic. According to the experienced arctic scientists onboard, HLY 1102 saw mostly good weather conditions during the deployment. Still, over half of the days underway we experienced winds over 15 knots. Ice fog impacted visibility and limited flight ops on at least four occasions. However, precipitation was not a large factor since most of it came in the form of snow. Icing also impacted one of the flights when the AV flew through cloud layers. No noticeable impact to the AV s flight characteristics was observed when ice accumulated on the propeller. The extreme cold and landing on a metal helicopter deck caused more battle damage than normal. The cold tended to make the plastic connectors brittle and more apt to break upon landing. Also, two tailbooms experienced cracking after landing. Field repairs were sufficient to keep the system running but another month s worth of flights would have probably exhausted spares. Endurance and range are also limiting factors for the system. Due to the manpower limitations and the simplicity/availability of systems, RAVEN A s were chosen as the platform for flights, but a UAS with longer endurance and greater range would be preferred. Recommendations The HEALY will be deploying for the 2012 Arctic season without the LOUIS. It is highly likely the ship will have no airborne reconnaissance capability next season. While the RAVEN s proved capable to assist in icebreaking operations and marine mammal patrols, a larger UAS with longer endurance, variable zoom/pan cameras, and a higher ceiling would be more effective for arctic operations. Scan Eagle, or a similar system, which is capable of being launched and recovered from the ship while underway would be a more preferable platform. Furthermore, deployment of a micro SAR or hyperspectral camera could prove very effective in verifying the satellite remote sensing data integrated into the HEALY s mission planning system. 213
 455-4210 Phone (907) 301-4008 Mobile Leann.Russell@uicumiaq.")
214 APPENDIX F - MARINE MAMMAL REPORT Marine Mammal Observer Observations US-Canada Extended Continental Shelf Survey August 15 September CH2M Hill Polar Services 2325 King Road Fairbanks, AK (907) Phone (907) Mobile Leann.Russell@uicumiaq.com Leanna Russell MARINE MAMMAL OBSERVER CH2M Hill Polar Services 214
215 Table of Contents CRUISE REPORT... 1 INTRODUCTION and BACKGROUND... 3 Previous Cruises: (Detailed cruise reports from each of these cruises can be found at or USGS websites) HEALY-1102 Overview SCIENTIFIC PARTY SCIENCE SYSTEMS REPORT Introduction Mapserver Configuration for HLY Other Ship Tracks: Default ship track Real-time Multibeam Terascan Receiver Performance (for NOAA satellites) DMSP Encryption Satellite orbit information Reachback (Iridium system) EM122: SIS projections: Real-time data access SIS background grids Generating sound speed profiles for SIS SIS dateline problem SIS gridding Helm display: Built In Self Tests: Noise Measurements Test conditions: Watchstander Workstation: Watchstanders: Equipment: Knudsen 320 subbottom profiler POS/MV-320s: High latitude performance: Alignment at high latitude Heading accuracy estimate: POS/MV #1 (SN 2306) POS/MV #2 (SN 3723) POSPaq logging Number of satellites used MRU CTD CTD performance Starboard Staging Door Wind Birds LDS Time stamping LDS Acquisition management
216 Data Distribution pco2 System Science Sea Water System (SSW) SSW Pressure Gauge in BioChem Lab SSW relief valve in BioChem Lab SSW Science Pressure Transducer SSW Latency Flow through sensors Reference Hydrophone Hull Temperature sensor ADCPs Gravity Meters Science AIS receiver Aloftconn, Aftconn and Main Lab web cameras Revision History of this document Introduction Mapserver Real-time Multibeam Terascan Reachback (Iridium system) EM122: Watchstander Workstation: Knudsen 320 subbottom profiler POS/MV-320s: MRU CTD Wind Birds LDS pco 2 System Science Sea Water System (SSW) Flow through sensors Reference Hydrophone Hull Temperature sensor ADCPs Gravity Meters Science AIS receiver Aloftconn, Aftconn and Main Lab web cameras REVISION HISTORY of this DOCUMENT CHIEF SCIENTIST LOG August 15, 2011: JD August 16, 2011: JD August 17, 2011: JD August 18, 2011 JD August 19, 2011 JD August 20, 2011 JD August 21, 2011 JD August 22, 2011 JD August 23, 2011 JD August 24, 2011 JD August 25, 2011 JD
217 August 26, 2011 JD August 27, 2011 JD August 28, 2011 JD August 29, 2011 JD August 30, 2011 JD September 1, 2011 JD September 2, 2011 JD September 3, 2011 JD September 4, 2011 JD September 5, 2011 JD September 6, 2011 JD September 7, 2011 JD September 8, 2011 JD September 9, 2011 JD September 10, 2011 JD September 11, 2011 JD September 12, 2011 JD September 13, 2011 JD September 14, 2011 JD September 15, 2011 JD September 16, 2011 JD September 17, 2011 JD September 18, 2011 JD September 19, 2011 JD September 20, 2011 JD September 21, 2011 JD September 22, 2011 JD September 23, 2011 JD September 24, 2011 JD September 25, 2011 JD September 26, 2011 JD September 27, 2011 JD September 28, 2011 JD HEALY XBT/CTD LOG CTD CTD CTD CTD CTD CTD CTD CTD XBT LOG APPENDIX A - USN METOC Report APPENDIX B - National Ice Center Report TEXT ACTION ITEMS APPENDIX C - GeoCamera Report Background geocamera V
218 Hardware Software Results Mapsever Obstacles and challenges Positioning and orientation Icing Vibrations Processing performance geocamera Future Considerations APPENDIX D - OCEAN ACIDIFICATION REPORT Background on Ocean Acidification: Arctic Science Cruise Details Sampling water Underway Continuous Measurements Data Analyses Disclaimer References Cited Figures: Appendix: Samples collected at Stations APPENDIX E - UAS Post Deployment Report Executive Summary Mission Genesis Deployment Goals Alignment to National Strategy SUAS Airframe RQ-11A RAVEN Flights Selected highlights: Research Conducted/Mission Results Challenges Environment Navigation Limiting Factors Recommendations APPENDIX F - MARINE MAMMAL REPORT Introduction Description of Daily Activities Responsibilities of the MMO Data Recording Effort Report Form Sighting Form Data Codes Summary Sightings August August August
219 24 August August August August September September September September September September Conclusion APPENDIX G - BIRD REPORT APPENDIX H - DESCRIPTION OF EM122, KNUDSEN and CTD Data Formats Kongsberg EM122 multibeam Raw Multibeam data Multibeam Center Beam Sound Speed at the keel Knudsen 320B/R Description: The Knudsen 320B/R depth sounder has two independent transceivers. One is tuned for and connected to an ODEC TC12/36 hull mounted transducer. The other is matched to an array of 16 tr-109 subbottom transducers. It is capable of simultaneously operating at 12 khz and as a subbottom profiler in either tone burst (3.5 khz) or "chirp" (3-6kHz) mode. The Healy routinely operates the 3-6kHz "chirp" (Sub Bottom Profile) mode except in special situation such as communicating with and, or ranging on acoustic releases or bottom tracking pingers. We do not operate the 12 khz sounder as it interferes with the multibeam. Historically, Knudsen data has been saved in all of the formats that the Knudsen can record data in. These files are ASCII, mixed ASCII/Binary and binary format (see the table below) Knudsen File Types Knudsen 320B PKEL Knudsen PKEL record SEABIRD SBE-9 CTD CTD File Types
220 Introduction The United States and Canada embarked on a joint venture aboard two ships from August 15 th through- September 28th of The USCGC Healy and the CCGS Louis S. St. Laurent (Louis) collected seismic and bathymetric data on the Extended Continental Shelf that lies offshore both countries. The collection of data focused on the areas beyond the 200 nautical mile Exclusive Economic Zone where utilizing two ice breaking vessels would allow for a successful cruise. The Healy was the lead vessel breaking ice while conducting multibeam and subprofile surveys. The Louis followed collecting seismic reflection and refraction data. During periods of light ice conditions the vessels were able to separate and double their data collection. Sounds produced during data collection, particularly by the seismic equipment, had the potential to disrupt the behavior of marine mammals within the area. Certain measures were taken including course alteration, allowance of an approximately one kilometer safety zone where marine mammals were observed, and seismic equipment shutdown where marine mammals were observed in proximity. Onboard the Healy was a marine mammal observer (MMOs) Leanna Russell (CH2M Hill), while the Louis housed three MMOs representing the Canadian Hunters and Trappers Community. The MMOs from both vessels were able to communicate in real time using VHF radio channel 6 to inform the other vessel when a marine mammal was detected. Hereinafter this report will document how operations were conducted by the MMOs including specific sightings, methods, format for reporting conditions, and vessel activities during and pertaining to marine mammal observations. A logbook and multiple data forms were completed daily to ensure the accuracy and integrity of the collected data for future reference, interpretation and analysis. Copies of complete data forms from MMOs aboard the Healy are included Appendex 1, 2 and 4. Also, a spreadsheet obtained from the chief scientist aboard the Healy portrays the dates and times of seismic operations onboard the Louis in Appendix 5. Description of Daily Activities The Healy MMO observed from the bridge of the vessel and was allowed unobstructed access to all areas and instruments required for data collection. All operations aboard the Healy were made during daylight hours. Systematic scans or sweeps with binoculars and naked eye were directed forward while the vessel was underway and in all directions during stationary periods. During transit to and from data collection sites, MMO monitored for marine mammals up to 12 hours within a 24 hour period. Healy MMO would monitor up to 12 hours a day for a maximum of 4 consecutive hours in a row to avoid fatigue. Monitoring aboard the Louis was underway 24 hours a day, each MMO observing 8 hour shifts. Healy observers were able to be contacted by phone or page during off-watch periods. Bridge personnel were willing to monitor for marine mammals during these periods and were supplied with forms to accompany any sightings while MMO was off-watch. Responsibilities of the MMO Performing monitoring procedures described in the MMO handbook; Abiding by the communication plan to be established between the 2 ships at the onset of the cruise; Adhering to a logbook of daily operations (activities and results); ensuring data are recorded correctly for data entry and data sheets are copied (and stored separately) for backup purposes; Acting as a source of marine mammal information; 220
221 Providing observation schedules and nighttime standby schedules to the Healy Chief Scientist Abiding by the safety procedures of the vessel and acting in a responsible manner at all times. Effort Report Form Data Recording The data was collected and recorded on one primary forms developed by NMFS. The CH2M Hill MMO completed daily observations which were preformed while seismic operations were and were not being conducted. The MMO recorded the following information. Vessel name; Observer names and affiliations; Date; Time and latitude/longitude when daily visual survey began and ended; Environmental conditions during visual survey were recorded hourly; o Wind speed and direction (average sustained); o Air and water temperature o Sea state (Beaufort sea/wind scale); o Swell (height in feet); o Weather conditions (e.g. rain, fog, haze, clear skies, cloud cover, ice conditions, etc.); o Ice Cover (% of water surface); o Overall visibility (based on distance to horizon in kilometers). Tidal Stage and closest tide were not pertinent in the arctic conditions and were not recorded. Sighting Form A Sighting form was completed when a marine mammal was observed and the following information was recorded: Date, time, location, vessel activity, seismic state and heading. Species, group size and individual characteristics. Behavior during initial sighting and post initial sighting or response to vessel encounter. Mammal bearing and distance from vessel and behavior pace (e.g. positive, sedate, or moderate). Sea state, ice cover, overall visibility (km), sun glare, water depths, and any other environmental parameters notable for individual sightings. The CH2M Hill MMO on Healy was not able to accurately judge the apparent reaction of the mammals to seismic vessel and closest point of approach due to the distance between the Healy and Louis. If the same mammal or group of mammals was sighted multiple times, they were assigned the same number in the sight id column on the sighting form. A comment noting when a mammal was seen multiple times was also included in the comment section of the form. The sighting codes were ordered sequentially for the entire cruise. Information necessary to complete the various data forms was available from instruments on the bridge and personal observation. Information regarding seismic, multibeam, and subprofile specifics were provided by the science party. 221
222 Data Codes OBSERVER Two letter initials of on-duty obs. OBSERVER LOCATION BR FB ST Bridge Flying Bridge Stern DATE/TIME Two number values (ie. 01, not 1) WATCH START END WS Watch Start WE Watch End SEISMIC ACTIVITY LS Line Shooting SH Shooting Betw/Off.Lines ST Seismic Testing SZ Safety Zone Shut-Down SD Shut-Down PZ Safety Zone Power-down PD Power-down OT Oth (comment&describe) # GUNS Enter Number of Operating Airguns, 88 Varying (e.g., ramp-up) 99 Unknown ARRAY VOLUME Enter operating volume, or 99 Unknown ARRAY DEPTH Depth at which guns are being towed POSITION Two digit Degrees Two digit, two decimal Minutes WATER DEPTH In meters SEA STATE See Beaufort Scale sheet VISIBILITY (# KM) 0 10 km Or > < 3.5 if variable LIGHT OR DARK L Light (day) D Darkness GLARE AMOUNT NO None LI Little MO Moderate SE Severe MARINE MAMMAL SPECIES Baleen Whales BHW Bowhead Whale UMW Unidentifed Mysticete Large Toothed Whales BW Beluga Whale KW Killer Whale NW Narwhal Dolphins UD Unidentified Dolphin Porpoises UP Unidentified Porpoise Pinnipeds BS Bearded Seal HS Hooded Seal RS Ringed Seal HPS Harp Seal US Unidentified Seal UP Unidentified Pinniped PWA Pacific Walrus Bear PB Polar Bear MOVEMENT PE ST SA FL SP MI NO DE UN Across Bow Swim Toward Swim Away Flee Swim Parallel Mill No movement Dead Unknown INDIVIDUAL BEHAVIOR MA SI FD TH DI LO LG SW BR LT SH FS FE FL BL BO Mating Sink Front Dive Thrash Dive Dive Look Logging Swim Breach Lobtail Spyhop Flipper Slap Feeding Fluking Blow Bow Riding PO RA WR AG RE OT NO UN Porpoising Rafting Wake Riding Approaching Guns Resting Other (describe) None (sign seen only) Unknown GROUP BEHAVIOR (BEHAVIORAL STATES) TR Travel SA Surface Active ST Surface Active-Travel MI Milling FG Feeding RE Resting OT Other (describe) UN Unknown BEHAVIOR PACE PO SE MO Positive Sedate Moderate # RETICLES or ESTIMATE (of Initial Distance, etc.; Indicate Big eyes or Fujinons in comments) 0 to 16 Number of reticles E Estimate, by eye CLOSEST POINT OF APPROACH (CPA) Nearest distance of individ/group (m) SIGHTING CUE BO Body HE Head SP Splash FL Flukes DO Dorsal Fin BL Blow BI Birds IDENTIFICATION RELIABILITY MA Maybe PR Probably POI Positive 222
223 Summary Sightings The following is an overview of individual sightings made by Leanna Russell (CH2M Hill) onboard the Healy and/or other bridge personnel. During the HEALY- 1102, the same MMOs observed five unidentified seals (seen by bridge personnel), 13 ringed seals, 13 bearded seals, and five polar bears during the Extended Continental Shelf survey. While in transit from the ECS and CAA area of interest 24 fin whales, one humpback whale and 12 gray whales were observed. Most seal sightings were in minimal ice coverage and exhibited similar behaviors and movements when encountered both on the ice and in the water. The polar bear encounters are explained in depth to capture all details during the observation. The whales that were encountered were near a notable feeding ground in the Bering Strait for these species. There was one occurrence where the Healy came to a stop and changed course as a fin whale was observed approximately 50 meters off the bow. 17 August 2011 Two bearded seals were observed at (71 40N, W) one was swimming at a moderate pace ~30m from the vessel then dove, and the other was seen by a Coast Guard watch stander at ~35m resting on the sea ice and looking at the vessel. One ringed seal was observed at (71 38N, W) swimming at a moderate pace at ~35m then dove into the water. 18 August 2011 One unknown seal was observed by a Coast Guard watch stander at (71 24N, W) swimming at a moderate pace and looking at the vessel at ~500m. One ringed seal was observed at (47 25N, W) swimming at a moderate pace at ~400m from the vessel. One unknown seal was observed by Sofie Webb (USFW Bird Observer) at (71 25N, W) swimming at a moderate pace and looking at the vessel at ~500m. 19 August 2011 Two ringed seals were observed resting on the ice at (71 48N, W) at ~600m. One ringed seal was observed swimming at a moderate pace at (71 48N, W) swimming at a moderate pace and splashing into the water at ~100m from the vessel. One bearded seal was observed resting on the ice and looking at the vessel at (71 48N, W) at ~300m from the vessel. 223
224 One bearded seal was observed swimming ~350m from the vessel and looking at it at (71 58N, W). One bearded seal was observed resting and looking at the vessel from ~400m away at (71 58N W) on the ice. One bearded seal was observed ~400m from the vessel resting on the ice and looking away at (71 59N, W). One ringed seal was observed at (71 59N, W) resting on the ice at ~600m and looking at the vessel. One ringed seal was observed at (71 59N, W) swimming at a sedate pace and looking at the vessel from ~600m away. One ringed seal was observed swimming at a moderate pace, then dove into the water ~500m from the vessel at (71 59N, W). One bearded seal was observed ~500m from the vessel resting on the ice and looking at the vessel at (71 01N, W). One bearded seal was observed swimming at a moderate pace ~300m from the vessel then dove into the water at (72 01N, W). One ringed seal was observed resting on the ice at ~210m from the vessel and looking around at (72 01N, W). Two bearded seals were observed resting on the ice at ~400m from the vessel. One of the seals dove into the water after several minutes of observation at (72 01N, W). One bearded seal was observed resting on the ice ~800m from the vessel and looking around at (72 01N, W). One ringed seal was observed resting on the ice at (72 01N, W). The seal was looking around and was ~600m from the vessel. 24 August 2011 One ringed seal was observed at ~600m from the vessel. The seal was resting on the ice and looking around. The position was (77 17N, W). 26 August 2011 One bearded seal was observed resting on the ice at ~500m from the vessel. The position of the vessel was (82 38N, W). 224
225 27 August 2011 One unknown seal was observed by Alice Orlich (Ice Observer) at (82 55N, W) and it was swimming at a moderate pace then dove into the water. 29 August 2011 One ringed seal was observed ~350m from the vessel, resting on the ice at (84 58N, W). One bearded seal was observed resting on the ice ~1000m from the vessel at (85 47N, W). 9 September 2011 One unknown seal was initially observed by a Coast Guard watch stander, which I had observed getting onto the ice one minute after the watch stander saw it swimming in the water ~50m from the vessel at (84 32N, W). 14 September 2011 Three polar bears, one sow and two cubs, were observed walking on the ice at a moderate pace and looking at the vessel. The bears were ~2000m from the vessel and walking in the opposite direction, and parallel to the vessel transit. The position of the vessel was (79 59N, W). 16 September 2011 One unknown seal was observed by a Coast Guard watch stander swimming ~300m from the vessel at a moderate pace, and looking around at (80 36N, W). 22 September 2011 Two polar bears, one sow and one cub, were observed walking ~2500m from the vessel at (77 29N, W). Bear tracks were also seen for the next 24 hours. One adult bear print followed in line by a cub print. 24 SEPTEMBER REPRESENTED THE END OF SURVEYING IN THE ECS TARGET AREAS. FROM THIS POINT ON OBSERVATIONS REPRESENT THE TRANSIT TRHOUGH THROUGH THE BERING STRAITS TO DUTCH HARBOR. OBSERVATIONS MADE DURING TRANSIT THROUGH BERING STRAITS TO DUCTH HARBOR 25 September 2011 One fin whale was observed swimming at a moderate pace ~2000m from the vessel at (65 38N, W). The blow of the whale was the cue for the sighting. 225
226 One gray whale was observed swimming at a moderate pace ~1500m from the vessel. The blow of the whale was the sighting cue at (65 43N, W). At (65 48N, W) one gray whale was seen from ~1500m from the vessel and two fin whales at ~2000m from the vessel and swimming at a moderate pace. The blows of whales were the sighting cues. Two gray whales were observed swimming at a moderate pace, after the initial blow was sighted at (65 48N, W). Three gray whales were observed after the sighting of their blows at ~2500m, ~3000m, ~500m, from the vessel at (65 39N, W). Also at this vessel position, three fin whales were observed at ~3000m from the vessel. All six whales were swimming at moderate paces. The dorsal fins were seen as each of the fin whales went below the surface of the water. One gray whale was observed at ~2000m and two fin whales at ~500m swimming at moderate paces at (65 36N, W). The sighting cues for the whales were the blows, and as the fin whales went below the surface of the water the dorsal fin was seen. At (41 73N, W) five gray whales were seen at ~600m, ~1500m, and ~500m from the vessel. The whales were swimming at a moderate pace and the blows of the whales were identification of the sightings. Also at this position one humpback whale was observed at ~1500m from the vessel. The whale dove down and the flukes of the whale were seen above the surface of the water. One fin whale was observed at (66 23N, W) swimming at a moderate pace at ~500m from the vessel. The dorsal fin was seen as the whale went below the surface of the water. 26 September 2011 One fin whale was observed swimming at a moderate pace ~600m from the vessel at (62 46N, W). One fin whale was observed swimming at a moderate pace ~500m from the vessel at (63 05N, W). One fin whale was observed swimming at a vigorous pace at ~1000m from the bow of the vessel. The vessel crew went to an immediate stop as well as changing the course of direction of the vessel so that there was no contact with the whale at (62 20N, W). At (62 11N, W) 10 fin whales were observed swimming at moderate paces in a parallel direction with the vessel. The whales were ~1000m, ~1500m from the vessel. 226
227 Conclusion During the duration of this cruise everyone aboard both vessels were very willing, helpful, and responsive when marine mammals were encountered. The communication between the MMOs, scientists, and Coast Guard personnel along with vessel to vessel contact was excellent and undoubtedly resulted in a pleasant achievement of individual goals and expectations for all parties involved. For future marine mammal observation programs I believe data collection protocols between all MMOs from the different organizations involved should be standardized so the information collected can be interpreted in the same manner under a common goal. 227
228 APPENDIX G - BIRD REPORT Sophie Webb U.S. Fish and Wildlife Service The 2011 ECS cruise provided an interesting opportunity to see what, if any, birds were utilizing the arctic ice during the late summer and early fall. Over 250 hours were spent conducting a 300 meter strip transect to census seabirds from the bridge of the USCG Cutter Healy. Birds were only encountered in any numbers below 72º N during the transit from Barrow to the main study area and the transit south through the Bering Sea back to Dutch Harbor. On the transit north from Barrow the birds were mostly long distance migrants leaving their nesting grounds in the tundra to head south to warmer waters. Arctic Terns, Red Phalaropes and Pomarine, Parasitic and Long-tailed jaegers were the most common species. The return transit in late September through the southern portion of the Chukchi Sea and the Bering Sea had a mixture of long distance and short distance migrants. There were still a number of Pacific Loons and eiders in the Chukchi Sea working their way south; while throughout the Bering sea transit there were groups of alcids: Crested, Least and Parakeet auklets, Tufted and Horned Puffins, Common and Thick-billed murres. Also we came across numerous Northern Fulmars, a feeding aggregation of Short-tailed Shearwaters (an Australian breeder) and several Red-legged Kittiwakes, a small gull endemic to the region. The birds that occurred at higher latitudes where generally outside their normal range. From August 24th, when we started to head into heavier ice with little to no open water, to September 23rd only three birds were recorded. An adult Pomarine Jaeger was seen at 79ºN 165º W and a juvenile Red Phalarope at 82ºN 131ºW. Both are species that should have been on their way south for the winter. The most northerly bird was a juvenile Glaucous Gull at 86º N 171º W. Glaucous gulls do visit the pack ice edge to feed and scavenge polar bear kills. Also it is a species that frequently sighted far from its normal range (records from Baja and mainland Mexico). The lack of birds in the dense ice, with no open areas was not surprising, as there was no access to food such as arctic cod and few seals or bears were encountered that might provide scavenging opportunities but the absence of birds from the ice edge was a surprise. Perhaps the ice was too far north to be readily utilized. In the lower latitudes, juvenile Sabine s gulls were associated with small single floes. If the Arctic ice continues to diminish it will be interesting to see how and if this affects bird distribution in the high Arctic in the future. 228


229 Red Phalarope juvenile Red-legged Kittiwake 229
Mapping in the Arctic Ocean in Support of a Potential Extended Continental Shelf
 Mapping in the Arctic Ocean in Support of a Potential Extended Continental Shelf Larry A. Mayer, Andrew A. Armstrong and James V. Gardner Center for Coastal & Ocean Mapping-Joint Hydrographic Center University
Seafloor Mapping in the High Arctic: The Challenges and the Joys
 Seafloor Mapping in the High Arctic: The Challenges and the Joys Larry Mayer Center for Coastal and Ocean Mapping / NOAA- UNH Joint Hydrographic Center University of New Hampshire, USA Martin Jakobsson
Challenges of Collecting Data for Article 76 in Ice Covered Waters of the Arctic
 Challenges of Collecting Data for Article 76 in Ice Covered Waters of the Arctic 5 th ABLOS Conference Monaco October 16, 2008 Richard MacDougall - Canada Jacob Verhoef - Canada Wendell Sanford - Canada
The french national programme for claiming continental shelf beyond 200 Miles
 The french national programme for claiming continental shelf beyond 200 Miles Using global bathymetric models in the context of an Extended Continental Shelf submission EXTRAPLAC Using Global Bathymetric
NOAA S Arctic Program in 2017
 NOAA S Arctic Program in 2017 NOAA s Arctic Mission To determine how the Arctic system is changing on time scales of weeks to decades, particularly with respect to the consequences that the loss of sea
Operating conditions in the Arctic: Data acquisition in the Arctic Ocean by the Continental Shelf Project of the Kingdom of Denmark
 Operating conditions in the Arctic: Data acquisition in the Arctic Ocean by the Continental Shelf Project of the Kingdom of Denmark By Christian Marcussen Geological Survey of Denmark and Greenland Danish
OUTER CONTINENTAL SHELF CLAIMS IN THE ARCTIC. Presentation given by Dr. Kamrul Hossain ASA University Bangladesh 15 March 2010
 OUTER CONTINENTAL SHELF CLAIMS IN THE ARCTIC Presentation given by Dr. Kamrul Hossain ASA University Bangladesh 15 March 2010 Contents Historical background of the continental shelf Concept of continental
Bathymetric data acquisition in Arctic waters
 Bathymetric data acquisition in Arctic waters within the Danish Continental Shelf Project Morten Sølvsten, Uni Bull, Richard Pedersen & Christian Marcussen Arctic-Antarctic Seafloor Mapping Meeting 2011
UNCLOS Article 76- Formulae and constraint lines
 UNCLOS Article 76- Formulae and constraint lines Dr Lindsay Parson (UNCLOS Group, National Oceanography Centre, UK) ABLOS TUTORIAL SESSION - Article 76 of UNCLOS 10th October 2005 IHO/IAG/IOC Advisory
46ºN to 75ºN (Quebec City to the Beaufort Sea): 2011 Ocean Mapping Group Operations in the Canadian Arctic, Part III. By Doug Cartwright
: 2011 Ocean Mapping Group Operations in the Canadian Arctic, Part III. By Doug Cartwright") 46ºN to 75ºN (Quebec City to the Beaufort Sea): 2011 Ocean Mapping Group Operations in the Canadian Arctic, Part III By Doug Cartwright Doug Cartwright, Christine Legere and Pim Kuus met up with the CCGS
46ºN to 75ºN (Quebec City to the Beaufort Sea): 2011 Ocean Mapping Group Operations in the Canadian Arctic, Part III By Doug Cartwright Doug Cartwright, Christine Legere and Pim Kuus met up with the CCGS
Canadian activities in the Pacific Arctic Region: 2016 icebreaker plans.
 Canadian activities in the Pacific Arctic Region: 2016 icebreaker plans. Pacific Arctic Group meeting Arctic Science Summit Week, Fairbanks, Alaska 13 March 2016 CCGS Louis S. St-Laurent UNCLOS misson:
Multibeam Mapping of Feature Rich Seafloor in the U.S. Pacific Remote Islands Marine National Monument and on Mendocino Ridge off the California Coast
 University of New Hampshire University of New Hampshire Scholars' Repository Center for Coastal and Ocean Mapping Center for Coastal and Ocean Mapping 3-2015 Multibeam Mapping of Feature Rich Seafloor
CONFERENCE OF PARLIAMENTARIANS OF THE ARCTIC REGION. UN LOS Convention and the extended continental shelf in the Arctic
 CONFERENCE OF PARLIAMENTARIANS OF THE ARCTIC REGION UN LOS Convention and the extended continental shelf in the Arctic Presentation given by Dr. Kamrul Hossain Finnish Parliament 18 November 2009 Contents
Arctic Hydrographic Adequacy an Update
 Arctic Hydrographic Adequacy an Update Lt Cmd. Samuel F. Greenaway 1 and Amber Batts 1,2 1. NOAA Office of Coast Survey Development Lab, Hydrographic Systems & Technology Branch, Silver Spring, Maryland,
Joint Hydrographic Center, National Oceanic and Atmospheric Administration, Durham, NH 03824, USA
 Future directions in hydrography using satellite-derived bathymetry Shachak Pe eri 1, Christopher Parrish 2, 3, Lee Alexander 1, Chukwuma Azuike 1, Andrew Armstrong 1,3 and Maryellen Sault 2 1 Center for
Map shows 3 main features of ocean floor
 Map shows 3 main features of ocean floor 2017 Pearson Education, Inc. Chapter 3 Marine Provinces 2017 Pearson Education, Inc. 1 Chapter 3 Overview The study of bathymetry determines ocean depths and ocean
National Marine Sanctuary Program
 National Marine Sanctuary Program NMSP/USGS Joint Seabed Mapping Initiative: September 2004 AA National Ocean Service National Marine Sanctuaries Interim Report September 2004 Background: Since 2002,
Bathymetry Measures the vertical distance from the ocean surface to mountains, valleys, plains, and other sea floor features
 1 2 3 4 5 6 7 8 9 10 11 CHAPTER 3 Marine Provinces Chapter Overview The study of bathymetry determines ocean depths and ocean floor topography. Echo sounding and satellites are efficient bathymetric tools.
SW Florida Escarpment Mapping Area
 Overview NOAA s Okeanos Explorer (EX) Program plans to conduct systematic mapping and telepresence-enabled ROV explorations in the Gulf of Mexico during Spring 2014. In 2011, the EX conducted mapping operations
MAPS AND COORDINATES...
 Table of Contents 1 INTRODUCTION... 2 2 MAPS AND COORDINATES... 3 3 ADVISORY ASSISTANCE FROM COMMISSION MEMBERS... 3 4 PROVISIONS OF ARTICLE 76 INVOKED... 3 5 OUTSTANDING MARITIME DELIMITATIONS... 4 6
Chapter Overview. Bathymetry. Measuring Bathymetry. Measuring Bathymetry
 CHAPTER 3 Marine Provinces Chapter Overview The study of bathymetry determines ocean depths and ocean floor topography. Echo sounding and satellites are efficient bathymetric tools. Most ocean floor features
EXECUTIVE SUMMARY A SUBMISSION OF DATA AND INFORMATION ON THE OUTER LIMITS OF THE CONTINENTAL SHELF OF THE REPUBLIC OF NIGERIA PURSUANT TO
 EXECUTIVE SUMMARY A SUBMISSION OF DATA AND INFORMATION ON THE OUTER LIMITS OF THE CONTINENTAL SHELF OF THE REPUBLIC OF NIGERIA PURSUANT TO PART VI OF AND ANNEX II TO THE UNITED NATIONS CONVENTION ON THE
CONTINENTAL SHELF SUBMISSION OF ANGOLA - EXECUTIVE SUMMARY -
 CONTINENTAL SHELF SUBMISSION OF ANGOLA - EXECUTIVE SUMMARY - INDEX List of Figures 2 List of Tables 3 1 Introduction 5 2 Provisions of Article 76 7 3 Angolan Institutions responsible for the Submission
SITE SURVEY FOR SITE 410, AN EXAMPLE OF THE USE OF LONG-RANGE SIDE-SCAN SONAR (GLORIA)
") 10. SITE SURVEY FOR SITE 410, AN EXAMPLE OF THE USE OF LONG-RANGE SIDE-SCAN SONAR (GLORIA) R. C. Searle and A. S. Laughton, Institute of Oceanographic Sciences, Wormley, GU8 5UB, UK and B. D. Loncarevic,
10. SITE SURVEY FOR SITE 410, AN EXAMPLE OF THE USE OF LONG-RANGE SIDE-SCAN SONAR (GLORIA) R. C. Searle and A. S. Laughton, Institute of Oceanographic Sciences, Wormley, GU8 5UB, UK and B. D. Loncarevic,
Meteor-Cruise M 75 / 2 Short Cruise Report Chief scientist: Dr. Jürgen Pätzold Universität Bremen Bremen / Germany
 Meteor-Cruise M 75 / 2 Short Cruise Report Chief scientist: Dr. Jürgen Pätzold Universität Bremen Bremen / Germany Dar es Salaam Dar es Salaam Febr. 06 th Febr. 24 th, 2008 1 SHORT CRUISE REPORT RV METEOR
NEW SEAFLOOR INSTALLATIONS REQUIRE ULTRA-HIGH RESOLUTION SURVEYS
 NEW SEAFLOOR INSTALLATIONS REQUIRE ULTRA-HIGH RESOLUTION SURVEYS Donald Hussong (Fugro Seafloor Surveys, Inc.) dhussong@fugro.com Fugro Seafloor Surveys, Inc., 1100 Dexter Avenue North (Suite 100), Seattle,
Earth in 2-D, 3-D & 4-D
 Earth in 2-D, 3-D & 4-D We will consider the scientific tools and techniques used to map surface features, reconstruct the layered structure of Earth, and interpret Earth history, including the origin
U.S. Law of the Sea Cruise to Map the Foot of the Slope and 2500-m Isobath of the U.S. Arctic Ocean Margin, Barrow to Barrow.
 University of New Hampshire University of New Hampshire Scholars' Repository Center for Coastal and Ocean Mapping Center for Coastal and Ocean Mapping 2-15-2004 U.S. Law of the Sea Cruise to Map the Foot
THE MEASUREMENT AND ANALYSIS OF BATHYMETRY, MORPHOLOGY, AND SEDIMENT THICKNESS
 THE MEASUREMENT AND ANALYSIS OF BATHYMETRY, MORPHOLOGY, AND SEDIMENT THICKNESS Ron Macnab Geological Survey of Canada (Retired) OUTLINE OF PRESENTATION Principles and practice of: Echo-sounding Seismic
Non-Technical Summary
 Non-Technical Summary Proposed Project TGS-NOPEC Geophysical Company ASA (TGS) proposes to undertake a two dimensional (2D) seismic survey and seabed sampling in the western Greenland Sea off North East
Offshore Operations and Project Execution Geophysical Site Surveys
 Offshore Operations and Project Execution Geophysical Site Surveys Chris Almond Senior Geophysicist Fugro Survey Limited 22/04/2015 Presentation Summary: Office-based Personnel Project Awarded Pre Offshore
NOAA/University of New Hampshire Joint Hydrographic Center & Center for Coastal and Ocean Mapping. MAPPS Summer Conference July 23, 2013
 NOAA/University of New Hampshire Joint Hydrographic Center & Center for Coastal and Ocean Mapping MAPPS Summer Conference July 23, 2013 07/23/2013 2 07/23/2013 3 Center Goals To be a world leader in the
CSL HERON MAPPING OPERATIONS, MAY 23 RD -JUNE 4 TH BLUE HILL BAY, MAINE, USA OCEAN MAPPING GROUP CRUISE REPORT JAMES MUGGAH AND TRAVIS HAMILTON
 CSL HERON MAPPING OPERATIONS, MAY 23 RD -JUNE 4 TH BLUE HILL BAY, MAINE, USA OCEAN MAPPING GROUP CRUISE REPORT JAMES MUGGAH AND TRAVIS HAMILTON SPRING 2009 / NOVEMBER 2009 OCEAN MAPPING GROUP UNIVERSITY
U.S. Arctic Campaign Scenario
 Prepared by the NOAA Office of Ocean Exploration and Research for Nation Ocean Exploration Forum 2016: Beyond the Ships. Sea ice extent from National Snow Service Layer Credits: NOAA National Centers for
Background Information
 Oceanography LAB #1: Marine Charts and Navigation Background Information Latitude and Longitude A coordinate is an address a means of designating location. Most coordinate systems involve a network of
I. PURPOSE. This White Paper describes the role(s), value, and preparation requirements for a
, value, and preparation requirements for a") USE OF A SUBMARINE IN ICE-COVERED ARCTIC WATERS TO HELP DELIMIT THE U.S. EXTENDED CONTINENTAL SHELF (Draft White Paper from the U.S. Arctic Research Commission) (Rev. 12-18-07) I. PURPOSE. This White Paper
USE OF A SUBMARINE IN ICE-COVERED ARCTIC WATERS TO HELP DELIMIT THE U.S. EXTENDED CONTINENTAL SHELF (Draft White Paper from the U.S. Arctic Research Commission) (Rev. 12-18-07) I. PURPOSE. This White Paper
Foundations of Earth Science, 6e Lutgens, Tarbuck, & Tasa
 Foundations of Earth Science, 6e Lutgens, Tarbuck, & Tasa Oceans: The Last Frontier Foundations, 6e - Chapter 9 Stan Hatfield Southwestern Illinois College The vast world ocean Earth is often referred
Proceedings of the Canadian Hydrographic Conference and National Surveyors Conference 2008
 From the Arctic to the Tropics: The U.S. UNCLOS Bathymetric Mapping Program James V. Gardner, Larry A. Mayer and Andrew A. Armstrong CCOM/JHC University of New Hampshire, Durham, NH Abstract Since CHC2006,
Cruise and Data Report: R/V Shana Rae operations in support of April 2015 AirSWOT campaign, April 17-20, 2015
 Cruise and Data Report: R/V Shana Rae operations in support of April 2015 AirSWOT campaign, April 17-20, 2015 J. Thomas Farrar, Benjamin Hodges, Sebastien Bigorre Physical Oceanography Department Woods
Oceanography. Oceanography is the study of the deep sea and shallow coastal oceans.
 Oceanography Oceanography is the study of the deep sea and shallow coastal oceans. Studying the Ocean Floor To determine the shape and composition of the ocean floor, scientists use techniques such as
Changes in bottom morphology of Long Island Sound near Mount Misery Shoal as observed through Repeated Multibeam Surveys
 Changes in bottom morphology of Long Island Sound near Mount Misery Shoal as observed through Repeated Multibeam Surveys Laurie A. Zaleski Laurie.Zaleski@msrc.sunysb.edu Roger D. Flood rflood@notes.cc.sunysb.edu
COMPLICATIONS IN DELIMITING THE OUTER CONTINENTAL SHELF. Ron Macnab Geological Survey of Canada (Retired)
") COMPLICATIONS IN DELIMITING THE OUTER CONTINENTAL SHELF Ron Macnab Geological Survey of Canada (Retired) DISCLAIMER The contents of this presentation are the author s personal views only, and do not represent
COMPLICATIONS IN DELIMITING THE OUTER CONTINENTAL SHELF Ron Macnab Geological Survey of Canada (Retired) DISCLAIMER The contents of this presentation are the author s personal views only, and do not represent
Lecture Outlines PowerPoint. Chapter 13 Earth Science 11e Tarbuck/Lutgens
 Lecture Outlines PowerPoint Chapter 13 Earth Science 11e Tarbuck/Lutgens 2006 Pearson Prentice Hall This work is protected by United States copyright laws and is provided solely for the use of instructors
ALASKA DEEP-DRAFT ARCTIC PORT EVALUATION
 ALASKA DEEP-DRAFT ARCTIC PORT EVALUATION Joint Study of Federal and State June 20, 2012 Opportunity and Constraint Warming of Arctic region is leading to new maritime opportunities. Thawing of permafrost
Korean Arctic Research 2015 update
 FARO Annual Meeting, ASSW 2016 Fairbanks, Alaska, 12 March 2016 Korean Arctic Research 2015 update International Cooperation Department Korea Polar Research Institute Outline KOPRI and Korean Arctic research;
Oceanography, An Invitation to Marine Science 9e Tom Garrison. Ocean Basins Cengage Learning. All Rights Reserved.
 Oceanography, An Invitation to Marine Science 9e Tom Garrison 4 Ocean Basins Key Concepts Tectonic forces shape the seabed The ocean floor is divided into continental margins and deep ocean basins The
7.0 Project Reports 7.1 Geophysical Mapping of Submarine Environments
 7.0 Project Reports 7.1 Geophysical Mapping of Submarine Environments Suzanne Carbotte, Robin Bell, Roger Flood 7.1.1 METHODS In April 2000 we deployed the R/V Onrust, operated by MSRC at SUNY Stony Brook,
IODP Science Evaluation Panel: Guidelines and Rationale for Site Characterization Data (Revised: August 2013)
") Site Characterization Data Guidelines IODP Science Evaluation Panel: Guidelines and Rationale for Site Characterization Data (Revised: August 2013) This document outlines the method and rationale for data
Site Characterization Data Guidelines IODP Science Evaluation Panel: Guidelines and Rationale for Site Characterization Data (Revised: August 2013) This document outlines the method and rationale for data
Data archiving and dissemination, sample information, scientists ashore, and multibeam bathymetric collection and data processing (Raineault) 10
 10") Cover: Seafloor image (~0.5 m across) of a methane hydrate shelf above bubble streams discovered on dive H1517 at Astoria Canyon on the southern canyon floor, 850 m depth. 3d background image of Astoria
Cover: Seafloor image (~0.5 m across) of a methane hydrate shelf above bubble streams discovered on dive H1517 at Astoria Canyon on the southern canyon floor, 850 m depth. 3d background image of Astoria
VOYAGE (PASSAGE) PLANNING
 PLANNING") VOYAGE (PASSAGE) PLANNING Introduction O Passage planning or voyage planning is a procedure of developing a complete description of a vessel's voyage from start to finish. O Production of a passage plan
VOYAGE (PASSAGE) PLANNING Introduction O Passage planning or voyage planning is a procedure of developing a complete description of a vessel's voyage from start to finish. O Production of a passage plan
f r o m a H i g h - R e s o l u t i o n I c e - O c e a n M o d e l
 Circulation and Variability in the Western Arctic Ocean f r o m a H i g h - R e s o l u t i o n I c e - O c e a n M o d e l Jeffrey S. Dixon 1, Wieslaw Maslowski 1, Jaclyn Clement 1, Waldemar Walczowski
Potential Fields Pool Equipment (PFPE) Focus Group. James Kinsey Randy Herr Dan Fornari
 Focus Group. James Kinsey Randy Herr Dan Fornari") Potential Fields Pool Equipment (PFPE) Focus Group James Kinsey jkinsey@whoi.edu Randy Herr Randyherr@aol.com Dan Fornari dfornari@whoi.edu Outline Review status and discuss future actions for: Spares
Potential Fields Pool Equipment (PFPE) Focus Group James Kinsey jkinsey@whoi.edu Randy Herr Randyherr@aol.com Dan Fornari dfornari@whoi.edu Outline Review status and discuss future actions for: Spares
Buoy deployment by the ice breaker USCG Healy
 Enhancements of the Arctic Buoys for the International Polar Year Buoy deployment by the ice breaker USCG Healy Buoys-on-Ice 2007 a success: Deployment flights 26 and 29 March o Flying hours funded by
SCICEX Phase 2 Accommodation Cruises. Provided by T. Boyd
 SCICEX Phase 2 Accommodation Cruises Provided by T. Boyd OBJECTIVES Re-invigorate the SCICEX Science Advisory Committee Maximize the contribution of SCICEX in understanding di the Arctic Ocean processes
June 13-July 8, Astoria-Astoria
 MGL1211: Cascadia Basin Ridge to Trench June 13-July 8, Astoria-Astoria Motivation 1. How does the JdF plate evolve from ridge to trench and is there significant hydration of the crust and upper mantle
Outline of presentation
 - lessons learnt from precedent cases of establishing the s Outline of presentation Extending Ireland s continental shelf jurisdiction to the outer s in the Porcupine Abyssal Plain: progress, issues and
The Ocean Floor Earth Science, 13e Chapter 13
 The Ocean Floor Earth Science, 13e Chapter 13 Stanley C. Hatfield Southwestern Illinois College The vast world ocean Earth is often referred to as the blue planet Seventy-one percent of Earth s surface
MARINE GEOLOGY & GEOGRAPHY
 MARINE GEOLOGY & GEOGRAPHY Bathymetry BATHYMETRY BATHYMETRY THE UNDERWATER EQUIVALENT TO TOPOGRAPHY THE STUDY OF WATER DEPTH A BATHYMETRIC MAP SHOWS FLOOR RELIEF OR TERRAIN AS CONTOUR LINES Bathymetry
Charleston to Woods Hole R/V Armstrong Transit: Atlantic Margin Upper Slope Fluid Flow Features, Seafloor and Water Column Surveys
 Charleston to Woods Hole R/V Armstrong Transit: Atlantic Margin Upper Slope Fluid Flow Features, Seafloor and Water Column Surveys Contacts: Carolyn Ruppel (US Geological Survey, cruppel@usgs.gov, 508-457-2339)
Table of Contents. Introduction 4. Chapter 1 Research and the Deep Oceans 6. Chapter 2 Physical Characteristics of the Ocean 10
 Table of Contents Introduction 4 Chapter 1 Research and the Deep Oceans 6 Chapter 2 Physical Characteristics of the Ocean 10 Chapter 3 Composition of the Oceans Waters 16 Chapter 4 Tides, Waves, and Currents
IRELAND. PART I Executive Summary
 IRELAND Submission to the Commission on the Limits of the Continental Shelf pursuant to Article 76, paragraph 8 of the United Nations Convention on the Law of the Sea 1982 in respect of the area abutting
Update on Pacific Arctic Group (PAG) activities
 activities") Update on Pacific Arctic Group (PAG) activities Jacqueline Grebmeier 1 and Sung-Ho Kang 2 1 Member, PAG Executive Committee, Chesapeake Biological Laboratory, University of Maryland Center for Environmental
Update on Pacific Arctic Group (PAG) activities Jacqueline Grebmeier 1 and Sung-Ho Kang 2 1 Member, PAG Executive Committee, Chesapeake Biological Laboratory, University of Maryland Center for Environmental
Ice and Ocean Mooring Data Statistics from Barrow Strait, the Central Section of the NW Passage in the Canadian Arctic Archipelago
 Ice and Ocean Mooring Data Statistics from Barrow Strait, the Central Section of the NW Passage in the Canadian Arctic Archipelago Simon Prinsenberg and Roger Pettipas Bedford Institute of Oceanography,
Kyle Griebel NRS 509 Dr. August & Dr. Wang GIS and remote sensing in Seafloor mapping
 GIS and remote sensing in Seafloor mapping Introduction to seafloor mapping Seafloor maps have a wide variety of uses for scientists and coastal planning needs. Some of these uses include biological assessment
Cruise Report YK10-06
 Cruise Report YK10-06 (R/V Yokosuka) Site Surveys for drilling projects of IODP at the Kumano-nada and the northern Izu-Bonin arc June 13 20, 2010 Center for Deep Earth Exploration (CDEX) Japan Agency
SEA FLOOR MAPPING IN THE ARCTIC: SUPPORT FOR A POTENTIAL US EXTENDED CONTINENTAL SHELF
 SEA FLOOR MAPPING IN THE ARCTIC: SUPPORT FOR A POTENTIAL US EXTENDED CONTINENTAL SHELF By Larry A. Mayer, A. Armstrong, B, Calder and J. Gardner (USA) Abstract For the United States, the greatest opportunity
Earth / Environmental Science. Ch. 14 THE OCEAN FLOOR
 Earth / Environmental Science Ch. 14 THE OCEAN FLOOR The Blue Planet Nearly 70% of the Earth s surface is covered by the global ocean It was not until the 1800s that the ocean became an important focus
The Physical Context for Thin Layers in the Coastal Ocean
 The Physical Context for Thin Layers in the Coastal Ocean David M. Fratantoni Physical Oceanography Department Woods Hole Oceanographic Institution Woods Hole, MA 02543 phone: (508) 289-2908 fax: (508)
2) re-positioning of the SSS data, 3) individuation of geomorphological features and morphometrical parameters correlated to instability phenomena.
 re-positioning of the SSS data, 3) individuation of geomorphological features and morphometrical parameters correlated to instability phenomena.") HIGH-RESOLUTION SIDE SCAN SONAR AND MULTIBEAM DATA PROCESSING AND MERGING TO STUDY SUBMARINE INSTABILITY PHENOMENA ON VOLCANIC ISLANDS (PONTINE, CAMPANIAN AND AEOLIAN ARCHIPELAGOS) A. BOSMAN Extended abstract:
HIGH-RESOLUTION SIDE SCAN SONAR AND MULTIBEAM DATA PROCESSING AND MERGING TO STUDY SUBMARINE INSTABILITY PHENOMENA ON VOLCANIC ISLANDS (PONTINE, CAMPANIAN AND AEOLIAN ARCHIPELAGOS) A. BOSMAN Extended abstract:
ESP Process Flow. 2/27/2012 Environmental Studies Program 1
 ESP Process Flow 2/27/2012 Environmental Studies Program 1 Studies Management Process Timeline Oct Nov Dec Jan Feb Mar Apr May Jun Jul Aug SDP Guidance Stakeholder Input Due SDP Preparation Draft SDPs
Figure 3.1: Illustration showing the bathymetry s role for the tsunami propagation following the earth quake 26 December 2004 outside of Sumatra.
 Figure 3.1: Illustration showing the bathymetry s role for the tsunami propagation following the earth quake 26 December 2004 outside of Sumatra. The left globe shows the seafloor bathymetry as portrayed
GEOL- 270: Issues in Oceanography Developed by Jessica Kleiss, Lewis & Clark College
 GEOL- 270: Issues in Oceanography Developed by Jessica Kleiss, Lewis & Clark College Lab 02: Ocean floor bathymetry. Material for students to bring: A calculator A ruler Pens and pencils Objectives: Interpret
Introduction to Acoustic Remote Sensing and Seafloor Mapping (AE4-E13) May 19, 2010
 May 19, 2010") Introduction to Acoustic Remote Sensing and Seafloor Mapping (AE4-E13) May 19, 2010 1 Delft Vermelding Institute onderdeel of Earth organisatie Observation and Space Systems Why Acoustic Remote Sensing?
Introduction to Acoustic Remote Sensing and Seafloor Mapping (AE4-E13) May 19, 2010 1 Delft Vermelding Institute onderdeel of Earth organisatie Observation and Space Systems Why Acoustic Remote Sensing?
EFFECT OF HURRICANE MICHAEL ON THE UNDERWATER ACOUSTIC ENVIRONMENT OF THE SCOTIAN SHELF
 EFFECT OF HURRICANE MICHAEL ON THE UNDERWATER ACOUSTIC ENVIRONMENT OF THE SCOTIAN SHELF D. HUTT, J. OSLER AND D. ELLIS DRDC Atlantic, Dartmouth, Nova Scotia, Canada B2Y 3Z7 E-mail: daniel.hutt@drdc-rddc.gc.ca
The Arctic Crossroads
 The Arctic Crossroads The Influence of the Mendeleev Ridge and the Chukchi Borderland on the Large-scale Circulation of the Arctic Ocean Rebecca Woodgate and Knut Aagaard, University of Washington Jim
Final Report for DOEI Project: Bottom Interaction in Long Range Acoustic Propagation
 Final Report for DOEI Project: Bottom Interaction in Long Range Acoustic Propagation Ralph A. Stephen Woods Hole Oceanographic Institution 360 Woods Hole Road (MS#24) Woods Hole, MA 02543 phone: (508)
Directed Reading. Section: The Water Planet. surface is called the a. Earth s ocean. b. Pacific Ocean. c. salt-water ocean. d. global ocean.
 Skills Worksheet Directed Reading Section: The Water Planet 1. The body of salt water covering nearly three-quarters of the Earth s surface is called the a. Earth s ocean. b. Pacific Ocean. c. salt-water
Chapter 9 Lecture Outline. Oceans: The Last Frontier
 Chapter 9 Lecture Outline Oceans: The Last Frontier The Vast World Ocean Earth is referred to as the blue planet 71% of Earth s surface is oceans and marginal seas Continents and islands comprise the remaining
Fine-scale Survey of Right and Humpback Whale Prey Abundance and Distribution
 DISTRIBUTION STATEMENT A: Approved for public release; distribution is unlimited. Fine-scale Survey of Right and Humpback Whale Prey Abundance and Distribution Joseph D. Warren School of Marine and Atmospheric
Office of Naval Research Update and Status of Arctic Environmental Programs
 Office of Naval Research Update and Status of Arctic Environmental Programs October 2017 CDR Blake McBride Deputy, Ocean, Atmosphere and Space Research Division Office of Naval Research marvin.mcbride@navy.mil
UpTempO buoys for Understanding and Prediction
 DISTRIBUTION STATEMENT A. Approved for public release; distribution is unlimited. UpTempO buoys for Understanding and Prediction Michael Steele Applied Physics Laboratory University of Washington 1013
Introduction After reviewing the classification of continental margins (not plate margins) in your textbook, answer the following questions:
 in your textbook, answer the following questions:") Investigating the continental margins of North America using GeoMapApp. This exercise is designed to familiarize you with the features of continental margins. Through the analysis of color-coded bathymetric
Investigating the continental margins of North America using GeoMapApp. This exercise is designed to familiarize you with the features of continental margins. Through the analysis of color-coded bathymetric
FINMARINET: Inventories and Planning for the Marine Natura 2000 Network in Finland. A.2 Geological inventories of the seafloor Final Report
 LIFE07 NAT/FIN/000151 FINMARINET: Inventories and Planning for the Marine Natura 2000 Network in Finland A.2 Geological inventories of the seafloor Final Report Geological Survey of Finland, GTK 1. Introduction
FOOT OF THE CONTINENTAL SLOPE IN ARTICLE 76
 FOOT OF THE CONTINENTAL SLOPE IN ARTICLE 76 Vaughan Stagpoole, Institute of Geological & Nuclear Sciences, Lower Hutt, New Zealand, v.stagpoole@gns.cri.nz Ray Wood, Institute of Geological & Nuclear Sciences,
Office of Naval Research Arctic Observing Activities
 Office of Naval Research Arctic Observing Activities Jim Thomson Applied Physics Laboratory, University of Washington jthomson@apl.washington.edu Scott L. Harper, Program Officer, Arctic and Global Prediction
Changes in Geomorphology and Backscatter Patterns in Mount Misery Shoal, Long Island Sound as Revealed through Multiple Multibeam Surveys
 Changes in Geomorphology and Backscatter Patterns in Mount Misery Shoal, Long Island Sound as Revealed through Multiple Multibeam Surveys Laurie A. Zaleski Laurie.Zaleski@msrc.sunysb.edu, Roger D. Flood
H.A.R.S. PRA #1 (Historic Area Remediation Site)
") H.A.R.S. PRA #1 (Historic Area Remediation Site) 2009 Multibeam Bathymetry TABLE OF CONTENTS Page LIST OF TABLES 2 LIST OF FIGURES 3 1.0 INTRODUCTION 4 2.0 OBJECTIVE 4 3.0 PROCEDURE 4 3.1 DATA ACQUISITION
H.A.R.S. PRA #1 (Historic Area Remediation Site) 2009 Multibeam Bathymetry TABLE OF CONTENTS Page LIST OF TABLES 2 LIST OF FIGURES 3 1.0 INTRODUCTION 4 2.0 OBJECTIVE 4 3.0 PROCEDURE 4 3.1 DATA ACQUISITION
Lecture Marine Provinces
 Lecture Marine Provinces Measuring bathymetry Ocean depths and topography of ocean floor Sounding Rope/wire with heavy weight Known as lead lining Echo sounding Reflection of sound signals 1925 German
Essential Question: How are the geological features that exist on land similar to the geological features on the ocean floor?
 Essential Question: How are the geological features that exist on land similar to the geological features on the ocean floor? Geography of the Oceans The world ocean can be divided into four main ocean
Missions from MARS: Marine Autonomous and Robotic Systems - current and future science applications
 Missions from MARS: Marine Autonomous and Robotic Systems - current and future science applications Dr Russell B Wynn (MARS Chief Scientist, Head of NOC Marine Geoscience) Marine Autonomous and Robotic
Ocean Basins, Bathymetry and Sea Levels
 Ocean Basins, Bathymetry and Sea Levels Chapter 4 Please read chapter 5: sediments for next class and start chapter 6 on seawater for Thursday Basic concepts in Chapter 4 Bathymetry the measurement of
Topic: Bathymetric Survey Techniques. (a) Single-beam echo-sounders (SBES) (b) Multi-beam echo-sounders (MBES)
 Single-beam echo-sounders (SBES) (b) Multi-beam echo-sounders (MBES)") Topic: Bathymetric Survey Techniques (a) Single-beam echo-sounders (SBES) (b) Multi-beam echo-sounders (MBES) Bathymetry is the measurement of water depths - bathymetry is the underwater equivalent of
Topic: Bathymetric Survey Techniques (a) Single-beam echo-sounders (SBES) (b) Multi-beam echo-sounders (MBES) Bathymetry is the measurement of water depths - bathymetry is the underwater equivalent of
APPENDIX B PHYSICAL BASELINE STUDY: NORTHEAST BAFFIN BAY 1
 APPENDIX B PHYSICAL BASELINE STUDY: NORTHEAST BAFFIN BAY 1 1 By David B. Fissel, Mar Martínez de Saavedra Álvarez, and Randy C. Kerr, ASL Environmental Sciences Inc. (Feb. 2012) West Greenland Seismic
Prepared by the North American Ice Service. 4 December Seasonal Outlook Great Lakes Winter
 Prepared by the North American Ice Service A collaboration of the Canadian Ice Service and the National/Naval Ice Center 4 December 2008 Seasonal Outlook Great Lakes Winter 2008-2009 - 1 - Table of contents
Report on the 2005 Dogger Bank cruise with R. V. Senckenberg
 Report on the 2005 Dogger Bank cruise with R. V. Senckenberg 2. 10. 8. 2005 MICHAEL TÜRKAY Forschungsinstitut Senckenberg Frankfurt a. M. Contents: 1. Aims and setting 2. Narrative and methods 3. Methods
Sediment Transport and Strata Formation in the Adriatic Sea
 Sediment Transport and Strata Formation in the Adriatic Sea Wayne R. Geyer James D. Irish Peter A. Traykovski Woods Hole Oceanographic Institution Woods Hole, MA 02543 Tel. (508) 289-2868, Fax: (508) 457-2194,
Earth s Continents and Seafloors. GEOL100 Physical Geology Ray Rector - Instructor
 Earth s Continents and Seafloors GEOL100 Physical Geology Ray Rector - Instructor OCEAN BASINS and CONTINENTAL PLATFORMS Key Concepts I. Earth s rocky surface covered by of two types of crust Dense, thin,
2. Identify other PIs associated with the cruise: 3. Identify the at-sea Chief Scientist: Charles Langmuir
 Pre-Cruise Meeting April 17, 2014 AT26-19, Charles Langmuir, Aug 28 Sept 11, 2014. RV Atlantis with OSU Coring Facility General Program Overview: 1. Scientific Objectives: Our aim is to obtain as many
Proposed travel plan and timing
 Proposed travel plan and timing Figure 1: Proposed GLACE cruise track. The circumnavigation of Greenland will be subdivided into 2 Legs: Leg 1 (Southern Greenland, SG) from Reykjavik to Ilulisat, and Leg
Article 76, variations in annotation and implementation seen in submission documents for the claim of Extended Continental Shelf
 Article 76, variations in annotation and implementation seen in submission documents for the claim of Extended Continental Shelf Mr. Shin Tani Chairman, IHO/IAG Advisory Board on the Law of the Sea (ABLOS)