Figure 3.1: Illustration showing the bathymetry s role for the tsunami propagation following the earth quake 26 December 2004 outside of Sumatra.
|
|
|
- Barry Gray
- 5 years ago
- Views:
Transcription
.")
1 Figure 3.1: Illustration showing the bathymetry s role for the tsunami propagation following the earth quake 26 December 2004 outside of Sumatra. The left globe shows the seafloor bathymetry as portrayed by the GEBCO grid and the globe to the right has the tsunami amplitude overprinted (data from Titov et al., 2005). The seafloor ridges acted as efficient wave guides. The epicenter of the earth quake located approximately 260 km southwest of Banda Aceh, Sumatra, is marked with a yellow star. The illustration is modified from Jakobsson and Hell (2006).

 was extremely poorly mapped at the time the search for parts of the fuselage could begin (Smith and Marks, 2014).")
2 Figure 3.2: The need for high resolution bathymetry also in the deep ocean became strikingly evident also outside of the scientific community following the disappearance 8 March 2014 of Malaysia Airlines flight MH370, on the route from Kuala Lumpur to Beijing. The seafloor in the projected search area (Green box) was extremely poorly mapped at the time the search for parts of the fuselage could begin (Smith and Marks, 2014). Black lines are ship track lines along where single beam echo sounding data have been collected and red show multibeam bathymetry available at the time the search began. The bathymetric data coverage was far from even sufficient to send down underwater vehicles for close inspections of the seafloor. In essence, a search for a lost object of the size of an aircraft would have a better start if it was lost on the planet Mars, which is substantially better mapped the World Ocean.

3
.")
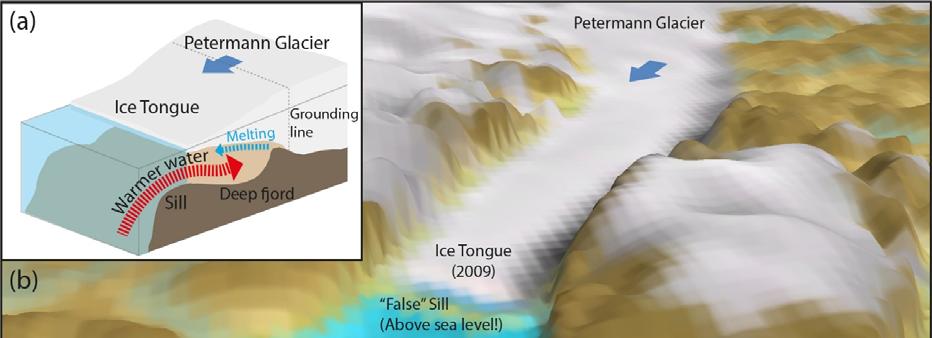
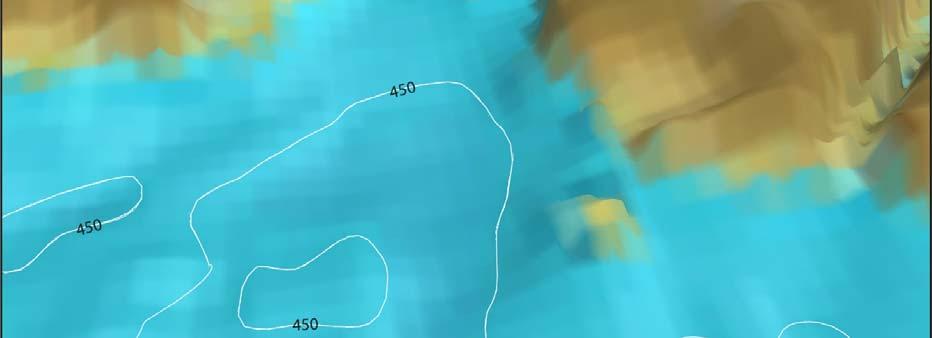
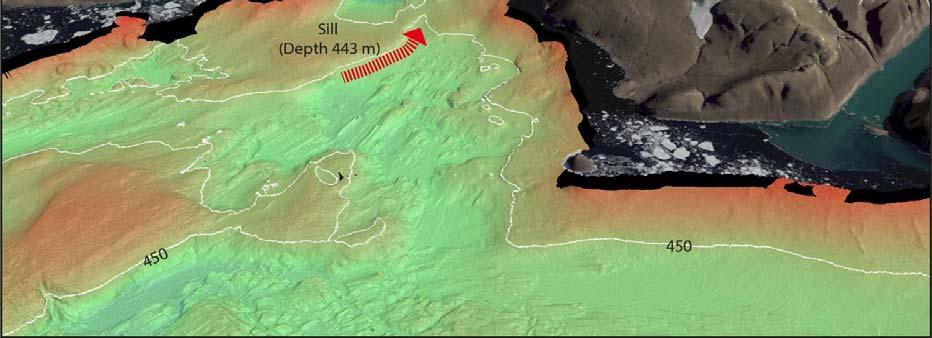
4 Figure 3.3: The importance of knowing the shape and depth of the seafloor can be shown with many specific examples. One such example is the influence of a fjord s bathymetry on outlet glaciers sensitivity to inflow of warmer sub surface ocean water (Holland et al., 2008). The dynamic behavior of glaciers suddenly subjected to warmer ocean water may change and lead to rapid mass loss of ice, in turn causing sea level rise that impacts living conditions far beyond the Polar Regions. a) Conceptual illustration of glaciers draining large ice sheets, such as the Greenland or Antarctic ice sheets, into the ocean. These glaciers commonly have a large floating parts referred to as ice shelves or ice tongues, when constrained in a fjord. Shallow bathymetric sills at the fjord entrance will help making the ice tongue and feeding glacier less sensitive to ocean warming and changes in ocean current regimes, which has been observed in several Polar areas and attributed as an effect of a warmer climate (Jacobs et al., 2011; Mouginot et al., 2015; Rignot et al., 2013). The illustration in a is for example representative for the Petermann Glacier, located on northwestern Greenland and draining about 6% of the entire Greenland Ice Sheet. The Petermann ice tongue appeared stabile and located near the fjord s sill until 2010 and 2012, when Manhattan sized pieces broke off and reduced the ice tongue with about 30 40% (Münchow et al., 2014). b) The Petermann Fjord as portrayed in IBCAO Version 3.0. The grid model had only a few single echo sounding measurement in the fjord area resulting in crude bathymetry and a false bathymetric sill appearing in the gridded model due to extremely sparse data. This sill appeared even to have sections above sea level. Such shallow sill would make the Petermann Glacier less sensitive to influx of warmer water. c) Complete multibeam mapping of the Petermann Fjord was carried out with Swedish icebreaker Oden in 2015 (Mix et al., 2015). The seafloor portrayal is in c is based on a 15 x 15 m multibeam grid. The true nature of the bathymetric sill was releveled. The sill is generally deeper than 350 m, which a deepest passage of 453 m. This implies that the Petermann Glacier is much more sensitive to warmer subsurface water than IBCAO Ver. 3.0 suggest, which may explain the recent retreat history with massive calving events 2010 and The multibeam bathymetry also reveal the past extension and behavior of Petermann Glacier from a complex seafloor morphology consisting of glacial landforms. Figure 3.4: The concept of an unmanned mapping barge, steered by satellite communication and equipped with an ultra narrow beam deep water multibeam (left). Such a barge would be able to systematically map the deepest sections of the open ocean from the surface at even higher resolution than 100 x 100 m. The sub meter level of detail sometimes needed to investigate small scale processes at the seabed is today possible to acquire in the deep ocean using AUVs (right) equipped with high resolution high

5 frequency multibeam systems. These AUVs would serve as excellent complements to the mapping barge, but their present endurance, cost, and swath cover does not make them the tool for mapping the entire World Ocean floor. Figure 4.1: A shaded relief of the GEBCO_2014 grid. Figure is from Weatherall et al. (2015).
 grid cells.")
6 Figure 4.2: GEBCO 2014 bathymetric data coverage. At this scale the World Ocean appears much better covered with ship soundings than it is. The fact is that the available bathymetric data used to compile GEBCO_2014 provided depth control points to only 18 % of all the 30 arc second (926 m at the equator) grid cells. Figure is from Weatherall et al. (2015).

7 Figure 4.3: The GEBCO_2014 grid model over a portion of the southern Mid Atlantic ridge where multibeam bathymetry is blended with a coarser grid based on interpolation using sparse single beam echo soundings guided by satellite altimetry. a) Overview of the Mid Atlantic ridge section. b) The ship track lines along where bathymetric soundings were gathered and used in the model. c) An area that has been surveyed using multibeam. Details in the ridge morphology are readily evident in the incorporated multibeam survey. d) A segment of the spreading ridge where the depths estimated primarily from satellite altimetry. Only a hint of the ridge morphology is seen. The reason for the lack of detail in d is that the satellite altimetry cannot resolve small features due to the altimeter track spacing, and a physical limitation of the gravity method known as downward continuation. Figure us from Weatherall et al. (2015).


8 Figure 4.4. Multibeam bathymetry included in the GEBCO_2014 grid.


9 Figure 5.1. Structure of Seabed 2030.
Figure 3.1: Illustration showing the bathymetry s role for the tsunami propagation following the earth quake 26 December 2004 outside of Sumatra.
 Figure 3.1: Illustration showing the bathymetry s role for the tsunami propagation following the earth quake 26 December 2004 outside of Sumatra. The left globe shows the seafloor bathymetry as portrayed
GEBCO-Nippon Foundation. Seabed 2030
 GEBCO-Nippon Foundation Seabed 2030 The Roadmap for Future Ocean Floor Mapping Executive Summary 1.0. Introduction and goals The oceans, covering seventy percent of the Earth s surface, are fundamental
High-resolution Geophysical Mapping of Submarine Glacial Landforms
 High-resolution Geophysical Mapping of Submarine Glacial Landforms M. Jakobsson 1, J.A. Dowdeswell 2, M. Canals 3, B.J. Todd 4, E.K. Dowdeswell 2, K.A. Hogan 5 L.A. Mayer 6 1 Stockholm University, Sweden
The route towards a new GEBCO grid
 The route towards a new GEBCO grid Pauline Weatherall, GEBCO Digital Atlas Manager British Oceanographic Data Centre (BODC) GEBCO TSCOM/SCRUM meeting, Monaco, October 2012 The route towards a new GEBCO
The Ocean Floor THE VAST WORLD OCEAN
 OCEANOGRAPHY Name Color all water LIGHT BLUE. Color all land LIGHT GREEN. Label the 5 Oceans: Pacific, Atlantic, Indian, Arctic, Antarctic. Label the 7 Continents: N.America, S.America, Europe, Asia, Africa,
Updating the GEBCO Grid
 Updating the GEBCO Grid PAULINE WEATHERALL, GEBCO DIGITAL ATLAS MANAGER, BRITISH OCEANOGRAPHIC DATA CENTRE (BODC), NATIONAL OCEANOGRAPHY CENTRE (NOC), LIVERPOOL, UK. GEBCO TSCOM and SCRUM meeting, Kuala
Unit 6: The Sea Floor
 Unit 6: The Sea Floor Turn to Page 62 in Introduction to the World s Oceans Study the bathymetric chart What features do you see? How do the Atlantic and Pacific Oceans differ? What do you think accounts
Bathymetric data acquisition in Arctic waters
 Bathymetric data acquisition in Arctic waters within the Danish Continental Shelf Project Morten Sølvsten, Uni Bull, Richard Pedersen & Christian Marcussen Arctic-Antarctic Seafloor Mapping Meeting 2011
Map shows 3 main features of ocean floor
 Map shows 3 main features of ocean floor 2017 Pearson Education, Inc. Chapter 3 Marine Provinces 2017 Pearson Education, Inc. 1 Chapter 3 Overview The study of bathymetry determines ocean depths and ocean
Advanced Lecture: Oceanographic regime of the West Antarctic Ice Shelves
 ACDC2010: Ice Sheet - Ocean Interactions 8-19 June 2010, MIT FABLAB, Lyngen, NORWAY Advanced Lecture: Oceanographic regime of the West Antarctic Ice Shelves Adrian Jenkins British Antarctic Survey, Natural
UNDERSEA FEATURE NAME PROPOSAL (Sea NOTE overleaf)
") INTERNATIONAL HYDROGRAPHIC ORGANIZATION INTERGOVERNMENTAL OCEANOGRAPHIC COMMISSION (of UNESCO) UNDERSEA FEATURE NAME PROPOSAL (Sea NOTE overleaf) Note: The boxes will expand as you fill the form. Name
INTERNATIONAL HYDROGRAPHIC ORGANIZATION INTERGOVERNMENTAL OCEANOGRAPHIC COMMISSION (of UNESCO) UNDERSEA FEATURE NAME PROPOSAL (Sea NOTE overleaf) Note: The boxes will expand as you fill the form. Name
The State of the cryosphere
 The State of the cryosphere Course outline Introduction The cryosphere; what is it? The Earth; a unique planet Cryospheric components Classifications Lecture outlines The State of the cryosphere The State
Bathymetry Measures the vertical distance from the ocean surface to mountains, valleys, plains, and other sea floor features
 1 2 3 4 5 6 7 8 9 10 11 CHAPTER 3 Marine Provinces Chapter Overview The study of bathymetry determines ocean depths and ocean floor topography. Echo sounding and satellites are efficient bathymetric tools.
12/11/2013& egm502 seafloor mapping
 egm502 seafloor mapping lecture 13 multi-beam echo-sounders The majority of the current charts of the ocean floors have been produced from single beam echo-sounder data. Even though these data have been
Projection of global and regional sea level change for the 21st century
 Projection of global and regional sea level change for the 21st century Jonathan Gregory 1,2 1 NCAS-Climate, University of Reading 2 Met Office Hadley Centre, Exeter Global mean sea level rise observed
Chapter Overview. Bathymetry. Measuring Bathymetry. Measuring Bathymetry
 CHAPTER 3 Marine Provinces Chapter Overview The study of bathymetry determines ocean depths and ocean floor topography. Echo sounding and satellites are efficient bathymetric tools. Most ocean floor features
Foundations of Earth Science, 6e Lutgens, Tarbuck, & Tasa
 Foundations of Earth Science, 6e Lutgens, Tarbuck, & Tasa Oceans: The Last Frontier Foundations, 6e - Chapter 9 Stan Hatfield Southwestern Illinois College The vast world ocean Earth is often referred
A Factor of 2-4 Improvement in Marine Gravity and Predicted Bathymetry from CryoSat, Jason-1, and Envisat Radar Altimetry: Arctic and Coastal Regions
 DISTRIBUTION STATEMENT A. Approved for public release; distribution is unlimited. A Factor of 2-4 Improvement in Marine Gravity and Predicted Bathymetry from CryoSat, Jason-1, and Envisat Radar Altimetry:
Name Class Date. The ocean floor has varied and distinct surfaces much like those found on land.
 6 Explore the Seafloor BigIdeas The ocean floor has varied and distinct surfaces much like those found on land. Satellites orbiting Earth, as well as sonar technology, are used to map the seafloor. The
Ice Sheets and Sea Level -- Concerns at the Coast (Teachers Guide)
") Ice Sheets and Sea Level -- Concerns at the Coast (Teachers Guide) Roughly 153 million Americans (~53% of the US population) live in coastal counties. World wide some 3 billion people live within 200 km
Ice Sheets and Sea Level -- Concerns at the Coast (Teachers Guide) Roughly 153 million Americans (~53% of the US population) live in coastal counties. World wide some 3 billion people live within 200 km
Oceanography, An Invitation to Marine Science 9e Tom Garrison. Ocean Basins Cengage Learning. All Rights Reserved.
 Oceanography, An Invitation to Marine Science 9e Tom Garrison 4 Ocean Basins Key Concepts Tectonic forces shape the seabed The ocean floor is divided into continental margins and deep ocean basins The
Future Ocean Floor Mapping: Ocean Stewardship & Initial Industry Contributions. U.S Hydro Galveston, TX March 23, 2017 David Millar - Fugro
 Future Ocean Floor Mapping: Ocean Stewardship & Initial Industry Contributions U.S Hydro 2017 - Galveston, TX March 23, 2017 David Millar - Fugro Presentation Outline The Need for Ocean Mapping GEBCO GEBCO
NEW SEAFLOOR INSTALLATIONS REQUIRE ULTRA-HIGH RESOLUTION SURVEYS
 NEW SEAFLOOR INSTALLATIONS REQUIRE ULTRA-HIGH RESOLUTION SURVEYS Donald Hussong (Fugro Seafloor Surveys, Inc.) dhussong@fugro.com Fugro Seafloor Surveys, Inc., 1100 Dexter Avenue North (Suite 100), Seattle,
Ocean Basins, Bathymetry and Sea Levels
 Ocean Basins, Bathymetry and Sea Levels Chapter 4 Please read chapter 5: sediments for next class and start chapter 6 on seawater for Thursday Basic concepts in Chapter 4 Bathymetry the measurement of
Chapter 9 Lecture Outline. Oceans: The Last Frontier
 Chapter 9 Lecture Outline Oceans: The Last Frontier The Vast World Ocean Earth is referred to as the blue planet 71% of Earth s surface is oceans and marginal seas Continents and islands comprise the remaining
High resolution geoid from altimetry & bathymetry: requirements for a future mission
 High resolution geoid from altimetry & bathymetry: requirements for a future mission The GRAL team: J-Y Royer 1,2, M-F Lalancette 3, G Louis 1,2, M Maia 1,2, D Rouxel 3 & L Géli 4 Project funded by 1 2
Proposal for the preparation of a new International Bathymetric Chart of the Southern Ocean (IBCSO) to be presented at the 3 rd HCA Meeting
 to be presented at the 3 rd HCA Meeting") IHO HYDROGRAPHIC COMMITTEE ON ANTARCTICA (HCA) 3rd Meeting, IHB, Monaco, 8-10 September 2003 Dr.-Ing. Hans Werner Schenke Proposal for the preparation of a new International Bathymetric Chart of the Southern
IHO HYDROGRAPHIC COMMITTEE ON ANTARCTICA (HCA) 3rd Meeting, IHB, Monaco, 8-10 September 2003 Dr.-Ing. Hans Werner Schenke Proposal for the preparation of a new International Bathymetric Chart of the Southern
Polar Portal Season Report 2013
 Polar Portal Season Report 2013 All in all, 2013 has been a year with large melting from both the Greenland Ice Sheet and the Arctic sea ice but not nearly as large as the record-setting year of 2012.
ACTIVITY II: THE FATE OF THE LARSEN S, A FAMILY OF ANTARCTIC ICE SHELVES
 ACTIVITY II: THE FATE OF THE LARSEN S, A FAMILY OF ANTARCTIC ICE SHELVES Ice Shelves play a critical role in Antarctica, serving as a buffer between the ocean and the continental ice sheet covering the
UNSTOPPABLE COLLAPSE OF THE WEST ANTARCTIC ICE SHEET IS NOT HAPPENING
 UNSTOPPABLE COLLAPSE OF THE WEST ANTARCTIC ICE SHEET IS NOT HAPPENING Dr. Don J. Easterbrook, Western Washington University, Bellingham, WA May 19, 2014 A New York Times headline reads Scientists Warn
Earth in 2-D, 3-D & 4-D
 Earth in 2-D, 3-D & 4-D We will consider the scientific tools and techniques used to map surface features, reconstruct the layered structure of Earth, and interpret Earth history, including the origin
Changes in bottom morphology of Long Island Sound near Mount Misery Shoal as observed through Repeated Multibeam Surveys
 Changes in bottom morphology of Long Island Sound near Mount Misery Shoal as observed through Repeated Multibeam Surveys Laurie A. Zaleski Laurie.Zaleski@msrc.sunysb.edu Roger D. Flood rflood@notes.cc.sunysb.edu
Oceanography. Oceanography is the study of the deep sea and shallow coastal oceans.
 Oceanography Oceanography is the study of the deep sea and shallow coastal oceans. Studying the Ocean Floor To determine the shape and composition of the ocean floor, scientists use techniques such as
GG710 Remote Sensing in Submarine Environments Sidescan Sonar
 GG710 Remote Sensing in Submarine Environments Sidescan Sonar Harold Edgerton, a professor of electrical engineering at the Massachusetts Institute of Technology, developed sidescan sonar technology for
Increased-resolution Bathymetry in the Southeast Indian Ocean
 ARTICLE MH370 SEARCH DATA Increased-resolution Bathymetry in the Southeast Indian Ocean The disappearance of Malaysian Airlines flight MH370 on 8 March 2014 led to a deep ocean search effort of unprecedented
The Ocean Floor Earth Science, 13e Chapter 13
 The Ocean Floor Earth Science, 13e Chapter 13 Stanley C. Hatfield Southwestern Illinois College The vast world ocean Earth is often referred to as the blue planet Seventy-one percent of Earth s surface
Image Services Providing Access to Scientific Data at NOAA/NCEI
 Image Services Providing Access to Scientific Data at NOAA/NCEI Jesse Varner Cooperative Institute for Research in Environmental Sciences (CIRES), University of Colorado John Cartwright NOAA National Centers
Evidence for Continental Drift and The Theory of Plate Tectonics
 Evidence for Continental Drift and The Theory of Plate Tectonics Did you know that the coal that is mined in Pennsylvania was actually formed from tropical plant life near the Equator? How did it travel
I. Earth s Layers a. Crust: Earth s outside layer. Made of mostly rock. i. Continental: er; made of mostly granite, forms the continents and shallow
 I. Earth s Layers a. Crust: Earth s outside layer. Made of mostly rock. i. Continental: er; made of mostly granite, forms the continents and shallow sea beds, floats! ii. Oceanic: er; dense rock such as
D) 15 N, 160 W A) prevailing wind direction
 15 N, 160 W A) prevailing wind direction") Base your answers to questions 1 and 2 on the diagram below, which represents latitude and longitude lines on Earth. Points A through E represent locations on Earth. Arrows represent direction of rotation.
Base your answers to questions 1 and 2 on the diagram below, which represents latitude and longitude lines on Earth. Points A through E represent locations on Earth. Arrows represent direction of rotation.
8.9A the historical development of evidence that supports plate tectonic theory
 8.9A the historical development of evidence that supports plate tectonic theory Theory of Plate Tectonics the theory that pieces of Earth s lithosphere are in constant motion on the asthenosphere. The
Briefing on the work of GEBCO (GENERAL BATHYMETRIC CHART OF THE OCEANS)
") Briefing on the work of GEBCO (GENERAL BATHYMETRIC CHART OF THE OCEANS) 7th ROPME Sea Area Hydrographic Commission Meeting, Muscat, Oman 20-22 February 2017 What is GEBCO? The General Bathymetric Chart
Briefing on the work of GEBCO (GENERAL BATHYMETRIC CHART OF THE OCEANS) 7th ROPME Sea Area Hydrographic Commission Meeting, Muscat, Oman 20-22 February 2017 What is GEBCO? The General Bathymetric Chart
8.9A - describe the historical development of evidence that supports plate tectonic theory
 8.9A - describe the historical development of evidence that supports plate tectonic theory Theory of Plate Tectonics the theory that pieces of Earth s lithosphere are in constant motion on the asthenosphere.
The World Ocean. Pacific Ocean 181 x 10 6 km 2. Indian Ocean 74 x 10 6 km 2. Atlantic Ocean 106 x 10 6 km 2
 The World Ocean The ocean and adjacent seas cover 70.8% of the surface of Earth, an area of 361,254,000 km 2 Pacific Ocean 181 x 10 6 km 2 Indian Ocean 74 x 10 6 km 2 Atlantic Ocean 106 x 10 6 km 2 Oceanic
How Will Melting Ice Sheets Affect Us?
 PASSAGE 4 How Will Melting Ice Sheets Affect Us? Variation is normal. During the last ice age, for example, ice sheets also covered much of North America and Scandinavia. Why is what s happening now different
Marine Science and Oceanography
 Marine Science and Oceanography Marine geology- study of the ocean floor Physical oceanography- study of waves, currents, and tides Marine biology study of nature and distribution of marine organisms Chemical
SEA ICE AND GLOBAL WARMING
 jkjk SEA ICE AND GLOBAL WARMING Lesson plan for grades K- 3 By: Laura Sanders, Environmental Science Institute, March 2011 Length of lesson: two 30- minute class periods SOURCES AND RESOURCES: Atmospheric
What makes the Arctic hot?
 1/3 total USA UN Environ Prog What makes the Arctic hot? Local communities subsistence Arctic Shipping Routes? Decreasing Ice cover Sept 2007 -ice extent (Pink=1979-2000 mean min) Source: NSIDC Oil/Gas
Challenges of Collecting Data for Article 76 in Ice Covered Waters of the Arctic
 Challenges of Collecting Data for Article 76 in Ice Covered Waters of the Arctic 5 th ABLOS Conference Monaco October 16, 2008 Richard MacDougall - Canada Jacob Verhoef - Canada Wendell Sanford - Canada
OCN 201 Physiography of the Seafloor
 OCN 201 Physiography of the Seafloor Hypsometric Curve for Earth s solid surface Note histogram Hypsometric curve of Earth shows two modes. Hypsometric curve of Venus shows only one! Why? Ocean Depth vs.
Warm Up 1: Ocean Floors LT I can explain the concept of Pangea. I can describe how Ocean Ridges form and give examples of them.
 Warm Up 1: Ocean Floors 4-18-17 LT I can explain the concept of Pangea. I can describe how Ocean Ridges form and give examples of them. Q1. How do we get a diversity of birds? Q2. How did the breeds of
ICE is less dense than water about 92% of the density of water; it floats. This is unlike the behavior of most substances, which generally are denser
 ICE is less dense than water about 92% of the density of water; it floats. This is unlike the behavior of most substances, which generally are denser as solids than as liquids (right). This is a result
Essential Question: How are the geological features that exist on land similar to the geological features on the ocean floor?
 Essential Question: How are the geological features that exist on land similar to the geological features on the ocean floor? Geography of the Oceans The world ocean can be divided into four main ocean
Physical Geography A Living Planet
 Physical Geography A Living Planet The geography and structure of the earth are continually being changed by internal forces, like plate tectonics, and external forces, like the weather. Iguaçu Falls at
After losing huge amount, Greenland ice is melting faster than ever
 After losing huge amount, Greenland ice is melting faster than ever By Washington Post, adapted by Newsela staff on 01.05.16 Word Count 861 A melting iceberg floats along a fjord leading away from the
Fjord Circulation and Thermal Forcing in the Ice-Proximal Region
 Fjord Circulation and Thermal Forcing in the Ice-Proximal Region Saffia Hossainzadeh, Prof. Slawek Tulaczyk, Connor Williams RASM Project Meeting University of Arizona November 14-16, 2012 Introduction
Sea-level change: A scientific and societal challenge for the 21 st century John Church International GNSS Service Workshop, Sydney, Feb 11, 2016
 Sea-level change: A scientific and societal challenge for the 21 st century John Church International GNSS Service Workshop, Sydney, Feb 11, 2016 OCEANS AND ATMOSPHERE NATIONAL RESEARCH FLAGSHIP Our coastal
ARE YOU READY TO THINK? Look at the first slide THINK PAIR SHARE!
 ARE YOU READY TO THINK? Look at the first slide THINK PAIR SHARE! WHAT PROMINENT FEATURE CAN YOU IDENTIFY IN THIS PICTURE? What do you think the different colors represent? Who might find such a picture
LVIS OIB 2012 Antarctica Grid Mapping and Flights
 LVIS OIB 2012 Antarctica Grid Mapping and Flights The following document presents LVIS flight lines and sample plans to be considered for the Fall 2012 Antarctica G- V OIB deployment. LVIS Planning Team:
Global Edited Soundings for Gravity/Bathymetry Calibration
 Global Edited Soundings for Gravity/Bathymetry Calibration David Sandwell, Walter Smith, JJ Becker, Karen Marks, Megan Jones, Adrienne Apacile, Seung-Hee Kim, Scott Nelson Rob Beaman,... Objective - construct
Studying the Ocean Using Live Data
 Studying the Ocean Using Live Data Overview The Argo buoy project is a major oceanographic study that harnesses the power of automated unmanned buoys traveling the world s oceans (http://www.argo.ucsd.edu/).
APPENDIX B PHYSICAL BASELINE STUDY: NORTHEAST BAFFIN BAY 1
 APPENDIX B PHYSICAL BASELINE STUDY: NORTHEAST BAFFIN BAY 1 1 By David B. Fissel, Mar Martínez de Saavedra Álvarez, and Randy C. Kerr, ASL Environmental Sciences Inc. (Feb. 2012) West Greenland Seismic
Established Global bathymetry yproducts. Undersea feature names. Capacity building
 IHO IOC Established 1903 Global bathymetry yproducts Undersea feature names Capacity building A GEBCO data GEBCO s d t sets t and d products d t Global bathymetric grids Global set of bathymetric contours
Topic: Bathymetric Survey Techniques. (a) Single-beam echo-sounders (SBES) (b) Multi-beam echo-sounders (MBES)
 Single-beam echo-sounders (SBES) (b) Multi-beam echo-sounders (MBES)") Topic: Bathymetric Survey Techniques (a) Single-beam echo-sounders (SBES) (b) Multi-beam echo-sounders (MBES) Bathymetry is the measurement of water depths - bathymetry is the underwater equivalent of
Topic: Bathymetric Survey Techniques (a) Single-beam echo-sounders (SBES) (b) Multi-beam echo-sounders (MBES) Bathymetry is the measurement of water depths - bathymetry is the underwater equivalent of
Effect of coastal resolution on global estimates of tidal energy dissipation
 Effect of coastal resolution on global estimates of tidal energy dissipation Maialen Irazoqui Apecechea, Martin Verlaan Contents The GTSMv2.0 model Characteristics Major developments Applications Coastal
Test on Chapters 7-11 Monday, April 28, 2014 No Calculator Required
 Test on Chapters 7-11 Monday, April 28, 2014 No Calculator Required Chapter Sections: Oceans: 7.1 7.2 7.4 Bathymetry: 8.3 Earth s Interior: 10.1 10.2 10.3 Plate Tectonics: 11.1 11.2 11.3 Study/Review:
Figure 1: Two schematic views of the global overturning circulation. The Southern Ocean plays two key roles in the global overturning: (1) the
 the") Figure 1: Two schematic views of the global overturning circulation. The Southern Ocean plays two key roles in the global overturning: (1) the Antarctic Circumpolar Current connects the ocean basins, establishing
Figure 1: Two schematic views of the global overturning circulation. The Southern Ocean plays two key roles in the global overturning: (1) the Antarctic Circumpolar Current connects the ocean basins, establishing
Chapter: Plate Tectonics
 Table of Contents Chapter: Plate Tectonics Section 1: Continental Drift Section 2: Seafloor Spreading Section 3: Theory of Plate Tectonics Continental Drift 1 Evidence for Continental Drift If you look
MARINE GEOLOGY & GEOGRAPHY
 MARINE GEOLOGY & GEOGRAPHY Bathymetry BATHYMETRY BATHYMETRY THE UNDERWATER EQUIVALENT TO TOPOGRAPHY THE STUDY OF WATER DEPTH A BATHYMETRIC MAP SHOWS FLOOR RELIEF OR TERRAIN AS CONTOUR LINES Bathymetry
Where is Earth s Water?
 PASSAGE 1 Where is Earth s Water? Our planet contains a limited amount of water that is always in motion. The water that comes out of your faucet moved through the atmosphere, flowed across Earth s surface,
Variations in valley glacier activity in the Transantarctic Mountains as indicated by associated flow bands in the Ross Ice Shelf*
 Sea Level, Ice, and Climatic Change (Proceedings of the Canberra Symposium, December 1979). IAHS Publ. no. 131. Variations in valley glacier activity in the Transantarctic Mountains as indicated by associated
Plate Tectonics CHAPTER 17
 Plate Tectonics CHAPTER 17 Layers of the Earth A. Crust- solid, 5-70 km thick Moho Two Types of Crust: Oceanic- ocean floor, more dense then because of more iron Continental-dry land (mostly silicates
NASA Images of Antarctica and the Arctic covered in both land and sea ice
 ICE SHELVES ACTIVITY 1: DECODING THE ROLE OF ANTARCTIC ICE IN GLOBAL CLIMATE Ice Shelves play a critical role in Antarctica, serving as a buffer between the ocean and the continental ice sheet covering
Seasonal control of Petermann Gletscher ice-shelf melt by the ocean s response to sea-ice
 1 2 3 4 Seasonal control of Petermann Gletscher ice-shelf melt by the ocean s response to sea-ice cover in Nares Strait E. L. Shroyer 1*, L. Padman 2, R. M. Samelson1, A. Münchow 3, L. A. Stearns 4 1 College
VALIDATION OF TSUNAMI INUNDATION MODELING FOR THE 2004 SUMATRA-ANDAMAN EARTHQUAKE FOR MAKING HAZARD MAPS IN PENANG AND LANGKAWI, MALAYSIA
 Synopses of Master Papers Bulletin of IISEE, 47, 11-16, 013 VALIDATION OF TSUNAMI INUNDATION MODELING FOR THE 004 SUMATRA-ANDAMAN EARTHQUAKE FOR MAKING HAZARD MAPS IN PENANG AND LANGKAWI, MALAYSIA Noor
Swath Mode Altimetry. Noel Gourmelen
 Swath Mode Altimetry Noel Gourmelen 1 Outline Background Impact case studies: Topography Rates of surface elevation change 2 Products and applications of radar altimetry over Ice Sheet, Ice Caps, Glaciers:
BI 101: Marine Biology
 WELCOME BI 101: Marine Biology Contact Info 1. Full Name 2. Student I.D. Number 3. Major 4. Email address 5. Preferred phone contact 6. Have you taken any other BI 101 courses at LBCC? 7. Why did you decide
Buoyant flexure and basal crevassing in dynamic mass loss at Helheim Glacier
 SUPPLEMENTARY INFORMATION DOI: 10.1038/NGEO2204 Buoyant flexure and basal crevassing in dynamic mass loss at Helheim Glacier Timothy D. James*, Tavi Murray, Nick Selmes, Kilian Scharrer and Martin O Leary
Welcome to ATMS 111 Global Warming.
 Welcome to ATMS 111 Global Warming http://www.atmos.washington.edu/2010q1/111 http://cgz.e2bn.net/e2bn/leas/c99/schools/cgz/accounts/staff/rchambers/geobytes/gcse/case%20studies/causes_of_flooding_in_bangladesh.jpg
Activity 3 Arctic Heat Wave?
 Activity 3 Arctic Heat Wave? Forces of Change >> Arctic >> Activity 3 >> Page 1 ACTIVITY 3 ARCTIC HEAT WAVE? THE RATE OF CLIMATE CHANGE Are Ice Caps Melting Faster? From 1979 to 2002, seasonal melting
POLAR I.C.E. (Interactive Climate Education) REMOTE SENSING: USING RADAR TO LOOK THROUGH ICE
 REMOTE SENSING: USING RADAR TO LOOK THROUGH ICE") POLAR I.C.E. (Interactive Climate Education) REMOTE SENSING: USING RADAR TO LOOK THROUGH ICE BUILD A 3D MODEL OF THE LANDSCAPE THAT LIES UNDER THE ICE! INTRODUCTION: It is hard to believe that melting
POLAR I.C.E. (Interactive Climate Education) REMOTE SENSING: USING RADAR TO LOOK THROUGH ICE BUILD A 3D MODEL OF THE LANDSCAPE THAT LIES UNDER THE ICE! INTRODUCTION: It is hard to believe that melting
Hydrosphere The hydrosphere includes all water on Earth.
 Hydrosphere The hydrosphere includes all water on Earth. The abundance of water on Earth is a unique feature that clearly distinguishes our "Blue Planet" from others in the solar system. Not a drop of
Deep-Water Flow over the Lomonosov Ridge in the Arctic Ocean
 AUGUST 2005 N O T E S A N D C O R R E S P O N D E N C E 1489 Deep-Water Flow over the Lomonosov Ridge in the Arctic Ocean M.-L. TIMMERMANS, P. WINSOR, AND J. A. WHITEHEAD Woods Hole Oceanographic Institution,
The surface of the ocean floor is as varied as the land. The five major oceans, from largest to smallest, are
 11.1 Ocean Basins The surface of the ocean floor is as varied as the land. The five major oceans, from largest to smallest, are w the Pacific w the Atlantic w the Indian w the Southern w the Arctic The
Recent developments in multi-beam echo-sounder processing at the Delft
 Recent developments in multi-beam echo-sounder processing at the Delft University of Technology Prof. Dr. Dick G. Simons Acoustic Remote Sensing Group, Faculty of Aerospace Engineering, Delft University
Seafloor Mapping in the High Arctic: The Challenges and the Joys
 Seafloor Mapping in the High Arctic: The Challenges and the Joys Larry Mayer Center for Coastal and Ocean Mapping / NOAA- UNH Joint Hydrographic Center University of New Hampshire, USA Martin Jakobsson
Inversion of tsunami data. A. Sladen CNRS, Géoazur 1/35
 Inversion of tsunami data A. Sladen CNRS, Géoazur 1/35 DEFINITION Tsunami waves are gravity wave with a long period need a BIG source! 2/35 DEFINITION Krakatoa, 1883 Summer 2015, E.T. pers. comm. Lituya
Geography of the world s oceans and major current systems. Lecture 2
 Geography of the world s oceans and major current systems Lecture 2 WHY is the GEOMORPHOLOGY OF THE OCEAN FLOOR important? (in the context of Oceanography) WHY is the GEOMORPHOLOGY OF THE OCEAN FLOOR important?
Watch for Week 8/9 Review Assessment
 Wednesday, October 25, 2017 Exam 2 results, key is posted on the main course website. Please check to make sure there are no errors in the scoring of the Scantron portion of the exam (note the scantron
Earth / Environmental Science. Ch. 14 THE OCEAN FLOOR
 Earth / Environmental Science Ch. 14 THE OCEAN FLOOR The Blue Planet Nearly 70% of the Earth s surface is covered by the global ocean It was not until the 1800s that the ocean became an important focus
THE MEASUREMENT AND ANALYSIS OF BATHYMETRY, MORPHOLOGY, AND SEDIMENT THICKNESS
 THE MEASUREMENT AND ANALYSIS OF BATHYMETRY, MORPHOLOGY, AND SEDIMENT THICKNESS Ron Macnab Geological Survey of Canada (Retired) OUTLINE OF PRESENTATION Principles and practice of: Echo-sounding Seismic
PLATE TECTONICS REVIEW GAME!!!!
 PLATE TECTONICS REVIEW GAME!!!! Name the four layers of the earth - crust - mantle - outer core - inner core Which part of Earth s structure contains tectonic plates? LITHOSPHERE Name one reason why the
Northern European Sea Level Rise. Aslak Grinsted Centre for Ice and Climate Niels Bohr Institute University of Copenhagen
 Northern European Sea Level Rise Aslak Grinsted Centre for Ice and Climate Niels Bohr Institute University of Copenhagen Global Sea Level Rise The world is warming and this causes sea level to rise because:
is a unifying theme in modern geology that integrates the earlier ideas of
 The concept of Global Plate Tectonics is a unifying theme in modern geology that integrates the earlier ideas of continental drift, sea-floor spread, and mountain building To explain why the present ocean
Topography and Bathymetry
 Topography and Bathymetry Overview: Students are introduced to the concepts of bathymetry and topography, and build a model to demonstrate an understanding of both. Targeted Alaska Grade Level Expectations:
PLATE TECTONICS. SECTION 17.1 Drifting Continents
 Date Period Name PLATE TECTONICS SECTION.1 Drifting Continents In your textbook, read about continental drift. Circle the letter of the choice that best completes each statement. 1. Early mapmakers thought
Do Now: Vocabulary: Objectives. Vocabulary: 1/5/2016. Wegener? (Can they move?) the idea that continents have moved over time?
 the idea that continents have moved over time?") Do Now: 1. Who was Alfred Wegener? 2. What was Pangaea? 3. Are continents fixed? (Can they move?) 4. What evidence supports the idea that continents have moved over time? Objectives What evidence suggests
Do Now: 1. Who was Alfred Wegener? 2. What was Pangaea? 3. Are continents fixed? (Can they move?) 4. What evidence supports the idea that continents have moved over time? Objectives What evidence suggests
Lecture Outlines PowerPoint. Chapter 13 Earth Science 11e Tarbuck/Lutgens
 Lecture Outlines PowerPoint Chapter 13 Earth Science 11e Tarbuck/Lutgens 2006 Pearson Prentice Hall This work is protected by United States copyright laws and is provided solely for the use of instructors
FINMARINET: Inventories and Planning for the Marine Natura 2000 Network in Finland. A.2 Geological inventories of the seafloor Final Report
 LIFE07 NAT/FIN/000151 FINMARINET: Inventories and Planning for the Marine Natura 2000 Network in Finland A.2 Geological inventories of the seafloor Final Report Geological Survey of Finland, GTK 1. Introduction
OCN 201 Physiography of the Seafloor
 OCN 201 Physiography of the Seafloor 1 Ocean Depth versus Continental Height Why do we have dry land? Solid surface of Earth is dominated by two levels: Land with a mean elevation of +840 m (29% of Earth