Image Services Providing Access to Scientific Data at NOAA/NCEI
|
|
|
- Jack Stevenson
- 5 years ago
- Views:
Transcription


1 Image Services Providing Access to Scientific Data at NOAA/NCEI Jesse Varner Cooperative Institute for Research in Environmental Sciences (CIRES), University of Colorado John Cartwright NOAA National Centers for Environmental Information (NCEI)
2 NOAA National Centers for Environmental Information (NCEI) NOAA's National Centers for Environmental Information (NCEI) hosts and provides public access to one of the most significant archives for environmental data on Earth. Through the Center for Weather and Climate and the Center for Coasts, Oceans, and Geophysics, we provide over 25 petabytes of comprehensive atmospheric, coastal, oceanic, and geophysical data.
3 Bathymetric Data Multibeam Bathymetric Surveys - ~2600 cruises, 1980-present - Data acquired from U.S. and international government and academic sources - Global coverage, deep-water and coastal NOAA National Ocean Service (NOS) Hydrographic Surveys - Mainly near-shore U.S. coastal waters - High-resolution data (often 1 meter or better) - Used for nautical charting Digital Elevation Models - Combining the best-available topography and bathymetry - Used for tsunami and storm surge modeling
 - GDAL used to create MRF files Add to mosaic dataset - Mosaic: mean of overlapping surveys Calculate footprints Define overviews - Full 3 arcsecond resolution, global")
4 Multibeam Bathymetry Mosaic Raw data is gridded at 3 arcsecond cell size (~90 m) using MB-System Chopped into 10-degree tiles for each survey - ~8700 rasters LERC compression (0.1 m tolerance) - GDAL used to create MRF files Add to mosaic dataset - Mosaic: mean of overlapping surveys Calculate footprints Define overviews - Full 3 arcsecond resolution, global coverage
 ColorHillshade raster function chain for")


5 Multibeam Bathymetry Mosaic By default, provides depth in meters (32-bit floating point) ColorHillshade raster function chain for visualization - Renders elevation using a color map - Combined with grayscale hillshade using pansharpening - No Alteration of Grayscale or Intensity (NAGI) Fusion method - Fill in small gaps with Elevation Void Fill R/V Falkor -- Papahānaumokuākea Marine National Monument

6 Multibeam Bathymetry Mosaic 3 Related Image Services


7 Multibeam Bathymetry Mosaic Coverage
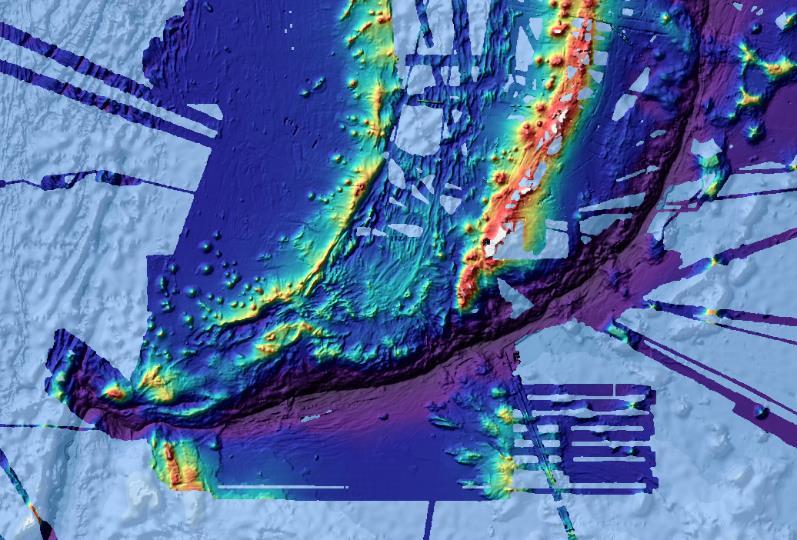


8 Mariana Trench/Guam region Mid-Atlantic Ridge Gulf of Mexico Puerto Rico/Virgin Islands


9 Bathymetric Data Viewer Queries image service to display a single survey Text goes here

 Overlapping, irregular footprints")

10 NOS Hydrographic Surveys BAG Mosaics BAGs: Bathymetric Attributed Grids Near-shore high-res data Wide range of cell sizes (50 cm to 10+ m) Overlapping, irregular footprints For mosaic: higher-res on top of lower To do: prioritize date of survey 4m 2m 1m Combined Together
11 BAG Mosaics Overview Schema Consistently control the visibility scales of overviews and source rasters Source rasters: visible from 0 (fully-zoomed in) to pixel size = 4m Overviews start at 4m threshold - Overview sampling factor 2 (4m, 8m, 16m, 32m, 64m, ) Overviews are defined everywhere, even if that results in up-sampling - Temporarily set lowps=4 for all source rasters, then run Define Overviews
12 BAG Mosaic Visibility Scales

13 Overview Tiles complete coverage within boundary


14 BAG Mosaic Color Hillshade Visualization
 Color Hillshade, Grayscale Hillshade, Slope (numeric), Slope")

15 BAG Mosaic Server-Side Function Templates Default: depth in meters (mean lower-low water) Color Hillshade, Grayscale Hillshade, Slope (numeric), Slope (RGB), Aspect (numeric), Aspect (RGB) Function templates borrowed from Esri s Elevation Services Grayscale Hillshade Color Hillshade Slope RGB Map Aspect RGB Map

16 BAG Mosaic Examples Mattole Canyon, CA

17 BAG Mosaic Examples Coral reefs, Puerto Rico

18 BAG Mosaic Examples Glacier Bay, AK

19 BAG Mosaic Examples Columbia River, WA/OR

20 BAG Mosaic Examples Shipwreck near mouth of Chesapeake Bay
 Used for tsunami and storm surge modeling 3 image services separated by vertical datum: MHW, MHHW,")
21 Digital Elevation Models Combine data from multiple sources (multibeam, hydrographic surveys, lidar, etc.) Used for tsunami and storm surge modeling 3 image services separated by vertical datum: MHW, MHHW, NAVD88
22 DEM Global Mosaic A best-of compilation of DEMs NOAA/NCEI DEMs, along with other regional/global sources (GEBCO_2014, IBCAO (Arctic), IBCSO (Antarctic), Hawaii Multibeam Compilation DEMs are ordered by resolution and date of completion Color Hillshade, Slope, Aspect function chains
23 DMSP Nighttime Lights Defense Meteorological Satellite Program Cloud-free composites from 1992 to 2013 Time-based mosaic dataset 5 complementary image services: - Average visible band - Stable Lights - Cloud-free coverage - Percent lights - Avg lights X pct

24 DMSP Nighttime Lights


25 DMSP Nighttime Lights Demo Animation with Time Slider
 Two nighttime thermal bands")

26 Future Work: VIIRS Imagery Suomi NPP satellite Nightly Imagery from Day/Night Band (DNB) Two nighttime thermal bands Monthly/annual DNB composites Will be served to the public via mosaic datasets and image services Services will automatically update as data arrives
27 Geomagnetic Models EMAG2: Earth Magnetic Anomaly Grid (2 arcminute resolution) Compiled from satellite, ship, and airborned measurements Insight into subsurface structure and composition of Earth s crust Raster data served as an image service
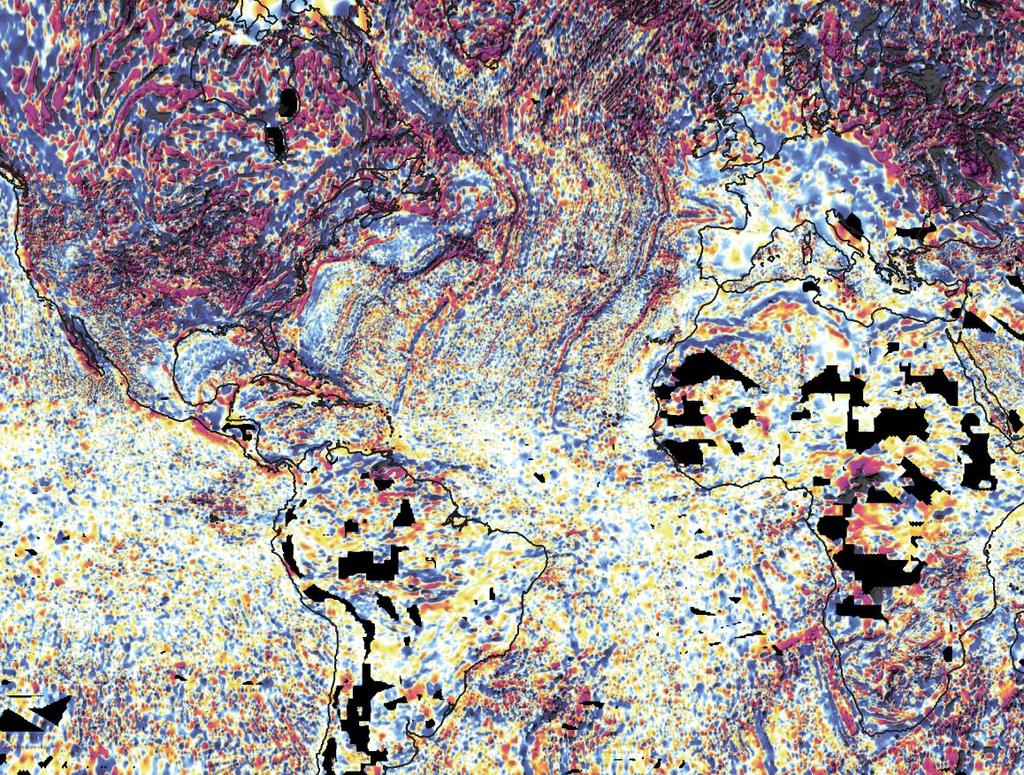
28 EMAG2
29 Geomagnetic Models Future Work Crustal magnetic models - Mix of different resolutions - use mosaic dataset for overlapping data World Magnetic Model - Magnetic declination time-based mosaic dataset

30 AVHRR Pathfinder Sea Surface Temperature Sea Surface Temperature Monthly Averages Demo
31 Thank You! Contacts: Website: NOAA s Geoplatform (ArcGIS Online for Organizations) - Content in NCEI Group: 0b3969ae
An Arctic Perspective NCEI's Prototype Arctic Data Viewer
 An Arctic Perspective NCEI's Prototype Arctic Data Viewer NCEI Arctic Action Team Kate Rose NOAA National Environmental Satellite, Data, and Information Service National Centers for Environmental Information
Digital Elevation Model of Tutuila, American Samoa: Procedures, Data Sources, and Analysis
 Digital Elevation Model of Tutuila, American Samoa: Procedures, Data Sources, and Analysis Prepared for the National Tsunami Hazard Mitigation Program (NTHMP) by the NOAA National Geophysical Data Center
Bathymetry Data and Models: Best Practices
 Bathymetry Data and Models: Best Practices Barry Eakins & Lisa Taylor The NOAA National Geophysical Data Center Over 600 data types - from the core of the Earth to the surface of the Sun NGDC Bathymetry
Updating the GEBCO Grid
 Updating the GEBCO Grid PAULINE WEATHERALL, GEBCO DIGITAL ATLAS MANAGER, BRITISH OCEANOGRAPHIC DATA CENTRE (BODC), NATIONAL OCEANOGRAPHY CENTRE (NOC), LIVERPOOL, UK. GEBCO TSCOM and SCRUM meeting, Kuala
Managing Imagery and Raster Data Using Mosaic Datasets
 Esri International User Conference San Diego, California Technical Workshops July 25, 2012 Managing Imagery and Raster Data Using Mosaic Datasets Hong Xu, Prashant Mangtani Presentation Overview Introduction
Great Lakes Information Network GIS (Queryable by topic, geography, organization, and upload date 73 layers as of October, 2009)
") Google Earth Files for the Great Lakes and Beyond GLOS Mapping Workshop Alpena, Michigan November 9, 2009 David Hart GIS Specialist University of Wisconsin Sea Grant Institute GREAT LAKES Great Lakes Information
Google Earth Files for the Great Lakes and Beyond GLOS Mapping Workshop Alpena, Michigan November 9, 2009 David Hart GIS Specialist University of Wisconsin Sea Grant Institute GREAT LAKES Great Lakes Information
The route towards a new GEBCO grid
 The route towards a new GEBCO grid Pauline Weatherall, GEBCO Digital Atlas Manager British Oceanographic Data Centre (BODC) GEBCO TSCOM/SCRUM meeting, Monaco, October 2012 The route towards a new GEBCO
DATA APPLIANCE FOR ARCGIS
 DATA APPLIANCE FOR ARCGIS Data Appliance for ArcGIS Provides Access to Multi-Scale Basemaps Down to Medium Scale Levels Worldwide And Large Scale for Most of the World The Data Appliance includes Several
NOAA/University of New Hampshire Joint Hydrographic Center & Center for Coastal and Ocean Mapping. MAPPS Summer Conference July 23, 2013
 NOAA/University of New Hampshire Joint Hydrographic Center & Center for Coastal and Ocean Mapping MAPPS Summer Conference July 23, 2013 07/23/2013 2 07/23/2013 3 Center Goals To be a world leader in the
Joint Hydrographic Center, National Oceanic and Atmospheric Administration, Durham, NH 03824, USA
 Future directions in hydrography using satellite-derived bathymetry Shachak Pe eri 1, Christopher Parrish 2, 3, Lee Alexander 1, Chukwuma Azuike 1, Andrew Armstrong 1,3 and Maryellen Sault 2 1 Center for
Working with Elevation Services. Cody Benkelman
 Working with Elevation Services Cody Benkelman Outline ArcGIS Online World Elevation & 3D Elevation Cache for Pro What is included? - Data and Tools How can I use it? - Modes of use - Client Applications
an accessible interface to marine environmental data Russell Moffitt
 an accessible interface to marine environmental data Russell Moffitt The Atlas Project GOAL: To provide a single point of access to oceanographic and environmental data for use by marine resource researchers,
ArcGIS 10.0 Imagery. Joseph B. Bowles
 ArcGIS 10.0 Imagery Joseph B. Bowles Presentation Overview Imagery and raster data What is a mosaic dataset Use of mosaic datasets Build a mosaic dataset Migrate to mosaic datasets Q&A Characteristics
The Looming Threat of Rising Sea Levels to the Florida Keys
 The Looming Threat of Rising Sea Levels to the Florida Keys 1. Introduction Sea levels are rising, and possibly faster than we thought before. In a recent report in 2017 by the National Oceanic and Atmospheric
BECQ 2017 SLR Map Layer Updates: Methodology for Coastal Flood Geoprocessing
 BECQ 2017 SLR Map Layer Updates: Methodology for Coastal Flood Geoprocessing This paper summarizes the local and regional sea level data used to develop coastal flooding scenarios for the island of Saipan,
Pan-Arctic Digital Elevation Map (Pan-Arctic DEM)
") Memorandum to CAFF Board 07/28/2017 BACKGROUND: Pan-Arctic Digital Elevation Map (Pan-Arctic DEM) ArcticDEM is a National Geospatial-Intelligence Agency (NGA)-National Science Foundation (NSF) publicprivate
Memorandum to CAFF Board 07/28/2017 BACKGROUND: Pan-Arctic Digital Elevation Map (Pan-Arctic DEM) ArcticDEM is a National Geospatial-Intelligence Agency (NGA)-National Science Foundation (NSF) publicprivate
Outline. Artificial night lighting as seen from space. Artificial night lighting as seen from space. Applications based on DMSP nighttime lights
 -1 - Outline Satellite observed nighttime lights as an indicator of human induced stress on coral C. Aubrecht, C.D. Elvidge August 22, 2008 Kuffner Observatory Vienna, Austria Artificial night lighting
MARINE GEOLOGY & GEOGRAPHY
 MARINE GEOLOGY & GEOGRAPHY Bathymetry BATHYMETRY BATHYMETRY THE UNDERWATER EQUIVALENT TO TOPOGRAPHY THE STUDY OF WATER DEPTH A BATHYMETRIC MAP SHOWS FLOOR RELIEF OR TERRAIN AS CONTOUR LINES Bathymetry
Add NOAA nowcoast Layers to Maps
 WebEOC Maps Add-on Quick Reference Guide Add NOAA nowcoast Layers to Maps Overview With Maps Add-on, you can configure an unlimited number of map layers. These layers allow you to control the data you
Understanding elevation and derivative layers
 Understanding elevation and derivative layers ArcGIS makes it easy to work with elevation data by offering a dynamic world elevation service (TopoBathy) and a specific land elevation (Terrain). These services
Modeling Storm Surge for Emergency Management
 Modeling Storm Surge for Emergency Management Study Area: Guam is the southern-most island of the Mariana Archipelago and is located at 13 28 N, 144 47 E. It has a total area of 541.3 sq. km. and the highest
Bathymetric Attributed Grids (BAGs): Discovery of Marine Datasets and Geospatial Metadata Visualization
: Discovery of Marine Datasets and Geospatial Metadata Visualization") University of New Hampshire University of New Hampshire Scholars' Repository Center for Coastal and Ocean Mapping Center for Coastal and Ocean Mapping 2010 Bathymetric Attributed Grids (BAGs): Discovery
University of New Hampshire University of New Hampshire Scholars' Repository Center for Coastal and Ocean Mapping Center for Coastal and Ocean Mapping 2010 Bathymetric Attributed Grids (BAGs): Discovery
Intelligent Marine and Coastal Mapping Data
 O Intelligent Marine and Coastal Mapping Data When you need mapping data that is fit for purpose, in the right format, accurate and up to date Marine Themes Vector Marine Themes DEM Raster Charts XL Electronic
The Index to Marine and Lacustrine Geological Samples
 The Index to Marine and Lacustrine Geological Samples Community access to common information on sample collections Kelly J. Stroker 1, Jennifer Jencks 2 1 Cooperative Institute for Research in Environmental
MARINE GEOLOGY & GEOGRAPHY
 MARINE GEOLOGY MARINE GEOLOGY & GEOGRAPHY Marine Geology 4 LAYERS OF THE EARTH CRUST THICKNESS: VARIES BETWEEN OCEAN & CONTINENTS 5-40 KM STATE: SOLID ELEMENTS: SILICON, ALUMINUM, CALCIUM, SODIUM, POTASSIUM
EnvSci 360 Computer and Analytical Cartography
 EnvSci 360 Computer and Analytical Cartography Lecture 7 Mapping Images, Surfaces, and 3-D Data Brief Overview of Imagery What is Imagery? A spatial data model that defines space as an array of equally
Future Ocean Floor Mapping: Ocean Stewardship & Initial Industry Contributions. U.S Hydro Galveston, TX March 23, 2017 David Millar - Fugro
 Future Ocean Floor Mapping: Ocean Stewardship & Initial Industry Contributions U.S Hydro 2017 - Galveston, TX March 23, 2017 David Millar - Fugro Presentation Outline The Need for Ocean Mapping GEBCO GEBCO
Monitoring Near-Shore Bathymetry Using a Multi- Image Satellite-Derived Bathymetry Approach
 University of New Hampshire University of New Hampshire Scholars' Repository Center for Coastal and Ocean Mapping Center for Coastal and Ocean Mapping 3-2015 Monitoring Near-Shore Bathymetry Using a Multi-
Assessing Sounding Density for a Seabed 2030 Initiative
 Assessing Sounding Density for a Seabed 2030 Initiative Meredith Westington 1, Jesse Varner 2, Paul Johnson 3, Mike Sutherland 2, Andrew Armstrong 1, Jennifer Jencks 4 1- National Oceanic and Atmospheric
ArcGIS Data Models: Raster Data Models. Jason Willison, Simon Woo, Qian Liu (Team Raster, ESRI Software Products)
") ArcGIS Data Models: Raster Data Models Jason Willison, Simon Woo, Qian Liu (Team Raster, ESRI Software Products) Overview of Session Raster Data Model Context Example Raster Data Models Important Raster
ArcGIS Data Models: Raster Data Models Jason Willison, Simon Woo, Qian Liu (Team Raster, ESRI Software Products) Overview of Session Raster Data Model Context Example Raster Data Models Important Raster
Question: What is the primary reason for the great abundance of fish along the Peruvian coast?
 Buzzer Question # 1 Question Type: toss-up Question Format: Multiple Choice Category: Biology What is the primary reason for the great abundance of fish along the Peruvian coast? Answer W: upwelling Answer
Supplement of Scenario-based numerical modelling and the palaeo-historic record of tsunamis in Wallis and Futuna, Southwest Pacific
 Supplement of Nat. Hazards Earth Syst. Sci., 15, 1763 1784, 2015 http://www.nat-hazards-earth-syst-sci.net/15/1763/2015/ doi:10.5194/nhess-15-1763-2015-supplement Author(s) 2015. CC Attribution 3.0 License.
The MSC Beaufort Wind and Wave Reanalysis
 The MSC Beaufort Wind and Wave Reanalysis Val Swail Environment Canada Vincent Cardone, Brian Callahan, Mike Ferguson, Dan Gummer and Andrew Cox Oceanweather Inc. Cos Cob, CT, USA Introduction: History
Digital Elevation Model (DEM) of Sable Island Bank and adjacent areas
 of Sable Island Bank and adjacent areas") GEOLOGICAL SURVEY OF CANADA OPEN FILE 5348 Digital Elevation Model (DEM) of Sable Island Bank and adjacent areas K.J. Webb and E.L. King 2014 GEOLOGICAL SURVEY OF CANADA OPEN FILE 5348 Digital Elevation
GEOLOGICAL SURVEY OF CANADA OPEN FILE 5348 Digital Elevation Model (DEM) of Sable Island Bank and adjacent areas K.J. Webb and E.L. King 2014 GEOLOGICAL SURVEY OF CANADA OPEN FILE 5348 Digital Elevation
GEBCO 2013 TSCOM. EMODNET Hydrography status report
 www.emodnet-hydrography.eu GEBCO 2013 TSCOM EMODNET Hydrography status report Eric Moussat, Ifremer on behalf of the Emodnet consortium 1 Background and objectives EU proposed to take steps in 2008 towards
NEW TOOLS TO IMPROVE DESKTOP SURVEYS
 NEW TOOLS TO IMPROVE DESKTOP SURVEYS Pablo Vengoechea (Telemediciones S.A.), Jorge O. García (Telemediciones S.A.), Email: Telemediciones S.A. / Cra. 46 94-17 Bogotá D.C.
Creating a Bathymetric Database & Datum Conversion
 Creating a Bathymetric Database & Datum Conversion Mitchell Brown Civil Engineering Technician Mitchell.E.Brown@erdc.dren.mil June 11, 2012 US Army Corps of Engineers BUILDING STRONG Introduction to Bathymetric
Activity 2.2: Recognizing Change (Observation vs. Inference)
") Activity 2.2: Recognizing Change (Observation vs. Inference) Teacher Notes: Evidence for Climate Change PowerPoint Slide 1 Slide 2 Introduction Image 1 (Namib Desert, Namibia) The sun is on the horizon
Activity 2.2: Recognizing Change (Observation vs. Inference) Teacher Notes: Evidence for Climate Change PowerPoint Slide 1 Slide 2 Introduction Image 1 (Namib Desert, Namibia) The sun is on the horizon
Positioning the Pacific: NOAA s Geospatial Activities. Juliana Blackwell, Director NOAA s National Geodetic Survey March 6, 2012
 Positioning the Pacific: NOAA s Geospatial Activities Juliana Blackwell, Director NOAA s National Geodetic Survey March 6, 2012 A Common Problem of the Early 19 th Century 1807 President Thomas Jefferson
Direct Readout at the Meteorological Service of Canada
 Direct Readout at the Meteorological Service of Canada CSPP Users Meeting 2015 Darmstadt, Germany April 14-16, 2015 David Bradley Manager, Earth Observation and Geomatics Meteorological Service of Canada
6 - STORM SURGES IN PUERTO RICO_Power Plants-Aguirre. Aguirre
 1 6 - STORM SURGES IN PUERTO RICO_Power Plants-Aguirre Aguirre Figure 1 shows a GE image of the Aguirre Electric Power Plant inside Jobos Bay. Figure 2 shows a picture of the plant looking at base level
Preliminary Data Release for the Humboldt Bay Sea Level Rise Vulnerability Assessment: Humboldt Bay Sea Level Rise Inundation Mapping
 Preliminary Data Release for the Humboldt Bay Sea Level Rise Vulnerability Assessment: Humboldt Bay Sea Level Rise Inundation Mapping Prepared by: Jeff Anderson, Northern Hydrology & Engineering (jeff@northernhydrology.com)
Working with Elevation Data Using Mosaic Datasets & Image Services. Peter Becker
 Working with Elevation Data Using Mosaic Datasets & Image Services Peter Becker OUTLINE Uses or Elevation data Requirements ArcGIS 10 capabilities - Mosaic Datasets - ArcGIS Server Best Practices Worklow
Lecture 6 - Raster Data Model & GIS File Organization
 Lecture 6 - Raster Data Model & GIS File Organization I. Overview of Raster Data Model Raster data models define objects in a fixed manner see Figure 1. Each grid cell has fixed size (resolution). The
Seabed 2030: A Call to Action
 Seabed 2030: A Call to Action Rear Adm. Shepard Smith NOAA Office of Coast Survey shep.smith@noaa.gov Introduction Many people like me start speeches about mapping the ocean with we know more about the
1. Name at least one place that the mid-atlantic Ridge is exposed above sea level.
 Interpreting Tectonic and Bathymetric Maps. The purpose of this lab is to provide experience interpreting the bathymetry of the seafloor in terms of tectonic and geologic settings and processes. Use the
Figure 3.1: Illustration showing the bathymetry s role for the tsunami propagation following the earth quake 26 December 2004 outside of Sumatra.
 Figure 3.1: Illustration showing the bathymetry s role for the tsunami propagation following the earth quake 26 December 2004 outside of Sumatra. The left globe shows the seafloor bathymetry as portrayed
Your web browser (Safari 7) is out of date. For more security, comfort and the best experience on this site: Update your browser Ignore
 is out of date. For more security, comfort and the best experience on this site: Update your browser Ignore") Your web browser (Safari 7) is out of date. For more security, comfort and the best experience on this site: Update your browser Ignore BATHYMETRY For the complete encyclopedic entry with media resources,
Your web browser (Safari 7) is out of date. For more security, comfort and the best experience on this site: Update your browser Ignore BATHYMETRY For the complete encyclopedic entry with media resources,
Effects of Rising Sea Levels on Coral Reef and Mangrove Distributions along the Great Barrier Reef in Australia
 Effects of Rising Sea Levels on Coral Reef and Mangrove Distributions along the Great Barrier Reef in Australia Sarah Barfield Graduate Student Department of Integrative Biology University of Texas, Austin
Established Global bathymetry yproducts. Undersea feature names. Capacity building
 IHO IOC Established 1903 Global bathymetry yproducts Undersea feature names Capacity building A GEBCO data GEBCO s d t sets t and d products d t Global bathymetric grids Global set of bathymetric contours
ISU GIS CENTER S ARCSDE USER'S GUIDE AND DATA CATALOG
 ISU GIS CENTER S ARCSDE USER'S GUIDE AND DATA CATALOG 2 TABLE OF CONTENTS 1) INTRODUCTION TO ARCSDE............. 3 2) CONNECTING TO ARCSDE.............. 5 3) ARCSDE LAYERS...................... 9 4) LAYER
Bathymetry. EMODnet Stakeholder Conference & Sea-basin Workshops February Bathymetry
 EMODnet Stakeholder Conference & Sea-basin Workshops 14-15 February 2017 Arctic checkpoint Belinda Kater On behalf of all Checkpoints http://www.emodnet.eu 1 ? is the study of the "beds" or "floors" of
Use of Elevation Data in NOAA Coastal Mapping Shoreline Products. Coastal GeoTools April 1, 2015
 Use of Elevation Data in NOAA Coastal Mapping Shoreline Products Coastal GeoTools April 1, 2015 - NOAA s Coastal Mapping Program & CUSP - Shoreline Uses, Delineation Issues, Definitions - Current Extraction
FINMARINET: Inventories and Planning for the Marine Natura 2000 Network in Finland. A.2 Geological inventories of the seafloor Final Report
 LIFE07 NAT/FIN/000151 FINMARINET: Inventories and Planning for the Marine Natura 2000 Network in Finland A.2 Geological inventories of the seafloor Final Report Geological Survey of Finland, GTK 1. Introduction
Initiatives in Using Crowdsourcing, Satellite Derived Bathymetry, and Other Non-Traditional Hydrographic/Bathymetric Measurements
 University of New Hampshire University of New Hampshire Scholars' Repository Center for Coastal and Ocean Mapping Center for Coastal and Ocean Mapping 10-5-2015 Initiatives in Using Crowdsourcing, Satellite
Reprint of article that appeared in Hydro INTERNATIONAL November 2006 Volume 10 Issue 9
 Reprint of article that appeared in Hydro INTERNATIONAL November 2006 Volume 10 Issue 9 While Google Earth is the best known 3D web-mapping viewer currently in the public domain, there are alternative
ELEVATION. The Base Map
 ELEVATION The Base Map Basic Elevation Types: Points X, Y, Z Irregular distribution Cumbersome Typical sources Lidar Stereo photography Ground survey ASCII, LAS formats Basic Elevation Types: Contour Lines
Location: Jacksonville, FL December 11, 2012
 Technical Update Meeting Northeast Florida Surge Study Location: Jacksonville, FL December 11, 2012 Agenda 2:00 2:15 Welcome/Introductions Tucker Mahoney, FEMA Region IV Michael DelCharco, BakerAECOM 2:15
Measuring earthquake-generated surface offsets from high-resolution digital topography
 Measuring earthquake-generated surface offsets from high-resolution digital topography July 19, 2011 David E. Haddad david.e.haddad@asu.edu Active Tectonics, Quantitative Structural Geology, and Geomorphology
Billions of measurements for millions of square kilometres
 Billions of measurements for millions of square kilometres Dr. Mathias Jonas Secretary-General of the : History and Constitution 2 1 All waters on earth 3 20 th Century idea: GEBCO General bathymetric
EMODnet High Resolution Seabed Mapping - further developing and providing a high resolution digital bathymetry for European seas
 EMODnet High Resolution Seabed Mapping - further developing and providing a high resolution digital bathymetry for European seas EGU Fall 2017 meeting New Orleans USA, December 2017 Schaap Dick MARIS,
Coast Survey Providing Improved Access to Maritime Navigation Products and Services
 Coast Survey Providing Improved Access to Maritime Navigation Products and Services Kurt A. Nelson, Branch Chief CGTP Leland Snyder, Branch Chief FADS Office of Coast Survey Agenda Current Coast Survey
Coastal Emergency Risks Assessment - CERA Real-Time Storm Surge and Wave Visualization Tool
 Coastal Emergency Risks Assessment - CERA Real-Time Storm Surge and Wave Visualization Tool Introduction This document provides guidance for using the Coastal Emergency Risks Assessment (CERA) visualization
What is so great about nighttime VIIRS data for the detection and characterization of combustion sources?
 Proceedings of the Asia-Pacific Advanced Network 2013 v. 35, p. 33-48. http://dx.doi.org/10.7125/apan.35.5 ISSN 2227-3026 What is so great about nighttime VIIRS data for the detection and characterization
Condensing Massive Satellite Datasets For Rapid Interactive Analysis
 Condensing Massive Satellite Datasets For Rapid Interactive Analysis Glenn Grant University of Colorado, Boulder With: David Gallaher 1,2, Qin Lv 1, G. Campbell 2, Cathy Fowler 2, Qi Liu 1, Chao Chen 1,
Updating the GEBCO_08 Grid with regional compilations and surveys
 Updating the GEBCO_08 Grid with regional compilations and surveys Pauline Weatherall, GEBCO Digital Atlas Manager, British Oceanographic Data Centre (BODC) GEBCO TSCOM/iSCRUM meeting, SIO, October 2011
Sea Level Rise in Connecticut A Risk-Informed Approach
 GZA GeoEnvironmental, Inc. CAFM Conference October 25, 2017 Proactive By Design. Our Company Commitment Proactive By Design. Our Company Commitment Sea Level Rise in Connecticut A Risk-Informed Approach
Chapter Overview. Bathymetry. Measuring Bathymetry. Measuring Bathymetry
 CHAPTER 3 Marine Provinces Chapter Overview The study of bathymetry determines ocean depths and ocean floor topography. Echo sounding and satellites are efficient bathymetric tools. Most ocean floor features
Map shows 3 main features of ocean floor
 Map shows 3 main features of ocean floor 2017 Pearson Education, Inc. Chapter 3 Marine Provinces 2017 Pearson Education, Inc. 1 Chapter 3 Overview The study of bathymetry determines ocean depths and ocean
Convective downbursts are known to produce potentially hazardous weather
 Investigation of Convective Downburst Hazards to Marine Transportation Mason, Derek Thomas Jefferson High School for Science and Technology Alexandria, VA Abstract Convective downbursts are known to produce
SCAR Expert Group on IBCSO Report to GSSG
 SCAR Expert Group on IBCSO Report to GSSG Hans Werner Schenke, AWI Norbert Ott, AWI 12/16/2008 IBCSO Report to HCA-8 Niterói, 1 Content 1. Retrospect 2. Framework 3. Objectives 4. Report on IBCSO Progress
- West Africa. Abuja, Nigeria May Fredericton Canada Heeswijk The Netherlands Washington DC United States Adelaide Australia
 A Case Study in Land and Sea Data Interoperability Patricia GASPAR(Netherlands), Andrew HOGGARTH(Canade), Gordon JOHNSTON(UK), Charles de JONG(Netherlands) - West Africa Abuja, Nigeria - 6-10 May 2013
Living Atlas: Road Ahead. Deane Kensok Sean Breyer
 Living Atlas: Road Ahead Deane Kensok Sean Breyer Workshop Agenda Subhead Here Overview of the Living Atlas Esri Content Portfolio - Overview - Road Map for 2017 and Beyond - Demos: Previews of Online
Storm Surge Analysis Update Meeting Cross City, Florida June 17, 2014
 Big Bend Coastal Storm Surge Study Storm Surge Analysis Update Meeting Cross City, Florida June 17, 2014 Introductions Risk MAP Project Team FEMA Region IV Florida Division of Emergency Management (FDEM)
Effect of coastal resolution on global estimates of tidal energy dissipation
 Effect of coastal resolution on global estimates of tidal energy dissipation Maialen Irazoqui Apecechea, Martin Verlaan Contents The GTSMv2.0 model Characteristics Major developments Applications Coastal
Appendix I: Geographic Information System Data Sources
 Appendix I: Geographic Information System Data Sources Draft Environmental Impact Statement/Overseas Environmental Impact Statement Hawaii-Southern California Training and Testing TABLE OF CONTENTS...
Introduction. Elevation Data Strategy. Status and Next Steps
 1 2 Introduction Elevation Data Strategy Status and Next Steps 3 Canada is the 2nd largest country in the world - 9.9 million sq km Surrounded by 3 oceans with 202 000 km of coastline Population over 35
Digital Elevation Models (DEM)
") Digital Elevation Models (DEM) Digital representation of the terrain surface enable 2.5 / 3D views Rule #1: they are models, not reality Rule #2: they always include some errors (subject to scale and data
Digital Elevation Models (DEM) Digital representation of the terrain surface enable 2.5 / 3D views Rule #1: they are models, not reality Rule #2: they always include some errors (subject to scale and data
Access to IOOS Data Relevant to OOI. Kathleen Bailey NOAA/NOS/IOOS January 6, 2016
 Access to IOOS Data Relevant to OOI Kathleen Bailey NOAA/NOS/IOOS January 6, 2016 The U.S. Integrated Ocean Observing System (IOOS) Federal Regional Satellites 600+: Buoys, Water Level stations, Coastal
Mapping Undersea Feature Names in S-100. UFNPT at SCUFN 31 Wellington, New Zealand October, 2018
 Mapping Undersea Feature Names in S-100 UFNPT at SCUFN 31 Wellington, New Zealand October, 2018 Content - Update about UFNPT - Discovery of Undersea Features - excercise Work Plan of the UFNPT November
The Use of Geographic Information Systems to Assess Change in Salt Marsh Ecosystems Under Rising Sea Level Scenarios.
 The Use of Geographic Information Systems to Assess Change in Salt Marsh Ecosystems Under Rising Sea Level Scenarios Robert Hancock The ecological challenges presented by global climate change are vast,
Bathymetry Measures the vertical distance from the ocean surface to mountains, valleys, plains, and other sea floor features
 1 2 3 4 5 6 7 8 9 10 11 CHAPTER 3 Marine Provinces Chapter Overview The study of bathymetry determines ocean depths and ocean floor topography. Echo sounding and satellites are efficient bathymetric tools.
Design and Implementation of a NOAA/NOS Cook Inlet and Shelikof Straits Circulation Modeling System
 Design and Implementation of a NOAA/NOS Cook Inlet and Shelikof Straits Circulation Modeling System Presented at a NOAA/AEA Stakeholders Meeting, August 24, 2011, Anchorage Alaska Richard Patchen and Lyon
EMERGENCY PLANNING IN NORTHERN ALGERIA BASED ON REMOTE SENSING DATA IN RESPECT TO TSUNAMI HAZARD PREPAREDNESS
 EMERGENCY PLANNING IN NORTHERN ALGERIA BASED ON REMOTE SENSING DATA IN RESPECT TO TSUNAMI HAZARD PREPAREDNESS Barbara Theilen-Willige Technical University of Berlin, Institute of Applied Geosciences Department
Liana Talaue McManus. Division of Marine Affairs and Policy Rosenstiel School of Marine & Atmospheric Science University of Miami
 Liana Talaue McManus Division of Marine Affairs and Policy Rosenstiel School of Marine & Atmospheric Science University of Miami Outline 1. Coasts as vulnerable & resilient social ecological systems 2.
Hindcast Arabian Gulf
 Hindcast Arabian Gulf Image of isobars of atmospheric pressure and hindcast wind- and wave field over the Arabian Gulf during a storm in January 1993. Detailed wave studies are supported by nesting of
D) 15 N, 160 W A) prevailing wind direction
 15 N, 160 W A) prevailing wind direction") Base your answers to questions 1 and 2 on the diagram below, which represents latitude and longitude lines on Earth. Points A through E represent locations on Earth. Arrows represent direction of rotation.
Base your answers to questions 1 and 2 on the diagram below, which represents latitude and longitude lines on Earth. Points A through E represent locations on Earth. Arrows represent direction of rotation.
NESDIS Polar (Region) Products and Plans. Jeff Key NOAA/NESDIS Madison, Wisconsin USA
 Products and Plans. Jeff Key NOAA/NESDIS Madison, Wisconsin USA") NESDIS Polar (Region) Products and Plans Jeff Key NOAA/NESDIS Madison, Wisconsin USA WMO Polar Space Task Group, 2 nd meeting, Geneva, 12 14 June 2012 Relevant Missions and Products GOES R ABI Fractional
NESDIS Polar (Region) Products and Plans Jeff Key NOAA/NESDIS Madison, Wisconsin USA WMO Polar Space Task Group, 2 nd meeting, Geneva, 12 14 June 2012 Relevant Missions and Products GOES R ABI Fractional
Planning for Annapolis Sea Level Rise and Future Extreme Water Levels
 Planning for Annapolis Sea Level Rise and Future Extreme Water Levels U.S. Naval Academy Sea Level Rise Advisory Council 31 October 2017 CAPT Emil Petruncio, USN (Ret.), PhD Associate Professor Gina Henderson
Earth Observation in coastal zone MetOcean design criteria
 ESA Oil & Gas Workshop 2010 Earth Observation in coastal zone MetOcean design criteria Cees de Valk BMT ARGOSS Wind, wave and current design criteria geophysical process uncertainty modelling assumptions
SW Florida Escarpment Mapping Area
 Overview NOAA s Okeanos Explorer (EX) Program plans to conduct systematic mapping and telepresence-enabled ROV explorations in the Gulf of Mexico during Spring 2014. In 2011, the EX conducted mapping operations
Figure 3.1: Illustration showing the bathymetry s role for the tsunami propagation following the earth quake 26 December 2004 outside of Sumatra.
 Figure 3.1: Illustration showing the bathymetry s role for the tsunami propagation following the earth quake 26 December 2004 outside of Sumatra. The left globe shows the seafloor bathymetry as portrayed
What is CERA? Coastal Emergency Risks Assessment
 What is CERA? Coastal Emergency Risks Assessment Visualization tool using OGC standards Displays the outputs from the ADCIRC storm surge model or other coastal models Represents the maps on interactive
Effects of Sea Level Rise in Florida
 Abstract International Research Journal of Earth Sciences ISSN 2321 2527 Int. Res.J. Earth Sci. Effects of Sea Level Rise in Florida Praveen Khanna, Udaya Kumar and Riyaz Ahamed Osankhan Department of
Why Hydrological Services are Important to Business
 Why Hydrological Services are Important to Business Dr. David Green Program Manager, Disasters Earth Science Division David.s.green@nasa.gov May 8, 2018 2 Communities and Areas of Intensive Risk Socio-Economic
Briefing on the work of GEBCO (GENERAL BATHYMETRIC CHART OF THE OCEANS)
") Briefing on the work of GEBCO (GENERAL BATHYMETRIC CHART OF THE OCEANS) 7th ROPME Sea Area Hydrographic Commission Meeting, Muscat, Oman 20-22 February 2017 What is GEBCO? The General Bathymetric Chart
Briefing on the work of GEBCO (GENERAL BATHYMETRIC CHART OF THE OCEANS) 7th ROPME Sea Area Hydrographic Commission Meeting, Muscat, Oman 20-22 February 2017 What is GEBCO? The General Bathymetric Chart
Modeling Coastal Change Using GIS Technology
 Emily Scott NRS 509 Final Report December 5, 2013 Modeling Coastal Change Using GIS Technology In the past few decades, coastal communities around the world are being threatened by accelerating rates of
OCEANOGRAPHIC DATA MANAGEMENT
 OCEANOGRAPHIC DATA MANAGEMENT Presented to: Environmental Disaster Data Management Meeting Russ Beard Director, National Coastal Data Development Center Interim Science Coordinator, Gulf Restoration Council
Evaluation of Storm Tide Measurements at Panama City Beach, FL
 Evaluation of Storm Tide Measurements at Panama City Beach, FL 1993-2007 Prepared by Mark E. Leadon Beaches and Shores Resource Center Florida State University May 2009 Prepared for Florida Department
Passive Microwave Sea Ice Concentration Climate Data Record
 Passive Microwave Sea Ice Concentration Climate Data Record 1. Intent of This Document and POC 1a) This document is intended for users who wish to compare satellite derived observations with climate model