Effect of coastal resolution on global estimates of tidal energy dissipation
|
|
|
- Iris Sherman
- 5 years ago
- Views:
Transcription


1 Effect of coastal resolution on global estimates of tidal energy dissipation Maialen Irazoqui Apecechea, Martin Verlaan
2 Contents The GTSMv2.0 model Characteristics Major developments Applications Coastal resolution Are tidal dynamics represented with 5km? Further refinement globally Further refinement locally Results: Convergence of dissipation estimates Conclusions Future work

 TGF driven, no assimilation Runtimes in 8")
 ~ 7 cm in deep waters (FES2012) Surge Validation: A")
3 The GTSMv2.0 model Global Tide Surge Model: 2D barotropic model Unstructured global grid: 50 km deep waters, 5km at the coast (~4M nodes) GEBCO 2014 bathymetry (~1km) TGF driven, no assimilation Runtimes in 8 cores ~1hour/week Tidal Validation/Verification: ~20cm for coastal stations (UHSLC) ~ 7 cm in deep waters (FES2012) Surge Validation: A global reanalysis of storm surges and extreme sea levels(muis et al. 2016)

4 The GTSMv2.0 model - Major developments Self Attraction and Loading effect Reduction of errors in tidal representation of ~50 % in coastal stations and ~60% in deep waters Minimal increase of computational time (<3%) Barotropic tidal energy dissipation through generation of internal tides Dominant in deep waters (1TW out of 3.5TW) τ II = Cρκ 1 N u Dissipation =f (Stratification, bathymetry gradient, cross-slope flow) Mid-ocean ridges and trenches (e.g. Mid-Atlantic Ridge) Continental shelves (e.g. Bay of Biscay) Island chains (e.g. Hawaiian Ridge) Both physical processes are key to obtain good tidal propagation results

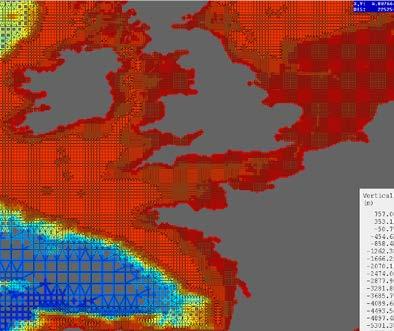
5 Grid Bathymetry gradient based refinement:

 Boundary conditions for regional models/ Ready-to-go regional models Surface currents")
6 The GTSMv2.0 model - Applications Widely used for research (e.g. TC induced surge, global reanalysis of extreme sea levels) Bathymetry/Geodesy (e.g. altimeter data reduction, vertical reference planes/geoid) Boundary conditions for regional models/ Ready-to-go regional models Surface currents Prediction tool for the Dutch team in the Volvo Ocean Race Climate change studies using climate models (e.g. EC-Earth) Operational forecasting - GLOSSIS
 4 times a day,")


7 GLOSSIS SARIKA (Oct 2016) 4 times a day, 10 day forecast NOAA GFS (3h time-step, 10 day forecast) DIVA segments, near real-time IOC and satellite data Threshold defined based on return periods for high-water
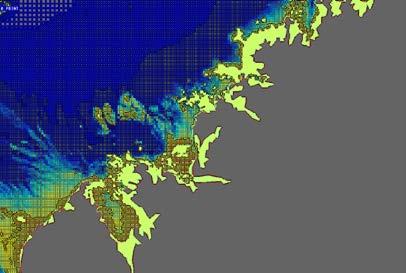
 influences amphidromic point locations")
8 Today: Coastal resolution study Coastal resolution Are tidal dynamics represented with 5km grid size? Highest resolution in existing Global Tide Models is 6-7km Propagation speed depends on bathymetry Dissipation through bottom friction (shallow waters) influences amphidromic point locations Experiments Higher coastal resolution: 2.5km and 1.25km worldwide (9M nodes!) Local to remote impacts: 0.6 and 0.3km in Australia (10.5M nodes..!) Look at sensitivity in terms of tidal dissipation: defined areas around the globe (Egbert and Ray, 2001) + above ±66 lat estimates Bottom friction dissipation: 1-29 coastal areas (plus high latitudes = 31 areas) Internal tides dissipation : A-I deep ocean areas (note: quite large areas)


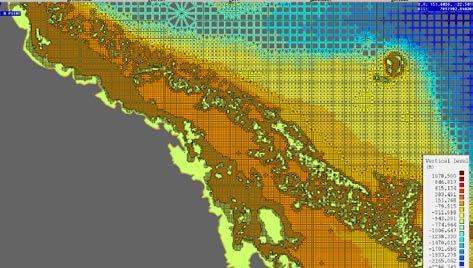
9 Increased grid resolution
 0.6km and 0.3km coastal resolutions in Australia show no meaningful impact globally or locally (boring! but relieving) Polar latitude areas non-negligible (~7%) Literature ~2.")
10 Results Bottom friction dissipation areas Total 1.25km = 99% of 2.55TW Big differences from 5km to 2.5km in many places and globally (2.76 to 2.55TW). 1.25km shows differences locally (2.6 to 2.55TW) 0.6km and 0.3km coastal resolutions in Australia show no meaningful impact globally or locally (boring! but relieving) Polar latitude areas non-negligible (~7%) Literature ~2.5TW


11 Results Bottom friction dissipation areas West Coast North America, Hudson Bay, European Shelf, Arctic Common features? High latitudes, connection to Arctic Narrow passages and connections potentially affected by resolution Indirect effect of non-converged internal tides dissipation areas: Explore more in detail.
. 0.6km and 0.")
12 Results Internal tides dissipation Total 1.25km = 41% of 1TW Missing half of the dissipation of the domain, difficult to identify sources Big differences from 5km through to 1.25km in the two main areas and globally (1.52 to 1TW). 0.6km and 0.3km coastal resolutions in Australia show no meaningful impact again (no higher resolution in deeper parts) Non-converged areas: Several island chains affected by the coastal resolution increase. Literature ~1TW


13 Results Internal tides dissipation West Indian Ocean Melanesia
 RMS ocean (cm) 5km 2,75 (99,3%) 1,52 (37,6%) 19,8 7,1 2,5km 2,6 (99,2%) 1,21 (39,5%) 17,8 6,8 1,25km 2,55 (99,0%) 1,00 (40,5%) 17,6")
14 Results Impact on WL representation Resolution BF dissipation (% in polygons) Literature 2,5TW IT dissipation (% in polygons) Literature 1TW RMS coast (cm) RMS ocean (cm) 5km 2,75 (99,3%) 1,52 (37,6%) 19,8 7,1 2,5km 2,6 (99,2%) 1,21 (39,5%) 17,8 6,8 1,25km 2,55 (99,0%) 1,00 (40,5%) 17,6 6,7
15 Conclusions Step 5km to 2.5km seems crucial for BF convergence in many places and globally, 1.25km not so crucial. 0.6km and 0.3km coastal resolutions in Australia show no meaningful impact globally or locally. Places in high latitudes not converged. Common features: connection to Arctic (incl. ), narrow passages. IT generation not converged in main areas, only ~40% inside polygons. Several small island chains present in these areas which are better represented by the higher resolution. Why can be important to understand where and how much dissipation takes place? Understand the global system and dependence on local processes BF dissipation: Turbulence Mixing near the coast, implications for other processes (e.g. primary production) IT generation: Key to sustain circulation and mix upper ocean heat into abyssal depths. It is possible that properly accounting for tidally induced ocean mixing may have important implications for long-term climate modeling (Egbert and Ray)


16 Future work Resolution study: Bottom friction formulation: Combination of Chezy and Manning? Comparison with TPXO dataset M2 dissipation only Divide areas in smaller chunks to better assess sensitivities and possible ` indirect effects Australia case not very exciting Resolution tests using EMODnet 250m bathymetry in Europe (non-converged)
17 Thank you Questions?
Ocean self-attraction and loading (SAL) and internal tides dissipation implementation within an unstructured global tide-surge model
 and internal tides dissipation implementation within an unstructured global tide-surge model") Ocean self-attraction and loading (SAL) and internal tides dissipation implementation within an unstructured global tide-surge model Maialen Irazoqui Apecechea, Martin Verlaan Contents Context: BASE Platform
Ocean self-attraction and loading (SAL) and internal tides dissipation implementation within an unstructured global tide-surge model Maialen Irazoqui Apecechea, Martin Verlaan Contents Context: BASE Platform
Storm surge forecasting and other Met Office ocean modelling
 Storm surge forecasting and other Met Office ocean modelling EMODnet stakeholder meeting Clare O Neill + many others Outline Ocean modelling at the Met Office Storm surge forecasting Current operational
Forecasting Tides in Global HYCOM
 Forecasting Tides in Global HYCOM James G. Richman Oceanography Division Naval Research Laboratory Stennis Space Center, MS In collaboration with Brian Arbic, Univ. Michigan Joe Metzger, Jay Shriver &
Actual bathymetry (with vertical exaggeration) Geometry of the ocean 1/17/2018. Patterns and observations? Patterns and observations?
 Geometry of the ocean 1/17/2018. Patterns and observations? Patterns and observations?") Patterns and observations? Patterns and observations? Observations? Patterns? Observations? Patterns? Geometry of the ocean Actual bathymetry (with vertical exaggeration) Continental Continental Basin
Patterns and observations? Patterns and observations? Observations? Patterns? Observations? Patterns? Geometry of the ocean Actual bathymetry (with vertical exaggeration) Continental Continental Basin
Horizontal resolution effects on tropical cyclone storm surges
 1 2 3 Source: AFP PHOTO/CHARISM SAYAT/AFP/Getty Images Source: kakela/ Flickr Name Author Horizontal resolution effects on tropical cyclone storm surges Nadia Bloemendaal¹, S. Muis¹, R. Haarsma², M. Verlaan³,
Modeling the North West European Shelf using Delft3D Flexible Mesh
 Modeling the North West European Shelf using Delft3D Flexible Mesh 2nd JCOMM Scientific and Technical Symposium on Storm Surges, 8-13 Nov. 2015, Key West, USA; Firmijn Zijl Outline of this presentation
The surface of the ocean floor is as varied as the land. The five major oceans, from largest to smallest, are
 11.1 Ocean Basins The surface of the ocean floor is as varied as the land. The five major oceans, from largest to smallest, are w the Pacific w the Atlantic w the Indian w the Southern w the Arctic The
Assessing Shelf Sea Tides in Global HYCOM
 Assessing Shelf Sea Tides in Global HYCOM Patrick G. Timko 1, Patrick Hyder 2, Brian K. Arbic 3, and Luis Zamudio 4 1 Bangor University 2 UK Met. Office 3 University of Michigan 4 COAPS, Florida State
Adapting NEMO for use as the UK operational storm surge forecasting model
 Adapting NEMO for use as the UK operational storm surge forecasting model Rachel Furner 1, Jane Williams 2, Kevin Horsburgh 2, Andy Saulter 1 1; Met Office 2; NOC Table of Contents Existing CS3 model Developments
Earth Observation in coastal zone MetOcean design criteria
 ESA Oil & Gas Workshop 2010 Earth Observation in coastal zone MetOcean design criteria Cees de Valk BMT ARGOSS Wind, wave and current design criteria geophysical process uncertainty modelling assumptions
Nested High- Resolu0on Data Assimila0on Modeling of Ocean Tides in Coastal and Shallow Seas
 Nested High- Resolu0on Data Assimila0on Modeling of Ocean Tides in Coastal and Shallow Seas Gary Egbert Lana Erofeeva College of Oceanic and Atmospheric Sciences Oregon State University TPXO7.2- GOT4.7
OCN 201 Physiography of the Seafloor
 OCN 201 Physiography of the Seafloor Hypsometric Curve for Earth s solid surface Note histogram Hypsometric curve of Earth shows two modes. Hypsometric curve of Venus shows only one! Why? Ocean Depth vs.
ATOC 5051 INTRODUCTION TO PHYSICAL OCEANOGRAPHY. Lecture 2
 ATOC 5051 INTRODUCTION TO PHYSICAL OCEANOGRAPHY Lecture 2 Ocean basins and relation to climate Learning objectives: (1)What are the similarities and differences among different ocean basins? (2) How does
Unit 1: Water Systems on Earth Chapter 2
 Unit 1: Water Systems on Earth Chapter 2 Create a mind map with the driving question, Why are Oceans Important? Remember: Why are oceans so important? Why are oceans so important? Primary water source
Forecasting Tides in Global HYCOM
 Forecasting Tides in Global HYCOM James G. Richman Oceanography Division Naval Research Laboratory Stennis Space Center, MS In collaboration with Brian Arbic, Univ. Michigan Joe Metzger, Jay Shriver &
Collaborative Proposal to Extend ONR YIP research with BRC Efforts
 Collaborative Proposal to Extend ONR YIP research with BRC Efforts Brian Powell, Ph.D. University of Hawaii 1000 Pope Rd., MSB Honolulu, HI 968 phone: (808) 956-674 fax: (808) 956-95 email:powellb@hawaii.edu
1. Oceans. Example 2. oxygen.
 1. Oceans a) Basic facts: There are five oceans on earth, making up about 72% of the planet s surface and holding 97% of the hydrosphere. Oceans supply the planet with most of its oxygen, play a vital
Chapter 02 The Sea Floor
 Chapter 02 The Sea Floor Multiple Choice Questions 1. One of the following is not one of the world's major ocean basins: A. Atlantic Ocean B. Arctic Ocean C. Indian Ocean D. Antarctic Ocean E. Pacific
Concurrent simulation of the eddying general circulation and tides in a global ocean model
 Concurrent simulation of the eddying general circulation and tides in a global ocean model Brian K. Arbic 1 E. Joseph Metzger 2 Alan J. Wallcraft 2 1 Department of Oceanography and Center for Ocean-Atmospheric
Coastal Altimetry Workshop February 5-7, Supported by NOAA (Stan Wilson) NASA (Eric Lindstrom, Lee Fu)
 NASA (Eric Lindstrom, Lee Fu)") Coastal Altimetry Workshop February 5-7, 2008 Organized by: Laury Miller, Walter Smith: NOAA/NESDIS Ted Strub, Amy Vandehey: CIOSS/COAS/OSU With help from many of you! Supported by NOAA (Stan Wilson) NASA
Coastal Altimetry Workshop February 5-7, 2008 Organized by: Laury Miller, Walter Smith: NOAA/NESDIS Ted Strub, Amy Vandehey: CIOSS/COAS/OSU With help from many of you! Supported by NOAA (Stan Wilson) NASA
GEBCO 2013 TSCOM. EMODNET Hydrography status report
 www.emodnet-hydrography.eu GEBCO 2013 TSCOM EMODNET Hydrography status report Eric Moussat, Ifremer on behalf of the Emodnet consortium 1 Background and objectives EU proposed to take steps in 2008 towards
Oceanography II Notes
 Oceanography II Notes Tides The rise and fall in sea level is called a tide. Caused by a giant wave and the gravitational pull of the moon and sun on the ocean One low-tide/high-tide cycle takes about
Earth s Continents and Seafloors. GEOL100 Physical Geology Ray Rector - Instructor
 Earth s Continents and Seafloors GEOL100 Physical Geology Ray Rector - Instructor OCEAN BASINS and CONTINENTAL PLATFORMS Key Concepts I. Earth s rocky surface covered by of two types of crust Dense, thin,
Collaborative Proposal to Extend ONR YIP research with BRC Efforts
 DISTRIBUTION STATEMENT: Approved for public release; distribution is unlimited. Collaborative Proposal to Extend ONR YIP research with BRC Efforts Brian Powell, Ph.D. University of Hawaii 1000 Pope Rd.,
Essential Question: How are the geological features that exist on land similar to the geological features on the ocean floor?
 Essential Question: How are the geological features that exist on land similar to the geological features on the ocean floor? Geography of the Oceans The world ocean can be divided into four main ocean
Internal Tides in the Bab el Mandab Strait. Ewa Jarosz and Cheryl Ann Blain Naval Research Laboratory, Stennis Space Center, MS
 Internal Tides in the Bab el Mandab Strait Ewa Jarosz and Cheryl Ann Blain Naval Research Laboratory, Stennis Space Center, MS Project Objectives Numerical simulation of tides and exchange flow in the
Semi-enclosed seas. Estuaries are only a particular type of semi-enclosed seas which are influenced by tides and rivers
 Semi-enclosed seas Estuaries are only a particular type of semi-enclosed seas which are influenced by tides and rivers Other semi-enclosed seas vary from each other, mostly by topography: Separated from
Development of Operational Storm Surge Guidance to Support Total Water Predictions
 Development of Operational Storm Surge Guidance to Support Total Water Predictions J. Feyen 1, S. Vinogradov 1,2, T. Asher 3, J. Halgren 4, Y. Funakoshi 1,5 1. NOAA/NOS//Development Laboratory 2. ERT,
Ocean Forecasting for Australia & New Zealand and Mesoscale Oceanography
 Ocean Forecasting for Australia & New Zealand and Mesoscale Oceanography Andreas Schiller 1 Graham Rickard 2 Gary Brassington 3 1 Centre for Australian Weather and Climate Research; Wealth from Oceans
OCN 201 Physiography of the Seafloor
 OCN 201 Physiography of the Seafloor 1 Ocean Depth versus Continental Height Why do we have dry land? Solid surface of Earth is dominated by two levels: Land with a mean elevation of +840 m (29% of Earth
1. Name at least one place that the mid-atlantic Ridge is exposed above sea level.
 Interpreting Tectonic and Bathymetric Maps. The purpose of this lab is to provide experience interpreting the bathymetry of the seafloor in terms of tectonic and geologic settings and processes. Use the
EMODnet High Resolution Seabed Mapping - further developing and providing a high resolution digital bathymetry for European seas
 EMODnet High Resolution Seabed Mapping - further developing and providing a high resolution digital bathymetry for European seas EGU Fall 2017 meeting New Orleans USA, December 2017 Schaap Dick MARIS,
Practice Questions: Plate Tectonics
 Practice Questions: Plate Tectonics 1. Base your answer to the following question on The block diagram below shows the boundary between two tectonic plates. Which type of plate boundary is shown? A) divergent
OCEANOGRAPHY II NOTES
 TIDES OCEANOGRAPHY II NOTES MRS. BURKEY EARTH SPACE SCIENCE CY CREEK HS THE RISE AND FALL IN SEA LEVEL IS CALLED A TIDE. CAUSED BY A GIANT WAVE. AVERAGE LOW-TIDE/HIGH-TIDE CYCLE TAKES ABOUT 12 HRS AND
Geography of the world s oceans and major current systems. Lecture 2
 Geography of the world s oceans and major current systems Lecture 2 WHY is the GEOMORPHOLOGY OF THE OCEAN FLOOR important? (in the context of Oceanography) WHY is the GEOMORPHOLOGY OF THE OCEAN FLOOR important?
1/27/2011 C H A P T E R 4 P L A T E T E C T O N I C S. Plate Tectonics. Highest pt=mt Everest, ft, 8848 m. Lowest pt. Marianas trench, -11,000 m
 C H A P T E R 4 P L A T E T E C T O N I C S Highest pt=mt Everest, 29029 ft, 8848 m Lowest pt. Marianas trench, -11,000 m Plate Tectonics A Revolution in Geology The Plate Tectonic Model 1 A Revolution
Bathymetry Measures the vertical distance from the ocean surface to mountains, valleys, plains, and other sea floor features
 1 2 3 4 5 6 7 8 9 10 11 CHAPTER 3 Marine Provinces Chapter Overview The study of bathymetry determines ocean depths and ocean floor topography. Echo sounding and satellites are efficient bathymetric tools.
SOUTH CHINA SEA OCEAN TIDE SIMULATOR
 Proceedings of the 7 th International Conference on Asian and Pacific Coasts (APAC 2013) Bali, Indonesia, September 24-26, 2013 SOUTH CHINA SEA OCEAN TIDE SIMULATOR B. H. Choi 1, K. O. Kim 2, J. H. Yuk
The Ocean Floor THE VAST WORLD OCEAN
 OCEANOGRAPHY Name Color all water LIGHT BLUE. Color all land LIGHT GREEN. Label the 5 Oceans: Pacific, Atlantic, Indian, Arctic, Antarctic. Label the 7 Continents: N.America, S.America, Europe, Asia, Africa,
You should be able to identify a few of the key cultures, individuals and expeditions in the history of marine science:
 Ocean History You should be able to identify a few of the key cultures, individuals and expeditions in the history of marine science: Phoenicians Arabs Micronesians Polynesians Aristotle Erikson Columbus
Chapter Overview. Bathymetry. Measuring Bathymetry. Measuring Bathymetry
 CHAPTER 3 Marine Provinces Chapter Overview The study of bathymetry determines ocean depths and ocean floor topography. Echo sounding and satellites are efficient bathymetric tools. Most ocean floor features
The MSC Beaufort Wind and Wave Reanalysis
 The MSC Beaufort Wind and Wave Reanalysis Val Swail Environment Canada Vincent Cardone, Brian Callahan, Mike Ferguson, Dan Gummer and Andrew Cox Oceanweather Inc. Cos Cob, CT, USA Introduction: History
Overview of HYCOM activities at SHOM
 Overview of HYCOM activities at SHOM Stéphanie Louazel, Stéphanie Corréard, Rémy Baraille, Annick Pichon, Cyril Lathuilière, Audrey Pasquet, Emeric Baquet LOM2015 Copenhagen 2 nd 4 th June 2015 French
Map shows 3 main features of ocean floor
 Map shows 3 main features of ocean floor 2017 Pearson Education, Inc. Chapter 3 Marine Provinces 2017 Pearson Education, Inc. 1 Chapter 3 Overview The study of bathymetry determines ocean depths and ocean
Progress in embedding global tides into HYCOM simulations. Brian K. Arbic Institute for Geophysics The University of Texas at Austin
 Progress in embedding global tides into HYCOM simulations Brian K. Arbic Institute for Geophysics The University of Texas at Austin Am working closely with Alan on global forward tide modeling with HYCOM.
Challenges for Climate Science in the Arctic. Ralf Döscher Rossby Centre, SMHI, Sweden
 Challenges for Climate Science in the Arctic Ralf Döscher Rossby Centre, SMHI, Sweden The Arctic is changing 1) Why is Arctic sea ice disappearing so rapidly? 2) What are the local and remote consequences?
Signals of sea-level rise in Delaware and Chesapeake Bay tides
 Signals of sea-level rise in Delaware and Chesapeake Bay tides Andrew C. Ross and Raymond G. Najjar Pennsylvania State University Also thanks to Ming Li, Serena Lee, Fan Zhang, Wei Liu Observations show
Chapter Two. Figure 02_02. Geography of the Ocean Basins. The Sea Floor
 Chapter Two The Sea Floor Geography of the Ocean Basins Figure 02_02 The world ocean is the predominant feature on the Earth in total area. In the Northern Hemisphere, 61% of the total area is ocean. In
GEOGRAPHY OCEAN TYPES OF OCEANS Economics Importance of Oceans to Man Relief of the ocean floor Continental Shelf Importance of Continental Shelf
 GEOGRAPHY OCEAN The oceans and seas occupy about 71 per cent of the total earth surface which means that about 29 percent of the earth s surface is occupied by the land. The study of the oceans. The water
Integrated Hydrodynamic Modeling System
 Integrated Hydrodynamic Modeling System Applied Science Associates, Inc. 70 Dean Knauss Drive Narragansett, RI USA 02882 www.asascience.com support@asascience.com 1 Introduction HYDROMAP is a globally
The Lithosphere and the Tectonic System. The Structure of the Earth. Temperature 3000º ºC. Mantle
 The Lithosphere and the Tectonic System Objectives: Understand the structure of the planet Earth Review the geologic timescale as a point of reference for the history of the Earth Examine the major relief
MARINE GEOLOGY & GEOGRAPHY
 MARINE GEOLOGY & GEOGRAPHY Bathymetry BATHYMETRY BATHYMETRY THE UNDERWATER EQUIVALENT TO TOPOGRAPHY THE STUDY OF WATER DEPTH A BATHYMETRIC MAP SHOWS FLOOR RELIEF OR TERRAIN AS CONTOUR LINES Bathymetry
Chapter 27. Shelf sea modelling Test case bohai
 Chapter 27 Shelf sea modelling 27.1 Test case bohai The aim of this test case is to illustrate the use of COHERENS for tidal prediction studies, to show how an harmonic analysis can be performed and how
Inter comparison of wave height observations from buoy and altimeter with numerical prediction
 Indian Journal of Geo-Marine Sciences Vol. 43(7), July 2014, pp. 1347-1351 Inter comparison of wave height observations from buoy and altimeter with numerical prediction S. A. Sannasiraj 1*, M. Kalyani
Validation Report: WP5000 Regional tidal correction (Noveltis)
") Consortium Members ESA Cryosat Plus for Oceans Validation Report: WP5000 Regional tidal correction (Noveltis) Reference: Nomenclature: CLS-DOS-NT-14-083 CP4O-WP5000-VR-03 Issue: 2. 0 Date: Jun. 20, 14
Consortium Members ESA Cryosat Plus for Oceans Validation Report: WP5000 Regional tidal correction (Noveltis) Reference: Nomenclature: CLS-DOS-NT-14-083 CP4O-WP5000-VR-03 Issue: 2. 0 Date: Jun. 20, 14
Applications of the SMC Grid in Ocean Surface Wave Models
 Applications of the SMC Grid in Ocean Surface Wave Models Jian-Guo Li & Andrew Saulter 13 September 2017 Contents This presentation covers the following areas Introduction of SMC grid Propagation on a
A Community Terrain-Following Ocean Modeling System (ROMS)
") DISTRIBUTION STATEMENT A. Approved for public release; distribution is unlimited. A Community Terrain-Following Ocean Modeling System (ROMS) PI: Hernan G. Arango Department of Marine and Coastal Sciences,
DISTRIBUTION STATEMENT A. Approved for public release; distribution is unlimited. A Community Terrain-Following Ocean Modeling System (ROMS) PI: Hernan G. Arango Department of Marine and Coastal Sciences,
Chapter 9 Lecture Outline. Oceans: The Last Frontier
 Chapter 9 Lecture Outline Oceans: The Last Frontier The Vast World Ocean Earth is referred to as the blue planet 71% of Earth s surface is oceans and marginal seas Continents and islands comprise the remaining
THC-T-2013 Conference & Exhibition
 Modeling of Shutter Coastal Protection against Storm Surge for Galveston Bay C. Vipulanandan, Ph.D., P.E., Y. Jeannot Ahossin Guezo and and B. Basirat Texas Hurricane Center for Innovative Technology (THC-IT)
MARINE GEOLOGY & GEOGRAPHY
 MARINE GEOLOGY MARINE GEOLOGY & GEOGRAPHY Marine Geology 4 LAYERS OF THE EARTH CRUST THICKNESS: VARIES BETWEEN OCEAN & CONTINENTS 5-40 KM STATE: SOLID ELEMENTS: SILICON, ALUMINUM, CALCIUM, SODIUM, POTASSIUM
WEEKEND WEATHER OUTLOOK BELIZE, CENTRAL AMERICA
 WEEKEND WEATHER OUTLOOK BELIZE, CENTRAL AMERICA PERIOD: Friday, July 13 until Monday, July 16, 2012 DATE ISSUED: Friday, June 13, 2012, 9:00 am RFrutos SYNOPSIS: A weak pressure gradient over the NW Caribbean
Implementation of SWAN model with COSMO-CLM and WRF-ARW wind forcing for the Barents Sea storm events (case study).
.") IGU Regional Conference Moscow 2015 Implementation of SWAN model with COSMO-CLM and WRF-ARW wind forcing for the Barents Sea storm events (case study). Stanislav Myslenkov 1, Vladimir Platonov 2 and Pavel
IGU Regional Conference Moscow 2015 Implementation of SWAN model with COSMO-CLM and WRF-ARW wind forcing for the Barents Sea storm events (case study). Stanislav Myslenkov 1, Vladimir Platonov 2 and Pavel
Oceanography. Oceanography is the study of the deep sea and shallow coastal oceans.
 Oceanography Oceanography is the study of the deep sea and shallow coastal oceans. Studying the Ocean Floor To determine the shape and composition of the ocean floor, scientists use techniques such as
Assessing Storm Tide Hazard for the North-West Coast of Australia using an Integrated High-Resolution Model System
 Assessing Storm Tide Hazard for the North-West Coast of Australia using an Integrated High-Resolution Model System J. Churchill, D. Taylor, J. Burston, J. Dent September 14, 2017, Presenter Jim Churchill
EMODnet High Resolution Seabed Mapping - further developing a high resolution digital bathymetry for European seas
 EMODnet High Resolution Seabed Mapping - further developing a high resolution digital bathymetry for European seas IMDIS 2018 Conference, 7 November 2018, Barcelona - Spain Thierry Schmitt Dick M.A. Schaap
Chapter 20. Plate Tectonics. Scientific Method. This is a repeatable measurement or experiment. One or more possible explanations to link observations
 Chapter 20 Plate Tectonics Scientific Method 1. Observation (fact) This is a repeatable measurement or experiment 2. Hypothesis One or more possible explanations to link observations 3. Testing Further
The World Ocean. Pacific Ocean 181 x 10 6 km 2. Indian Ocean 74 x 10 6 km 2. Atlantic Ocean 106 x 10 6 km 2
 The World Ocean The ocean and adjacent seas cover 70.8% of the surface of Earth, an area of 361,254,000 km 2 Pacific Ocean 181 x 10 6 km 2 Indian Ocean 74 x 10 6 km 2 Atlantic Ocean 106 x 10 6 km 2 Oceanic
Modeling the Formation and Offshore Transport of Dense Water from High-Latitude Coastal Polynyas
 Modeling the Formation and Offshore Transport of Dense Water from High-Latitude Coastal Polynyas David C. Chapman Woods Hole Oceanographic Institution Woods Hole, MA 02543 phone: (508) 289-2792 fax: (508)
 http://www.neic.cr.usgs.gov/neis/pands/global.html Global Seismicity and World Cities This map displays the worldwide hazard to cities by large earthquakes. When earthquakes occur near cities, the potential
Lecture Marine Provinces
 Lecture Marine Provinces Measuring bathymetry Ocean depths and topography of ocean floor Sounding Rope/wire with heavy weight Known as lead lining Echo sounding Reflection of sound signals 1925 German
Global Circulation. Local weather doesn t come from all directions equally Everyone s weather is part of the global circulation pattern
 Global Circulation Local weather doesn t come from all directions equally Everyone s weather is part of the global circulation pattern Wind rose shows % frequency of winds around the compass 1 Global Circulation
How Will Melting Ice Sheets Affect Us?
 PASSAGE 4 How Will Melting Ice Sheets Affect Us? Variation is normal. During the last ice age, for example, ice sheets also covered much of North America and Scandinavia. Why is what s happening now different
The Marine Environment
 The Marine Environment SECTION 16.1 Shoreline Features In your textbook, read about erosional landforms, beaches, estuaries, longshore currents, and rip currents. For each statement below, write true or
Satellites, Weather and Climate Module??: Polar Vortex
 Satellites, Weather and Climate Module??: Polar Vortex SWAC Jan 2014 AKA Circumpolar Vortex Science or Hype? Will there be one this year? Today s objectives Pre and Post exams What is the Polar Vortex
Storm surge modeling at RSMC La Réunion. Cliquez pour modifier le style des sous-titres du masque
 Storm surge modeling at RSMC La Réunion Cliquez pour modifier le style du titre Cliquez pour modifier le style des sous-titres du masque 6th session training course of tropical cyclones (28 oct. 5 nov.
Physical Oceanographic Context of Seamounts. Pierre Dutrieux Department of Oceanography, University of Hawai'i at Manoa, Honolulu, Hawai'i
 Physical Oceanographic Context of Seamounts Pierre Dutrieux Department of Oceanography, University of Hawai'i at Manoa, Honolulu, Hawai'i PEW Workshop, October 2007 Seamounts: definitions submarine topographic
Ocean Mixing and Climate Change
 Ocean Mixing and Climate Change Factors inducing seawater mixing Different densities Wind stirring Internal waves breaking Tidal Bottom topography Biogenic Mixing (??) In general, any motion favoring turbulent
Updating the GEBCO Grid
 Updating the GEBCO Grid PAULINE WEATHERALL, GEBCO DIGITAL ATLAS MANAGER, BRITISH OCEANOGRAPHIC DATA CENTRE (BODC), NATIONAL OCEANOGRAPHY CENTRE (NOC), LIVERPOOL, UK. GEBCO TSCOM and SCRUM meeting, Kuala
Figure 3.1: Illustration showing the bathymetry s role for the tsunami propagation following the earth quake 26 December 2004 outside of Sumatra.
 Figure 3.1: Illustration showing the bathymetry s role for the tsunami propagation following the earth quake 26 December 2004 outside of Sumatra. The left globe shows the seafloor bathymetry as portrayed
Indian Ocean Forecast System (INDOFOS) Abhisek Chatterjee
 Abhisek Chatterjee") Indian Ocean Forecast System (INDOFOS) Abhisek Chatterjee Earth System Sciences Organisation (ESSO) Indian National Centre for Ocean Information Services (INCOIS) Ministry of Earth Sciences, Government
Indian Ocean Forecast System (INDOFOS) Abhisek Chatterjee Earth System Sciences Organisation (ESSO) Indian National Centre for Ocean Information Services (INCOIS) Ministry of Earth Sciences, Government
11/24/09 OCN/ATM/ESS The Pacific Decadal Oscillation. What is the PDO? Causes of PDO Skepticism Other variability associated with PDO
 11/24/09 OCN/ATM/ESS 587.. The Pacific Decadal Oscillation What is the PDO? Causes of PDO Skepticism Other variability associated with PDO The Pacific Decadal Oscillation (PDO). (+) ( ) EOF 1 of SST (+)
The Application of POM to the Operational Tidal Forecast for the Sea around Taiwan
 The Application of POM to the Operational Tidal Forecast for the Sea around Taiwan Shan-Pei YEH 1 Hwa CHIEN Sen JAN 3 and Chia Chuen KAO 4 1 Coastal Ocean Monitoring Center, National Cheng Kung University,
Forecast of Nearshore Wave Parameters Using MIKE-21 Spectral Wave Model
 Forecast of Nearshore Wave Parameters Using MIKE-21 Spectral Wave Model Felix Jose 1 and Gregory W. Stone 2 1 Coastal Studies Institute, Louisiana State University, Baton Rouge, LA 70803 2 Coastal Studies
Ocean facts continued
 Ocean Facts A dynamic system in which many chemical and physical changes take place Formed over millions of years as precipitation filled low areas on Earth called basins and now covers 70% of the Earth
ARE YOU READY TO THINK? Look at the first slide THINK PAIR SHARE!
 ARE YOU READY TO THINK? Look at the first slide THINK PAIR SHARE! WHAT PROMINENT FEATURE CAN YOU IDENTIFY IN THIS PICTURE? What do you think the different colors represent? Who might find such a picture
Question: What is the primary reason for the great abundance of fish along the Peruvian coast?
 Buzzer Question # 1 Question Type: toss-up Question Format: Multiple Choice Category: Biology What is the primary reason for the great abundance of fish along the Peruvian coast? Answer W: upwelling Answer
Science 8 - Water Systems Test - Chapters 1-2
 Science 8 - Water Systems Test - Chapters 1-2 Multiple Choice (30 marks) Identify the choice that best completes the statement or answers the question. 1. What percentage represents the amount of fresh
POLCOMS Metadata for the ARCoES project Keywords: POLCOMS, WAM, residual circulation, waves, Liverpool Bay, UK shelf
 POLCOMS Metadata for the ARCoES project Keywords: POLCOMS, WAM, residual circulation, waves, Liverpool Bay, UK shelf POLCOMS is the Proudman Oceanographic Laboratory Coastal Ocean Modelling System. It
Indian Ocean Tsunami Warning System: Example from the 12 th September 2007 Tsunami
 Indian Ocean Tsunami Warning System: Example from the 12 th September 2007 Tsunami Charitha Pattiaratchi 1 Professor of Coastal Oceanography, The University of Western Australia Email: chari.pattiaratchi@uwa.edu.au
Satellite ALTimetry. SALT applications and use of data base for SE-Asia region. SEAMERGES kick-off meeting, Bangkok, Thailand.
 Satellite ALTimetry SALT applications and use of data base for SE-Asia region SEAMERGES kick-off meeting, Bangkok, Thailand Marc Naeije 4 March 2004 1 Faculty of Aerospace Engineering DEOS/AS SEAMERGES
OCEAN WAVE FORECASTING AT E.C.M.W.F.
 OCEAN WAVE FORECASTING AT E.C.M.W.F. Jean-Raymond Bidlot Marine Prediction Section Predictability Division of the Research Department European Centre for Medium-range Weather Forecasts Slide 1 Ocean waves:
Numerical Models of Oceans and Oceanic Processes
 Numerical Models of Oceans and Oceanic Processes Kantha and Clayson, 2000; review notes by S. P. Muszala 1 Introduction to Ocean Dynamics first numerical baroclinic ocean model Kirk Bryan, late 1960 s
The Sea Floor. Chapter 2
 The Sea Floor Chapter 2 Geography of the Ocean Basins World ocean is the predominant feature on the Earth in total area Northern Hemisphere = 61% of the total area is ocean. Southern Hemisphere = about
Image Services Providing Access to Scientific Data at NOAA/NCEI
 Image Services Providing Access to Scientific Data at NOAA/NCEI Jesse Varner Cooperative Institute for Research in Environmental Sciences (CIRES), University of Colorado John Cartwright NOAA National Centers
Tides Supplement. Brian Arbic
 Tides Supplement Brian Arbic OVERVIEW QUESTIONS What causes the tides? How is a lunar day different from a solar day? Which body creates a larger tidal influence on Earth: the Moon or the Sun? How do the
TAKE HOME EXAM 8R - Geology
 Name Period Date TAKE HOME EXAM 8R - Geology PART 1 - Multiple Choice 1. A volcanic cone made up of alternating layers of lava and rock particles is a cone. a. cinder b. lava c. shield d. composite 2.
Chapter 24 Tropical Cyclones
 Chapter 24 Tropical Cyclones Tropical Weather Systems Tropical disturbance a cluster of thunderstorms about 250 to 600 km in diameter, originating in the tropics or sub-tropics Tropical depression a cluster
Ocean surface circulation
 Ocean surface circulation Recall from Last Time The three drivers of atmospheric circulation we discussed: Differential heating Pressure gradients Earth s rotation (Coriolis) Last two show up as direct
Ocean Circulation. In partnership with Dr. Zafer Top
 Ocean Circulation In partnership with Dr. Zafer Top Samantha Hampton Honors Science December 15, 2014 Ocean Circulation is the large scale movement of waters in the ocean basins. Dr. Zafer Top studies
4. In areas where tectonic plates collide, the seafloor has deep. 5. In areas where tectonic plates separate, the seafloor has mid- ocean
 Name Date Hour Table Chapter 14 Lesson One- General Directions: Use the word bank below to complete each statement. NOT all terms are used. abyssal plains brackish water condensation energy freshwater