Applications of the SMC Grid in Ocean Surface Wave Models
|
|
|
- Darleen Dennis
- 5 years ago
- Views:
Transcription

1 Applications of the SMC Grid in Ocean Surface Wave Models Jian-Guo Li & Andrew Saulter 13 September 2017
2 Contents This presentation covers the following areas Introduction of SMC grid Propagation on a SMC grid Application in wave models Summary and conclusions

3 Polar problems in lat-lon grid Transportation equation in spherical system, 1 of 900: ( uψ ) ( υψ cosϕ ) ψ + + = t x cosϕ y 0 Severe CFL restriction on Eulerian advection time step at high latitudes. Hence wave models stop at ~ 82º N. The Pole is a singular point Flow has to go around it, not crossing it.
4 Spherical Multiple-Cell grid Merged cells at high latitudes to relax CFL limit on time step. Introduce round polar cells with integral equation to avoid polar blocking and singularity. ψda = ψ d t v s A C A t ψ ψ ψυ m n+ 1 n P P = ± i i si AP i= 1 More details please see: Li, J.G. 2011: Mon. Wea. Rev., 139,
5 Map-east reference direction SMC grid uses merged cells at high latitudes to relax CFL limit on time step. Introduce a round polar cell to avoid polar blocking and singularity. Define wave spectral component with fixed reference direction --- the map-east, instead of the rapidly changing local east at high latitudes. Keep map-east system in Arctic part from the local east in global part.

6 SMC6-25 grid Arctic region Li, J.G. & A. Saulter 2014: Ocean Dynamics, 64,
 still smaller than lat-lon grid (1024x768=786 432) 66%. Could make regional models redundant.")
7 Refined km SMC grid Refined resolution up to 6km near coastlines, resolving small islands. Number of cells (520615) still smaller than lat-lon grid (1024x768= ) 66%. Could make regional models redundant. Sub-time-steps to handle refined cells.
8 Creating a multi-resolution SMC grid Each cell is assigned a 5-element array, giving its SW corner x, y index i, j, and sizes or number of increment in unit of size-1 dx, dy. X and Y sizes may be different for different resolutions or high latitude merged cells. For more details see: WAVEWATCH III V5.16: smc_docs/smc_grid_guide
9 Surface wave energy balance equation on SMC grid Ocean surface wave spectral energy balance equation in spherical coordinate system: Advection and diffusion terms are merged. Great-circle turning is added to refraction. Details see: Li, J.G. (2012) J. Comput. Phys., 231, ( ) ( ) ( ) ( ) ( ) y D V F x D U u F S k k y F x F t y y x x y x + + = ψ ψ υ ψ ψ θ θψ ψ ϕ ϕ ψ cos cos
10 Upstream Non-Oscillatory 2 nd Order (UNO2) Advection Scheme ( 1/2 1/2 + 1/2 + 1/2 ) ψ = ψ + u ψ u ψ t x UNO2 n+ 1 n MF MF j j j j j j j ψ You Know Too ( ) = ψ + x x G MF n j + 1/2 C MF C C ( ) min (, ) G = Sign G G G C DC DC CU ( ψ ψ ) ( ) G x x ( + 1/2 )( + 1/2 ) x x = 0.5sign u x u t MF C j C j AB A B A B Details see: Li, J.G. (2008) Mon. Wea. Rev., 136, Upstream, Central and Downstream cells relative to velocity u. U j+1/2 U C D j -1 j j +1
11 Unstructured SMC grid flux face pointer array Internal and boundary faces are treated alike in 1-D array. No boundary for global model. Single point island is extended by 0-cells, allowing singleisland blocking. Two-D spherical surface advection is done by 4 loops: u- and v-face flux loops and 2 cell update loops. (i, j, Δ, mm, m, n, nn)
12 Multi-Resolution SMC grid Sub-flux loop for refined faces with sub-timestep. Temporary net flux variable to hold flux into each cell between space and sub-time levels. Sub-cell loop to update refined cells and reset net flux variable. Number of refined levels defined by user. Halved sub time step for halved faces UΔt UΔt/2 UΔt/4
13 Wave spectra (36) transport on 6-25 SMC grid
14 Wave spectra (36) transport on 6-25 SMC grid
15 Wave spectra (36) transport on 6-25 SMC grid

16 Wave spectra (36) transport on 6-25 SMC grid
17 MO operational wave models 1. Global wave model SMC36125 grid, replaced 35 km lat-lon grid model in August The European regional wave model on rotated latlon 8km grid will retire as the global SMC36125 model has a refined area over European. 2. Climate wave model on SMC50km grid. 3. Ensemble N Atlantic wave model km SMC grid. 4. UK regional wave model on rotated lat-lon 4km grid, will be replaced with a SMC1.5-3 km grid.

18 Comparison SMC36125 Arctic and European SWH with/out Ice LI, JG 2016: Ocean Dynamics, 66,
19 Comparison with satellite and buoys Pacific Tracks Atlantic tracks
20 Along satellite tracks in Atlantic
21 Along satellite tracks in Pacific

22 Comparison with spectral buoys
23 Comparison SMC36125-ST4 via Buoy SWH WW3 V4.18 retuned ST4 source term 32 spectral buoys from NDBC.
24 Frequency bins and 4-bin SRWH SRWH defined as s ( ) f 0 ( ) 4 f2 2π = θ (, θ) H f f df d E f
25 Comparison SMC36125-ST4 with Buoy 4-bin SRWH First two bins for swell, model is slightly higher than buoy; Last two bins for windsea, model is slightly lower; So retuned ST4 source term is balanced over the full spectral range.
26 Comparison with other centres - all SMC36125 global model has brought visible improvement to the Met Office wave forecast as compared with other wave forecasting centres. Old 35km global model SMC36125 global model
27 Comparison with other centres - Hawaii SMC36125 refined coastlines lead to improved swell propagation as small island effect is resolved better than old single resolution model. Old 30km global model SMC36125 global model

28 The 50km SMC grid - Arctic

29 The 50km SMC grid Total cell 108,067 ~ 58% of the lat-lon grid 512x368
30 SMC36125 Atlantic model Regional grid for the N. Atlantic Ocean. Boundary condition is minimised by extending to coastlines. Only the southern boundary (red) along the Tropic of Capricorn requires input. Isolated or weakly linked waters, like the Hudson Bay, Baltic and Mediterranean Sea are removed to speed up the ensemble model.
 are negligible to N Atlantic.")
31 SWH in SMC36125 Atlantic model North boundary sealed by Arctic sea-ice; Southern boundary is defined by input from our global SMC36125 wave model; Sheltered waters (Gulf of Mexico, Hudson Bay, Baltic and Mediterranean Sea) are negligible to N Atlantic.


32 SMC36125 Atlantic model UK area
33 Rotated RTD + SMC grid Move the N Pole to a new location (λ p, φ p ) so that an interested region falls on the rotated Equatorial area for evenly spaced mesh, hence, it is also called the Equatorial grid. Any location A on the sphere will be linked with standard (λ,φ) and rotated (λ,φ )

34 Rotated SMC1.5-3 km UK grid Multi-resolution km grid. Rotated N at 177.5ºE,37.5ºN, grid for evenly spaced cells around UK. Boundary conditions provided by SMC36125 global model. Inpputs include current and tidal effects.
 and the nonlinear wave")
35 SMC1.5-3 km UK model SWH Wind and current effects included. Note the high waves off the Brittany coast or around the Isle of Ushant. It is caused by an unknown interaction between the ocean current gradient induced k-shift (part of wave refraction) and the nonlinear wave interaction term.

36 SMC6125 km rotated Arctic grid Rotated pole at (135ºE, 10ºN) so the Arctic region is near the rotated Equator with an evenly spaced mesh. Boundaries are set across Atlantic and Bering Strait.

37 SWH in SMC6125 km Arctic model SWH from an ice-free case of the rotated grid Arctic model. Boundary condition is provided by our global SMC36125 wave model.
38 Applications outside Met Office 1. NCEP Great Lakes km SMC grid. 2. Environment Canada wave climate model on km SMC Arctic grid, nested in global km SMC grid. 3. Australia Hurricane wave research km Gulf of Mexico SMC grid. 4. Mediterranean Sea km SMC grid for UPC, Spain and CNR ISMAR, Italia. 5. West Pacific regional wave forecast model for NMEFC, China 6. West Pacific wave model ensemble system for Industrial Technology Institute, Hsinchu, Taiwan.
.")
39 SMC0512 grid for Great Lakes SMC resolution at 0.5, 1 and 2km. Total cell number 124,578 is about 32% of 2km grid (768x512).

40 SWH of SMC0512 GtLakes model SWH hardly grows over 4 m in the Gt Lakes due to limited fetch and wind during the study period ( ).
41 SMC36125 Mediterranean Model
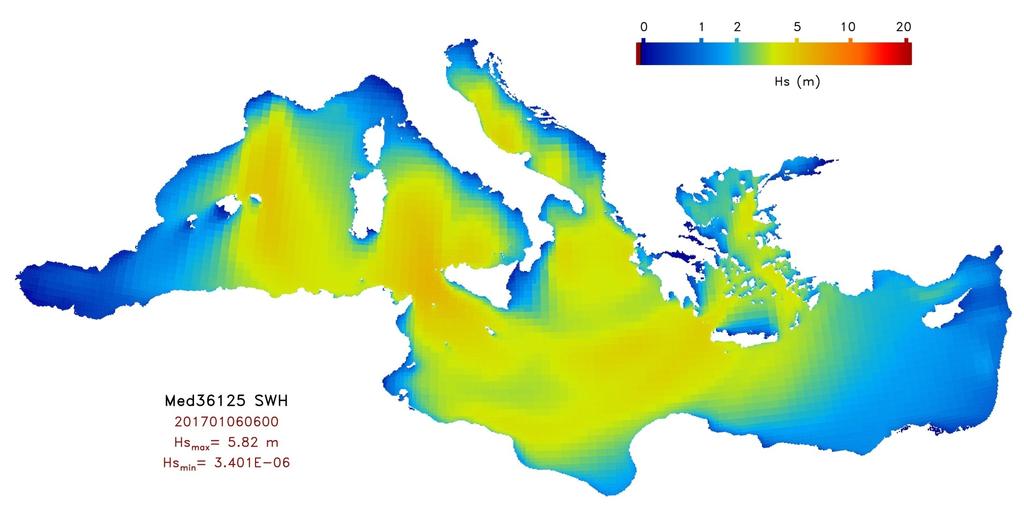
42 SWH in Mediterranean model

43 SMC12-25 km EC Arctic model Courtesy of Dr Mercè Casas-Prat Environment Canada
44 SMC12-25 km EC Arctic SWH Courtesy of Dr Mercè Casas-Prat Environment Canada

45 SMC2-4-8 Gulf of Mexico model Courtesy of Dr Qingxiang Liu Ocean Univ. of China Swinburne Univ. Techno. Australia

46 SMC36125 grid Asia Pacific

47 SMC36125 SWH Asia Pacific

48 SMC km Pacific model Courtesy of Dr Hengwen Chang Industrial Technology Research Institute, Hsinchu, Taiwan

49 SMC50 Global wave model NMEFC Courtesy of Dr CAI, Qiongqiong NMEFC of China
50 Summary and conclusions SMC grid relaxes CFL limit on time step by merging cells at high latitudes and reduces curvature error by switching from the local east to a fixed (map-east) direction system in the Arctic. Multi-resolution is achieved for coastal regions with refined cells and sub-time-steps are used to reduce computation cost. This makes it possible to merge global and regional wave models and include the Arctic if necessary. Four processes (advection, diffusion, refraction and great-circle turning) related to ocean surface wave propagation are formulated on the SMC grid and coded into the WW3 model V4.18 and V5.16. There are 4 SMC grid models currently in use the Met Office, including SMC36125 km global wave forecast model and N Atlantic ensemble model, SMC50km global wave model for coupled system and rotated SMC grid UK1.5-3 km wave model. International collaborations involve 6 SMC grid models so far, including the km Great Lakes, Mediterranean 3-25 km, EC12-25 km Arctic, Gulf of Mexico km, West Pacific forecast and ensemble models on multi-resolution SMC grids.

51 Thank you! Questions?
52 SMC1-2-4 km UK rotated grid Multi-resolution km SMC grid Rotated N at 177.5ºE,37.5ºN, grid for evenly spaced cells around UK. Boundary conditions provided by SMC36125 global model. Will include current and tidal effects.

53 SMC1-2-4 km UK model SWH Multi-resolution km SMC grid Using rotated grid for evenly sized cells in whole domain. Boundary conditions provided by SMC36125 global model. Will include current and tidal effects.
54 SMC36125 wave model NMEFC Courtesy of Dr CAI, Qiongqiong, NMEFC of China

55 Nested grids could be replaced by a single SMC grid. Courtesy of Dr. Tom Durrant MetOcean Solutions Ltd., Raglan, New Zealand

56 SRWH 4-bin output SMC25
Applications of the Spherical Multiple-Cell Grid in Ocean Surface Wave Models
 1 st International workshop on waves, storm surges and coastal hazards. Liverpool, UK, 10-15 September 2017 Applications of the Spherical Multiple-Cell Grid in Ocean Surface Wave Models Jian-Guo Li * and
CMIP5-based global wave climate projections including the entire Arctic Ocean
 CMIP5-based global wave climate projections including the entire Arctic Ocean 1 ST International Workshop ON Waves, storm Surges and Coastal Hazards Liverpool, UK, 10-15 September 2017 Mercè Casas-Prat,
Process and resolution impacts on UK coastal wave predictions from operational global-regional wave models
 Process and resolution impacts on UK coastal wave predictions from operational global-regional wave models Andy Saulter, Jian-Guo Li, Chris Bunney and Tamzin Palmer Met Office Email: andrew.saulter@metoffice.gov.uk
VALIDATION OF A REGIONAL WAVE MODEL WITH ENVISAT AND BUOY OBSERVATIONS
 VALIDATION OF A REGIONAL WAVE MODEL WITH ENVISAT AND BUOY OBSERVATIONS Jian-Guo Li, Martin Holt Met Office, FitzRoy Road, Exeter EX1 3PB, United Kingdom Email: Jian-Guo.Li@metoffice.gov.uk, Martin.Holt@metoffice.gov.uk
Pacific HYCOM. E. Joseph Metzger, Harley E. Hurlburt, Alan J. Wallcraft, Luis Zamudio and Patrick J. Hogan
 Pacific HYCOM E. Joseph Metzger, Harley E. Hurlburt, Alan J. Wallcraft, Luis Zamudio and Patrick J. Hogan Naval Research Laboratory, Stennis Space Center, MS Center for Ocean-Atmospheric Prediction Studies,
Storm surge forecasting and other Met Office ocean modelling
 Storm surge forecasting and other Met Office ocean modelling EMODnet stakeholder meeting Clare O Neill + many others Outline Ocean modelling at the Met Office Storm surge forecasting Current operational
Waves and Weather. 1. Where do waves come from? 2. What storms produce good surfing waves? 3. Where do these storms frequently form?
 Waves and Weather 1. Where do waves come from? 2. What storms produce good surfing waves? 3. Where do these storms frequently form? 4. Where are the good areas for receiving swells? Where do waves come
Class Notes: Water and Climate. Ever since the outgassing of water vapor years ago, Earth has been recycling its water supply. Water Cycle -!
 Name: Date: Period: Water and Climate The Physical Setting: Earth Science I. The Water Cycle Ever since the outgassing of water vapor years ago, Earth has been recycling its water supply Earth has not
HURRICANE - GENERATED OCEAN WAVES
 HURRICANE - GENERATED OCEAN WAVES Fumin Xu,, Will Perrie Bechara Toulany and Peter C Smith Fisheries and Oceans Canada, Bedford Institute of Oceanography, Dartmouth, NS, Canada College of Ocean Engineering,
Impacts of Climate Change on Autumn North Atlantic Wave Climate
 Impacts of Climate Change on Autumn North Atlantic Wave Climate Will Perrie, Lanli Guo, Zhenxia Long, Bash Toulany Fisheries and Oceans Canada, Bedford Institute of Oceanography, Dartmouth, NS Abstract
ECMWF Medium-Range Forecast Graphical Products
 ECMWF Medium-Range Forecast Graphical Products Analysis Snow cover, ice cover, albedo, leaf area index, orography and sea depth Albedo Europe, Global, Central Europe, North West Europe, North East Europe,
 Page 1 of 5 Home research global climate enso effects Research Effects of El Niño on world weather Precipitation Temperature Tropical Cyclones El Niño affects the weather in large parts of the world. The
Evaluating the results of Hormuz strait wave simulations using WAVEWATCH-III and MIKE21-SW
 Int. J. Mar. Sci. Eng., 2 (2), 163-170, Spring 2012 ISSN 2251-6743 IAU Evaluating the results of Hormuz strait wave simulations using WAVEWATCH-III and MIKE21-SW *F. S. Sharifi; M. Ezam; A. Karami Khaniki
Effect of coastal resolution on global estimates of tidal energy dissipation
 Effect of coastal resolution on global estimates of tidal energy dissipation Maialen Irazoqui Apecechea, Martin Verlaan Contents The GTSMv2.0 model Characteristics Major developments Applications Coastal
Climate Outlook for March August 2018
 The APEC CLIMATE CENTER Climate Outlook for March August 2018 BUSAN, 26 February 2018 The synthesis of the latest model forecasts for March to August 2018 (MAMJJA) from the APEC Climate Center (APCC),
09 November 2017 (Week ) NEW BRITISH ADMIRALTY PUBLICATIONS AVAILABLE NOW
 NEW BRITISH ADMIRALTY PUBLICATIONS AVAILABLE NOW") 09 November 2017 (Week 45 2017) NEW BRITISH ADMIRALTY PUBLICATIONS AVAILABLE NOW CODE TITLE AVAILABLE PRICE GBP NP057B Norway Pilot Volume 2B, 10th Edition, 2017 WK 45/17 60.60 NP207-18 ADMIRALTY Tide
09 November 2017 (Week 45 2017) NEW BRITISH ADMIRALTY PUBLICATIONS AVAILABLE NOW CODE TITLE AVAILABLE PRICE GBP NP057B Norway Pilot Volume 2B, 10th Edition, 2017 WK 45/17 60.60 NP207-18 ADMIRALTY Tide
GEOGRAPHY STD.9 LATITUDE & LONGITUDE
 GEOGRAPHY STD.9 LATITUDE & LONGITUDE 1. What is the Earth Grid? A. The complete network of meridians & parallels is called the earth Grid. 2. What is Latitude? A. The latitude of a place is the distance
O.M Smedstad 1, E.J. Metzger 2, R.A. Allard 2, R. Broome 1, D.S. Franklin 1 and A.J. Wallcraft 2. QinetiQ North America 2. Naval Research Laboratory
 An eddy-resolving ocean reanalysis using the 1/12 global HYbrid Coordinate Ocean Model (HYCOM) and the Navy Coupled Ocean Data Assimilation (NCODA) scheme O.M Smedstad 1, E.J. Metzger 2, R.A. Allard 2,
Upgrades to the Operational Sea State Forecast System
 NMOC Operations Bulletin No. 53 Upgrades to the Operational Sea State Forecast System Introduction 25 August 2000 The WAM wave model (WAMDI, 1988, Komen et al., 1994) has been the operational sea state
1 What Is Climate? TAKE A LOOK 2. Explain Why do areas near the equator tend to have high temperatures?
 CHAPTER 17 1 What Is Climate? SECTION Climate BEFORE YOU READ After you read this section, you should be able to answer these questions: What is climate? What factors affect climate? How do climates differ
Studying the Ocean Using Live Data
 Studying the Ocean Using Live Data Overview The Argo buoy project is a major oceanographic study that harnesses the power of automated unmanned buoys traveling the world s oceans (http://www.argo.ucsd.edu/).
The impact of the assimilation of altimeters and ASAR L2 wave data in the wave model MFWAM
 The impact of the assimilation of altimeters and ASAR L2 wave data in the wave model MFWAM Lotfi Aouf 1, Jean-Michel Lefèvre 1 1) Météo-France, Toulouse 12 th Wave Hindcasting and Forecasting, Big Island
Climate Outlook for October 2017 March 2018
 The APEC CLIMATE CENTER Climate Outlook for October 2017 March 2018 BUSAN, 25 September 2017 The synthesis of the latest model forecasts for October 2017 to March 2018 (ONDJFM) from the APEC Climate Center
ATMOSPHERIC MODELLING. GEOG/ENST 3331 Lecture 9 Ahrens: Chapter 13; A&B: Chapters 12 and 13
 ATMOSPHERIC MODELLING GEOG/ENST 3331 Lecture 9 Ahrens: Chapter 13; A&B: Chapters 12 and 13 Agenda for February 3 Assignment 3: Due on Friday Lecture Outline Numerical modelling Long-range forecasts Oscillations
WAVE-ATMOSPHERE-OCEAN MODELLING OF RECENT STORMS
 WAVE-ATMOSPHERE-OCEAN MODEING OF RECENT STORMS W.Perrie 1, W. Zhang 1,4, Z. ong 1,2, W. i 1,3 & B. Toulany 1 1 Bedford Institute of Oceanography, Dartmouth, Nova Scotia, Canada 2 Institute for Atmospheric
Semi-enclosed seas. Estuaries are only a particular type of semi-enclosed seas which are influenced by tides and rivers
 Semi-enclosed seas Estuaries are only a particular type of semi-enclosed seas which are influenced by tides and rivers Other semi-enclosed seas vary from each other, mostly by topography: Separated from
Effect of Typhoon-Driven Ocean Waves on Sea-to-Air Transfer of Dimethylsulfide (DMS)
") Effect of Typhoon-Driven Ocean Waves on Sea-to-Air Transfer of Dimethylsulfide (DMS) Peter C Chu Department of Oceanography Naval Postgraduate School Monterey, California, USA pcchu@nps.edu http://www.oc.nps.navy.mil/~chu
Effect of Typhoon-Driven Ocean Waves on Sea-to-Air Transfer of Dimethylsulfide (DMS) Peter C Chu Department of Oceanography Naval Postgraduate School Monterey, California, USA pcchu@nps.edu http://www.oc.nps.navy.mil/~chu
Outlook 2008 Atlantic Hurricane Season. Kevin Lipton, Ingrid Amberger National Weather Service Albany, New York
 Outlook 2008 Atlantic Hurricane Season Kevin Lipton, Ingrid Amberger National Weather Service Albany, New York Summary 2007 Hurricane Season Two hurricanes made landfall in the Atlantic Basin at category-5
Challenges for Climate Science in the Arctic. Ralf Döscher Rossby Centre, SMHI, Sweden
 Challenges for Climate Science in the Arctic Ralf Döscher Rossby Centre, SMHI, Sweden The Arctic is changing 1) Why is Arctic sea ice disappearing so rapidly? 2) What are the local and remote consequences?
Quarterly numerical weather prediction model performance summaries April to June 2010 and July to September 2010
 Australian Meteorological and Oceanographic Journal 60 (2010) 301-305 Quarterly numerical weather prediction model performance summaries April to June 2010 and July to September 2010 Xiaoxi Wu and Chris
HWRF Ocean: MPIPOM-TC
 HWRF v3.7a Tutorial Nanjing, China, December 2, 2015 HWRF Ocean: MPIPOM-TC Ligia Bernardet NOAA SRL Global Systems Division, Boulder CO University of Colorado CIRS, Boulder CO Acknowledgement Richard Yablonsky
Introduction to Geography
 Introduction to Geography ropic of Cancer 3½ N Arctic Circle 90 N Prime Meridian 0 Arctic Ocean Mississippi R. Appalachian Mts. Europe Rocky Mountains N. America Atlantic Gulf of Ocean Mexico Caribbean
Tropical Moist Rainforest
 Tropical or Lowlatitude Climates: Controlled by equatorial tropical air masses Tropical Moist Rainforest Rainfall is heavy in all months - more than 250 cm. (100 in.). Common temperatures of 27 C (80 F)
Satellites, Weather and Climate Module??: Polar Vortex
 Satellites, Weather and Climate Module??: Polar Vortex SWAC Jan 2014 AKA Circumpolar Vortex Science or Hype? Will there be one this year? Today s objectives Pre and Post exams What is the Polar Vortex
lecture 11 El Niño/Southern Oscillation (ENSO) Part II
 Part II") lecture 11 El Niño/Southern Oscillation (ENSO) Part II SYSTEM MEMORY: OCEANIC WAVE PROPAGATION ASYMMETRY BETWEEN THE ATMOSPHERE AND OCEAN The atmosphere and ocean are not symmetrical in their responses
lecture 11 El Niño/Southern Oscillation (ENSO) Part II SYSTEM MEMORY: OCEANIC WAVE PROPAGATION ASYMMETRY BETWEEN THE ATMOSPHERE AND OCEAN The atmosphere and ocean are not symmetrical in their responses
ATOC 5051 INTRODUCTION TO PHYSICAL OCEANOGRAPHY. Lecture 2
 ATOC 5051 INTRODUCTION TO PHYSICAL OCEANOGRAPHY Lecture 2 Ocean basins and relation to climate Learning objectives: (1)What are the similarities and differences among different ocean basins? (2) How does
Global Ocean Monitoring: Recent Evolution, Current Status, and Predictions
 Global Ocean Monitoring: Recent Evolution, Current Status, and Predictions Prepared by Climate Prediction Center, NCEP November 6, 2009 http://www.cpc.ncep.noaa.gov/products/godas/ This project to deliver
UPDATE OF REGIONAL WEATHER AND SMOKE HAZE (September 2017)
") UPDATE OF REGIONAL WEATHER AND SMOKE HAZE (September 2017) 1. Review of Regional Weather Conditions in August 2017 1.1 Southwest Monsoon conditions continued to prevail in the region in August 2017. The
UPDATE OF REGIONAL WEATHER AND SMOKE HAZE (September 2017) 1. Review of Regional Weather Conditions in August 2017 1.1 Southwest Monsoon conditions continued to prevail in the region in August 2017. The
IMPACT OF GROUND-BASED GPS PRECIPITABLE WATER VAPOR AND COSMIC GPS REFRACTIVITY PROFILE ON HURRICANE DEAN FORECAST. (a) (b) (c)
 (b) (c)") 9B.3 IMPACT OF GROUND-BASED GPS PRECIPITABLE WATER VAPOR AND COSMIC GPS REFRACTIVITY PROFILE ON HURRICANE DEAN FORECAST Tetsuya Iwabuchi *, J. J. Braun, and T. Van Hove UCAR, Boulder, Colorado 1. INTRODUCTION
9B.3 IMPACT OF GROUND-BASED GPS PRECIPITABLE WATER VAPOR AND COSMIC GPS REFRACTIVITY PROFILE ON HURRICANE DEAN FORECAST Tetsuya Iwabuchi *, J. J. Braun, and T. Van Hove UCAR, Boulder, Colorado 1. INTRODUCTION
Forecasting sea state with a spectral wave model Rogue Waves 2004, Brest
 Forecasting sea state with a spectral wave model Rogue Waves 2004, Brest Martin Holt 22 October 2004 www.metoffice.gov.uk Crown copyright 2004 Page 1 Wave Modelling at the Met Office Operational wave models
Forecast of Nearshore Wave Parameters Using MIKE-21 Spectral Wave Model
 Forecast of Nearshore Wave Parameters Using MIKE-21 Spectral Wave Model Felix Jose 1 and Gregory W. Stone 2 1 Coastal Studies Institute, Louisiana State University, Baton Rouge, LA 70803 2 Coastal Studies
FOWPI Metocean Workshop Modelling, Design Parameters and Weather Windows
 FOWPI Metocean Workshop Modelling, Design Parameters and Weather Windows Jesper Skourup, Chief Specialist, COWI 1 The Project is funded by The European Union Agenda 1. Metocean Data Requirements 2. Site
AP Human Geography World Atlas Project
 AP Human Geography World Atlas Project - 2018 Welcome to Robert E. Lee High School and Advanced Placement Human Geography! You are going to thoroughly enjoy this class. It will be a lot of work, but the
The Improvement of JMA Operational Wave Models
 The Improvement of JMA Operational Wave Models Toshiharu Tauchi Nadao Kohno * Mika Kimura Japan Meteorological Agency * (also) Meteorological Research Institute, JMA 10 th International Workshop on Wave
Latitude and Longitude. Begin
 Latitude and Longitude Begin The Earth is divided in two halves, the top half is called the northern hemisphere, and the bottom half is called the southern hemisphere. The dividing line between the two
A simple method for seamless verification applied to precipitation hindcasts from two global models
 A simple method for seamless verification applied to precipitation hindcasts from two global models Matthew Wheeler 1, Hongyan Zhu 1, Adam Sobel 2, Debra Hudson 1 and Frederic Vitart 3 1 Bureau of Meteorology,
A look at forecast capabilities of modern ocean wave models
 A look at forecast capabilities of modern ocean wave models Jean-Raymond Bidlot European Centre for Medium-range Weather Forecasts (ECMWF) Jean.bidlot@ecmwf.int Waves breaking on the sea front in Ardrossan,
1 What Is Climate? TAKE A LOOK 2. Explain Why do areas near the equator tend to have high temperatures?
 CHAPTER 17 1 What Is Climate? SECTION Climate BEFORE YOU READ After you read this section, you should be able to answer these questions: What is climate? What factors affect climate? How do climates differ
f r o m a H i g h - R e s o l u t i o n I c e - O c e a n M o d e l
 Circulation and Variability in the Western Arctic Ocean f r o m a H i g h - R e s o l u t i o n I c e - O c e a n M o d e l Jeffrey S. Dixon 1, Wieslaw Maslowski 1, Jaclyn Clement 1, Waldemar Walczowski
An evaluation of ocean wave model performances with linear and nonlinear dissipation source terms in Lake Erie
 An evaluation of ocean wave model performances with linear and nonlinear dissipation source terms in Lake Erie Roop Lalbeharry 1, Arno Behrens 2, Heinz Guenther 2 and Laurie Wilson 1 1 Meteorological Service
Climate Outlook for December 2015 May 2016
 The APEC CLIMATE CENTER Climate Outlook for December 2015 May 2016 BUSAN, 25 November 2015 Synthesis of the latest model forecasts for December 2015 to May 2016 (DJFMAM) at the APEC Climate Center (APCC),
NWS Operational Marine and Ocean Forecasting. Overview. Ming Ji. Ocean Prediction Center National Weather Service/NCEP. CIOSS/CoRP
 NWS Operational Marine and Ocean Forecasting Overview Ming Ji Ocean Prediction Center National Weather Service/NCEP CIOSS/CoRP CoRP Symposium Corvallis, OR Aug. 12-13, 13, 2008 Titanic Telegram Marine
Research Article Long-Term Variability of Extreme Significant Wave Height in the South China Sea
 Advances in Meteorology Volume, Article ID 933, pages http://dx.doi.org/.//933 Research Article Long-Term Variability of Extreme Significant Wave Height in the South China Sea Adekunle Osinowo, Xiaopei
Global Circulation. Local weather doesn t come from all directions equally Everyone s weather is part of the global circulation pattern
 Global Circulation Local weather doesn t come from all directions equally Everyone s weather is part of the global circulation pattern Wind rose shows % frequency of winds around the compass 1 Global Circulation
Percentage of normal rainfall for August 2017 Departure from average air temperature for August 2017
 New Zealand Climate Update No 219, August 2017 Current climate August 2017 Overall, mean sea level pressure was lower than normal over and to the west of New Zealand during August while higher than normal
Polar Weather Prediction
 Polar Weather Prediction David H. Bromwich Session V YOPP Modelling Component Tuesday 14 July 2015 A special thanks to the following contributors: Kevin W. Manning, Jordan G. Powers, Keith M. Hines, Dan
Time allowed: 1 hour 30 minutes
 SPECIMEN ASSESSMENT MATERIAL GCSE GEOGRAPHY Paper 1 Living with the physical environment Specimen Materials For this paper you must have: a pencil a ruler. Time allowed: 1 hour 30 minutes Instructions
Physical Oceanography OEAS 405/505 Fall 2013
 Physical Oceanography OEAS 405/505 Fall 2013 Instructor: Prof. Tal Ezer http://www.ccpo.odu.edu/facstaff/faculty/tezer/ezer.html Office: CCPO, Innovation Research Park Bldg. #1 4111 Monarch Way, Room 3217
MailASail Automatic Weather Responder
 MailASail Automatic Weather Responder About: This weather service is a simple system to offer popular weather forecasts and charts by email. Our goal is to provide a deliberately limited subset of all
Computational challenges in Numerical Weather Prediction
 Computational challenges in Numerical Weather Prediction Mike Cullen Oxford 15 September 2008 Contents This presentation covers the following areas Historical background Current challenges Why does it
HYBRID GODAS STEVE PENNY, DAVE BEHRINGER, JIM CARTON, EUGENIA KALNAY, YAN XUE
 STEPHEN G. PENNY UNIVERSITY OF MARYLAND (UMD) NATIONAL CENTERS FOR ENVIRONMENTAL PREDICTION (NCEP) HYBRID GODAS STEVE PENNY, DAVE BEHRINGER, JIM CARTON, EUGENIA KALNAY, YAN XUE NOAA CLIMATE REANALYSIS
COMPARISON OF GULF OF MEXICO WAVE INFORMATION STUDIES (WIS) 2-G HINDCAST WITH 3-G HINDCASTING Barbara A. Tracy and Alan Cialone
 2-G HINDCAST WITH 3-G HINDCASTING Barbara A. Tracy and Alan Cialone") COMPARISON OF GULF OF MEXICO WAVE INFORMATION STUDIES (WIS) 2-G HINDCAST WITH 3-G HINDCASTING Barbara A. Tracy and Alan Cialone Engineer Research and Development Center Coastal and Hydraulics Laboratory
COMPARISON OF GULF OF MEXICO WAVE INFORMATION STUDIES (WIS) 2-G HINDCAST WITH 3-G HINDCASTING Barbara A. Tracy and Alan Cialone Engineer Research and Development Center Coastal and Hydraulics Laboratory
Polar Lows and other High Latitude Weather Systems. John Turner and Tom Bracegirdle British Antarctic Survey Cambridge, UK
 Polar Lows and other High Latitude Weather Systems John Turner and Tom Bracegirdle British Antarctic Survey Cambridge, UK A mosaic of infra-red satellite imagery of the Antarctic and Southern Ocean on
The MSC Beaufort Wind and Wave Reanalysis
 The MSC Beaufort Wind and Wave Reanalysis Val Swail Environment Canada Vincent Cardone, Brian Callahan, Mike Ferguson, Dan Gummer and Andrew Cox Oceanweather Inc. Cos Cob, CT, USA Introduction: History
C
 C 0.8 0.4 0.2 0.0-0.2-0.6 Fig. 1. SST-wind relation in the North Pacific and Atlantic Oceans. Left panel: COADS SST (color shade), surface wind vectors, and SLP regressed upon the Pacific Decadal Oscillation
Performance of the ocean wave ensemble forecast system at NCEP 1
 Performance of the ocean wave ensemble forecast system at NCEP 1 Degui Cao 2,3, Hendrik L. Tolman, Hsuan S.Chen, Arun Chawla 2 and Vera M. Gerald NOAA /National Centers for Environmental Prediction Environmental
Wave simulation using SWAN in nested and unnested mode applications
 www.ec.gc.ca Wave simulation using SWAN in nested and unnested mode applications Roop Lalbeharry 1 and Hal Ritchie 2 Environment Canada, Science and Technology Branch 1 Meteorological Research Division,
Pacific Hindcast Performance Evaluation Of Three Numerical Wave Models
 Pacific Hindcast Performance Evaluation Of Three Numerical Wave Models US Army Engineer Research and Development Center Jeff Hanson Barbara Tracy US Army Corps of Engineers Hendrik Tolman SAIC-GSO at NOAA
Recent warming and changes of circulation in the North Atlantic - simulated with eddy-permitting & eddy-resolving models
 Recent warming and changes of circulation in the North Atlantic - simulated with eddy-permitting & eddy-resolving models Robert Marsh, Beverly de Cuevas, Andrew Coward & Simon Josey (+ contributions by
Ocean Monitoring and Forecasting core services,
 MY OCEAN Marine Core Service Ocean Monitoring and Forecasting core services, the MyOcean example Pierre BAHUREL MyOcean coordinator Mercator Ocean, France Session 5B "The way forward: delivering societal
Robert Weaver, Donald Slinn 1
 1 1 Robert Weaver, Donald Slinn 1 Department of Civil and Coastal Engineering, University of Florida, Gainesville, Florida Supported by the US Office of Naval Research AGU Fall Meeting 2002 Poster OS72A-0342
Latitude & Longitude. Worksheets & activities to teach latitude & longitude. Includes notes, activities, review & all answer keys. 11 pages!
 Latitude & Longitude Worksheets & activities to teach latitude & longitude. Includes notes, activities, review & all answer keys. 11 pages! Lines of Latitude & Longitude Name: Lines of latitude and longitude
P Hurricane Danielle Tropical Cyclogenesis Forecasting Study Using the NCAR Advanced Research WRF Model
 P1.2 2004 Hurricane Danielle Tropical Cyclogenesis Forecasting Study Using the NCAR Advanced Research WRF Model Nelsie A. Ramos* and Gregory Jenkins Howard University, Washington, DC 1. INTRODUCTION Presently,
August Forecast Update for Atlantic Hurricane Activity in 2012
 August Forecast Update for Atlantic Hurricane Activity in 2012 Issued: 6 th August 2012 by Professor Mark Saunders and Dr Adam Lea Dept. of Space and Climate Physics, UCL (University College London), UK
Importance of air-sea interaction on the coupled typhoon-wave-ocean modeling
 Importance of air-sea interaction on the coupled typhoon-wave-ocean modeling Collaborators: I. Ginis (GSO/URI) T. Hara (GSO/URI) B. Thomas (GSO/URI) H. Tolman (NCEP/NOAA) IL-JU MOON ( 文一柱 ) Cheju National
WIND GENERATED OCEAN WAVES IAN R. YOUNG
 ELSEVIER OCEAN ENGINEERING BOOR SERIES VOLUME 2 WIND GENERATED OCEAN WAVES IAN R. YOUNG University of Adelaide, Australia OCEAN ENGINEERING SERIES EDITORS R. Bhattacharyya & M.E. McCormick 1999 ELSEVIER
Hindcast Arabian Gulf
 Hindcast Arabian Gulf Image of isobars of atmospheric pressure and hindcast wind- and wave field over the Arabian Gulf during a storm in January 1993. Detailed wave studies are supported by nesting of
Dr Marc Lucas CLS Toulouse, France.
 Dr Marc Lucas CLS Toulouse, France. Oceanology International 15th March 2012 Slide 1 Ocean depiction In the past: Information mainly comes from in situ measurements (ADCP) Now: The role of satellite data
Major Domain of the Earth
 Major Domain of the Earth The surface of the earth is a complex zone in which three main components of the environment meet, overlap and interact. The solid portion of the earth on which we live is called
Frank Revitte National Weather Service. Weather Forecast Office New Orleans/Baton Rouge
 Frank Revitte National Weather Service Weather Forecast Office New Orleans/Baton Rouge Above normal activity 17 Total Named Storms 7 Tropical Storms 4 Hurricanes 6 Major Hurricanes Not the most active,
D) 15 N, 160 W A) prevailing wind direction
 15 N, 160 W A) prevailing wind direction") Base your answers to questions 1 and 2 on the diagram below, which represents latitude and longitude lines on Earth. Points A through E represent locations on Earth. Arrows represent direction of rotation.
Base your answers to questions 1 and 2 on the diagram below, which represents latitude and longitude lines on Earth. Points A through E represent locations on Earth. Arrows represent direction of rotation.
Climate Outlook for March August 2017
 The APEC CLIMATE CENTER Climate Outlook for March August 2017 BUSAN, 24 February 2017 Synthesis of the latest model forecasts for March to August 2017 (MAMJJA) at the APEC Climate Center (APCC), located
A High-Resolution Future Wave Climate Projection for the Coastal Northwestern Atlantic
 A High-Resolution Future Wave Climate Projection for the Coastal Northwestern Atlantic Adrean WEBB 1, Tomoya SHIMURA 2 and Nobuhito MORI 3 1 Project Assistant professor, DPRI, Kyoto University (Gokasho,
Unit 1: Geography. For additional information, refer to this website: 1 G e o g r a p h y
 Unit 1: Geography For additional information, refer to this website: http://mryoungtms.weebly.com/ 1 G e o g r a p h y Continents and Oceans SOL USI. 2a Essential Understanding: Continents are large land
NWS 13: NetCDF Wind/Pressure Inputs for ADCIRC
 NWS 13: NetCDF Wind/Pressure Inputs for ADCIRC Alex Crosby Oceanweather Inc. Casey Dietrich NC State University 2018 ADCIRC User s Group Meeting Summary Motivation NetCDF Structure/Schema Implementation
1. INTRODUCTION: 2. DATA AND METHODOLOGY:
 27th Conference on Hurricanes and Tropical Meteorology, 24-28 April 2006, Monterey, CA 3A.4 SUPERTYPHOON DALE (1996): A REMARKABLE STORM FROM BIRTH THROUGH EXTRATROPICAL TRANSITION TO EXPLOSIVE REINTENSIFICATION
Validation of operational global wave prediction models with spectral buoy data
 Calhoun: The NPS Institutional Archive DSpace Repository Theses and Dissertations 1. Thesis and Dissertation Collection, all items 2001-12 Validation of operational global wave prediction models with spectral
Chapter 24 Tropical Cyclones
 Chapter 24 Tropical Cyclones Tropical Weather Systems Tropical disturbance a cluster of thunderstorms about 250 to 600 km in diameter, originating in the tropics or sub-tropics Tropical depression a cluster
CORDEX domains for model integrations (updated on 17/06/13)
") CORDEX domains for model integrations (updated on 17/06/13) This note presents the regions used for the CORDEX regional climate model integrations project and defines the RCM interior domain, i.e. the
CORDEX domains for model integrations (updated on 17/06/13) This note presents the regions used for the CORDEX regional climate model integrations project and defines the RCM interior domain, i.e. the
The NCAR CAM 3 simulation error of Arctic Sea Level Pressure
 The NCAR CAM 3 simulation error of Arctic Sea Level Pressure Muhtarjan Osman and Richard Grotjahn Department of Land, Air and Water Resources University of California, Davis Supported by NSF grant 0354545
A Community Terrain-Following Ocean Modeling System (ROMS)
") DISTRIBUTION STATEMENT A. Approved for public release; distribution is unlimited. A Community Terrain-Following Ocean Modeling System (ROMS) PI: Hernan G. Arango Department of Marine and Coastal Sciences,
DISTRIBUTION STATEMENT A. Approved for public release; distribution is unlimited. A Community Terrain-Following Ocean Modeling System (ROMS) PI: Hernan G. Arango Department of Marine and Coastal Sciences,
How do we describe a location on Earth? Geodetic reference system
 How do we describe a location on Earth? Geodetic reference system How do we define the shape of the earth? Definition of the sphere: A three-dimensional surface, all points of which are equidistant from
Relationship between typhoon activity in the northwestern Pacific and the upper-ocean heat content on interdecadal time scale
 !"#$%&' JOURNAL OF TROPICAL OCEANOGRAPHY 2010 ( ) 29 * ) 6 +,8!14!!"#$% http://jto.scsio.ac.cn; http://www.jto.ac.cn *!"# 1,2, $% 2 (1., 510301; 2., 00852) : Joint Typhoon Warning Center 1945 2003 (5"
The Mediterranean Operational Oceanography Network (MOON): Products and Services
: Products and Services") The Mediterranean Operational Oceanography Network (MOON): Products and Services The MOON consortia And Nadia Pinardi Co-chair of MOON Istituto Nazionale di Geofisica e Vulcanologia Department of Environmental
The Mediterranean Operational Oceanography Network (MOON): Products and Services The MOON consortia And Nadia Pinardi Co-chair of MOON Istituto Nazionale di Geofisica e Vulcanologia Department of Environmental
Verification of DMI wave forecasts 1st quarter of 2003
 DANISH METEOROLOGICAL INSTITUTE TECHNICAL REPORT - Verification of DMI wave forecasts st quarter of Jacob Woge Nielsen dmi.dk Copenhagen ISSN -X ISSN - (trykt) (online) Verification of DMI wave forecasts
Dr. M.K.K. Arya Model School Class-V, Social Science Assignment Ch-1, Globe The Model of the Earth Answer the following:- Q.1.
 Class-V, Social Science Assignment Ch-1, Globe The Model of the Earth - Q.1. What are the disadvantages/demerits of a globe? Ans. Some disadvantages of globe are: a) It is difficult to carry. b) It cannot
Chapter 1 Test on Geography Skills
 Name Score Chapter 1 Test on Geography Skills Part 1 Matching (14 pts.) Match each term in Column B with its correct definition in Column A by clearly writing the number in the blank space provided. Two
The surface of the ocean floor is as varied as the land. The five major oceans, from largest to smallest, are
 11.1 Ocean Basins The surface of the ocean floor is as varied as the land. The five major oceans, from largest to smallest, are w the Pacific w the Atlantic w the Indian w the Southern w the Arctic The
Impact of Eurasian spring snow decrement on East Asian summer precipitation
 Impact of Eurasian spring snow decrement on East Asian summer precipitation Renhe Zhang 1,2 Ruonan Zhang 2 Zhiyan Zuo 2 1 Institute of Atmospheric Sciences, Fudan University 2 Chinese Academy of Meteorological
Development of Operational Storm Surge Guidance to Support Total Water Predictions
 Development of Operational Storm Surge Guidance to Support Total Water Predictions J. Feyen 1, S. Vinogradov 1,2, T. Asher 3, J. Halgren 4, Y. Funakoshi 1,5 1. NOAA/NOS//Development Laboratory 2. ERT,