The Looming Threat of Rising Sea Levels to the Florida Keys
|
|
|
- Juliana Sparks
- 5 years ago
- Views:
Transcription
1 The Looming Threat of Rising Sea Levels to the Florida Keys 1. Introduction Sea levels are rising, and possibly faster than we thought before. In a recent report in 2017 by the National Oceanic and Atmospheric Administration (NOAA), estimates for sea level rise over the next 100 years have appeared to double since the last estimates in The report claims that the average sea level will rise somewhere between 1 foot at the lower end of their anticipated range and 3 feet near the higher end. While not all coastal communities will be adversely affected by this rise, the Florida Keys (a low-lying chain of islands off the southern coast of Florida) could be totally submerged in the next few centuries. In this study, we are observing how the main islands will be affected by both the low and high-end estimates that NOAA has produced. 2. Methodology In order to evaluate the extent flooding within the Florida Keys, I will have to do an analysis on the effects of sea level based the topography and elevation of the islands. In order to do this, I am mainly using tools from the Spatial Analyst ArcGIS toolbox. 2.1 Data Collection The data used in this project was collected from several different sources. The National Centers for Environmental Information (NOAA) provided the digital elevation models from which all of my calculations (section 2.3) were made, and the US Census Bureau provided the polygons of the islands that I was working on. NOAA Sea Level Rise Viewer DEM Cell size: 16.4 ft, Vertical Accuracy: 10 cm. Used for raster calculations arch/ , , , US Census Places Used for polygons of islands provided land measurements ayergroup=places US Census Florida Roads/Highways Used purely for visual aid ayergroup=roads US Water Polygons Used for labeling bodies of water d=1630b19fafbe4c d967e Data Preprocessing The NOAA Sea Level DEM s were downloaded as seven separate rasters. The website allows the user to select the projection, datum, and file format prior to downloading as seen in Figure 1. In order to more easily manage the DEM data, I first used the Mosaic To New Raster tool in the Data Management toolbox. This tool allowed me to combine the seven separate rasters into one. The resulting raster was

2 very large, so I generated pyramids in order to render the images more quickly. Figure 1: NOAA Data Viewer provides an easy to use downloading wizard. The US Census Places and Roads/Highways downloads provided me with shapefiles of the major islands in the Florida Keys and the highway passing through them. The shapefile was referenced to the NAD83 datum, and after placing it into arcmaps I was able to do a projection to the Florida State Plane as used for the DEM data. No further pre-processing was needed. The US Water Polygon was easily downloaded from ESRI as a shapefile referenced to WGS After being projected to NAD 83 Florida State Plane, no further pre-processing was required. 2.3 Data Processing & Analysis Hillshade My first step in order to make the maps more visually appealing was to create a hillshade from the DEM data. Using the Hillshade tool in the Spatial Analyst toolbox (Figure 2), I was able to generate a shaded relief raster of the DEM data. The source of illumination was kept on the default setting. I repeated this for each of the 3 elevations that are described later in the Raster Calculations section. Figure 2: The Hillshade tool provides a shaded relief from the DEM surface raster. Clipping My first step, which isn t necessarily clipping, was to reduce the Places shapefile to only the islands I was interested in. The Place shapefile included all places in florida recorded by the US census, and since I was only interested in the islands, I manually selected the 13 islands available and extracted them from the Place shapefile then saved them as their own shapefile. This allowed me to easily navigate the attribute table in order to gather the data used for the excel calculations. In order to speed up the raster calculation described in the following section, I clipped the DEM raster to the Places shapefile so that the calculation would only be performed within the areas of interest. In order to do this, I used the Extract By Mask tool (Figure 3) in the Spatial Analyst toolbox. After the raster calculations (as described in the following section) I then had to clip all three sea level rasters (msl, 1ft rise, and 3 ft rise) to each Place in order to calculate the area of the land covered by water.


3 Figure 3: The Extract By Mask tool allows you to clip a raster to a polygon. This process was also conducted using the Extract by Mask tool, but before using the tool I had to select which Place I was clipping to. Once selected, the Extract by Mask tool only clipped to the selected Place rather than the entire Place shapefile. I repeated this step for each island and for each of the 3 sea level rasters, resulting in 39 new rasters. Contour For each of the three DEM s I would be using, I created a single contour at sealevel (0 ft) in order to more clearly display the outline of the land that was still above sea level. This was done using the Contour tool in the Spatial Analyst toolbox. Raster Calculations The rasters used for the calculations were produced using the Raster Calculator tool in the Spatial Analyst toolbox. The first step I took was to create two more elevation rasters, one 1 ft below the original, and one 3 ft below. To do this, I used the Raster Calculator and subtracted 1 (and 3) from the original DEM (Figure 4). This produced two rasters that were 1 and 3 feet below the original. Figure 4: By subtracting 1 from the original DEM, the Raster Calculator tool produced a raster with 1 foot subtracted from all of the cells of the original. The next step was to create binary rasters that would represent the sea level at today s mean sea level (msl) and then 1 and 3 ft above the msl (Figure 5). In order to do this, I created three binary rasters. Each raster was produced using the Raster Calculator tool. The input Con( DEM_X <= 0,1) produces a raster that has the value of 1 in all cells that are less than or equal to 0 ft on the DEM (below sea level). Figure 5: The Raster Calculator was used to create binary rasters for each sealevel, producing a raster that only had values where the land was beneath 0 ft. Symbology The vertical data in the DEM ranged from ft to 45 ft (the 45 ft cell seemed to be an outlier and could not be located on the map). Most of the data was below 5 ft. Because of the outlier, I chose to
4 use a classified symbology (Figure 6). I classified it manually, using values in ½ foot increments from to 5+. This resulted in the most visually appealing color scheme for the elevation models. I then increased the transparency to 40% so you can see the hillshade beneath for a 3D effect. After creating the first symbology, I saved it as a template to easily be used on the other DEM s. The Hillshade rasters were already symbolized using a standard deviation stretch, but I reduced the standard deviation to 2 (down from 2.5) in order to increase the contrast. The binary rasters for the different sea levels that I created were symbolized a dark blue and the transparency was turned up to 50% so you can see the submerged DEM and hillshade. I made the symbology for the water shapefile (from the US Water Polygons) have no color, because I was only using it for its labels. The labels were colored Apatite Blue to stand out from the dark blue used for the binary raster. I chose for the Places symbology to be a white line with a hollow area to show the outline of the island that is selected. The roads were symbolized using a default road symbol in the ESRI database. the dimensions of the raster cells (16.4 ft x 16.4 ft). This gave me an area in sq. ft of each island, which I then converted to sq. miles. After this, I subtracted my calculated are of water from the total area in each Place (land + water) to get the new area of land. I then calculated the percent land lost by subtracting the current amount of land from the original, then divided by the original amount of land. The results of this are shown in Table Conclusion By the looks of it, the Florida Keys have a very grim future. Even if water levels only rise by the low estimate of 1 ft, total land lost will reach nearly 75%, with some islands losing over 90%, and others losing as little as 35%. But if the sea rises by the high estimate of 3 ft, the Florida Keys will essentially vanish. Total land loss will be nearly 98%. All islands will be at least 90% submerged, and many of the islands will be almost 99% underwater. The following maps on pages 6-18 show the extent of the flooding. Each map has 3 panels focusing on one island, showing the present conditions and what the island would look like after 1 ft and 3ft of sea level rise. Analysis After all of the binary rasters for sea level were clipped to the island boundaries, I was then able to begin my calculation in Excel. Land and sea areas were provided in the attribute table of Places. This gave me a total area for each Place. I then calculated the area of each island covered in water by multiplying the number of cells that had a value of 1 (below sea level) and multiplying that number by

5 Island Land Area (sq. mi) Percent Land Loss Present 1 ft Water 3 ft Water 1 ft Water 3 ft Water Key West Stock Island Big Coppitt Key Cudjoe Key Big Pine Key Key Colony Beach Duck Key Layton Islamorada, Village of Island North Total Table 1: Effect of rising sea waters on the islands of the Florida Keys recognized in the US Census.


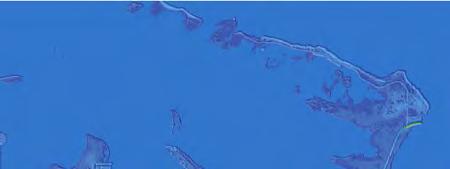
6 Key West 1:120,000 Stock Island Stock Island Stock Island Key West Key West Key West Total Land Area msl (sq. mi): 5.60 Percent Submerged (1 ft): 49.53% Percent Submerged (3 ft): 96.88% Contour_DEM_mos1


7 Stock Island 1:45,000 Key West Key West Key West Stock Island Stock Island Stock Island Total Land Area msl (sq. mi): 0.84 Percent Submerged (1 ft): 80.29% Percent Submerged (3 ft): 99.56% Contour_DEM_mos1


: 81.")


8 Big Coppitt Key 1:45,000 Big Coppitt Key Big Coppitt Key Big Coppitt Key Total Land Area msl (sq. mi): 1.15 Percent Submerged (1 ft): 81.68% Percent Submerged (3 ft): 99.90% Contour_DEM_mos1


9 Cudjoe Key 1:100,000 Cudjoe Key Cudjoe Key Cudjoe Key Total Land Area msl (sq. mi): 5.17 Percent Submerged (1 ft): 93.41% Percent Submerged (3 ft): 99.75% Contour_DEM_mos1


: 10.")


: 99.")
10 Big Pine Key 1:106,000 Big Pine Key Big Pine Key Big Pine Key Total Land Area msl (sq. mi): Percent Submerged (1 ft): 90.22% Percent Submerged (3 ft): 99.93% Contour_DEM_mos1
11 Duck Key 1:247,000 Key Colony Beach Duck Key Key Colony Beach Duck Key Key Colony Beach Total Land Area msl (sq. mi): 8.44 Percent Submerged (1 ft): 74.46% Percent Submerged (3 ft): 99.84%


12 Key Colony Beach 1:27,000 Key Colony Beach Key Colony Beach Key Colony Beach Total Land Area msl (sq. mi): 0.44 Percent Submerged (1 ft): 36.10% Percent Submerged (3 ft): 99.97%


13 Duck Key 1:55,000 Duck Key Duck Key Duck Key Total Land Area msl (sq. mi): 0.60 Percent Submerged (1 ft): 61.73% Percent Submerged (3 ft): 98.19%


: 0.")
:")
14 Layton 1:14,000 Layton Layton Layton Total Land Area msl (sq. mi): 0.17 Percent Submerged (1 ft): 91.16% Percent Submerged (3 ft): 99.98%


: 6.")


15 Islamorda, Village of Islands Florida Bay 1:268,000 Florida Bay Florida Bay Total Land Area msl (sq. mi): 6.44 Percent Submerged (1 ft): 60.86% Percent Submerged (3 ft): 97.49%


: 2.")


: 98.")
16 :79,000 Florida Bay Florida Bay Florida Bay Total Land Area msl (sq. mi): 2.51 Percent Submerged (1 ft): 69.98% Percent Submerged (3 ft): 98.15%


17 :207,000 Barnes Sound Barnes Sound Barnes Sound North North North Florida Bay Blackwater Sound Florida Bay Blackwater Sound Florida Bay Blackwater Sound Total Land Area msl (sq. mi): Percent Submerged (1 ft): 67.14% Percent Submerged (3 ft): 93.22%


: 18.")
:")
:")
18 North Biscayne Bay Biscayne Bay 1:183,000 Biscayne Bay Card Sound Card Sound Card Sound North North North Barnes Sound Barnes Sound Barnes Sound Blackwater Sound Blackwater Sound Blackwater Sound Total Land Area msl (sq. mi): Percent Submerged (1 ft): 77.42% Percent Submerged (3 ft): 98.39%
Sea Level Scare in South Carolina. by William Witmer GEO 327G 5 December 2016
 Sea Level Scare in South Carolina by William Witmer GEO 327G 5 December 2016 Problem Hilton Head Island in South Carolina attracts 2.5 million tourists every year. This popular locale features endangered
Effects of Rising Sea Levels on Coral Reef and Mangrove Distributions along the Great Barrier Reef in Australia
 Effects of Rising Sea Levels on Coral Reef and Mangrove Distributions along the Great Barrier Reef in Australia Sarah Barfield Graduate Student Department of Integrative Biology University of Texas, Austin
Goodbye Galveston. The Effects of Rising Sea Level on the. Coast of Galveston, TX. Maria Reistroffer GEO 327G
 Goodbye The Effects of Rising Sea Level on the Coast of, TX Maria Reistroffer GEO 327G 12/3/2015 Problem: Greenhouse gases contribute to global sea level rise and threaten human life, property, wildlife
The Geodatabase Working with Spatial Analyst. Calculating Elevation and Slope Values for Forested Roads, Streams, and Stands.
 GIS LAB 7 The Geodatabase Working with Spatial Analyst. Calculating Elevation and Slope Values for Forested Roads, Streams, and Stands. This lab will ask you to work with the Spatial Analyst extension.
Sea Level Rise and Manhattan
 University of Texas at Austin Sea Level Rise and Manhattan How Climate Change Will Impact a Climate Denier, Bigly Nicholaides, Kindra 12-5-2016 Introduction: Manhattan is home to 1.6 million people and
Outcrop suitability analysis of blueschists within the Dry Lakes region of the Condrey Mountain Window, North-central Klamaths, Northern California
 Outcrop suitability analysis of blueschists within the Dry Lakes region of the Condrey Mountain Window, North-central Klamaths, Northern California (1) Introduction: This project proposes to assess the
Volcanic Hazard Assessment of Southern Iceland Helper, GIS 327G
 Raeann Garcia 05/03/2018 Volcanic Hazard Assessment of Southern Iceland Helper, GIS 327G Introduction: Iceland is an island nation far in the northern hemisphere, with a portion of the country included
Calhoun County, Texas Under 5 Meter Sea Level Rise
 Kyle Kacal GEO 327G Calhoun County, Texas Under 5 Meter Sea Level Rise PROBLEM AND PURPOSE: Sea level rise is threat to all coastal areas. Although natural sea level rise happens at a very slow rate, hurricanes
Determining the Location of the Simav Fault
 Lindsey German May 3, 2012 Determining the Location of the Simav Fault 1. Introduction and Problem Formulation: The issue I will be focusing on involves interpreting the location of the Simav fault in
Effects of sea level rise on shallow atolls in the South Pacific
 Tuvalu 2100 Effects of sea level rise on shallow atolls in the South Pacific Kristin Vollmann GEO 327GG December 3, 20100 INTRODUCTION Residents of the tiny island nation of Tuvalu, withh a maximumm elevation
Hydrology and Watershed Analysis
 Hydrology and Watershed Analysis Manual By: Elyse Maurer Reference Map Figure 1. This map provides context to the area of Washington State that is being focused on. The red outline indicates the boundary
In this exercise we will learn how to use the analysis tools in ArcGIS with vector and raster data to further examine potential building sites.
 GIS Level 2 In the Introduction to GIS workshop we filtered data and visually examined it to determine where to potentially build a new mixed use facility. In order to get a low interest loan, the building
GIS 2010: Coastal Erosion in Mississippi Delta
 1) Introduction Problem overview To what extent do large storm events play in coastal erosion rates, and what is the rate at which coastal erosion is occurring in sediment starved portions of the Mississippi
Key Processes
 Data Manipulation and Extraction Key Processes Key Processes Re-Projecting Data Selecting by Attributes Exporting Data Hillshade Reclassification Conversion of Raster to Vector Re-Projecting Data Purpose
Software requirements * :
 Title: Product Type: Developer: Target audience: Format: Software requirements * : Using GRACE to evaluate change in Greenland s ice sheet Part I: Download, import and map GRACE data Part II: View and
WORKING WITH DMTI DIGITAL ELEVATION MODELS (DEM)
") WORKING WITH DMTI DIGITAL ELEVATION MODELS (DEM) Contents (Ctrl-Click to jump to a specific page) Manipulating the DEM Step 1: Finding the DEM Tiles You Need... 2 Step 2: Importing the DEM Tiles into ArcMap...
WORKING WITH DMTI DIGITAL ELEVATION MODELS (DEM) Contents (Ctrl-Click to jump to a specific page) Manipulating the DEM Step 1: Finding the DEM Tiles You Need... 2 Step 2: Importing the DEM Tiles into ArcMap...
caused displacement of ocean water resulting in a massive tsunami. II. Purpose
 I. Introduction The Great Sumatra Earthquake event took place on December 26, 2004, and was one of the most notable and devastating natural disasters of the decade. The event consisted of a major initial
Creating Watersheds from a DEM
 Creating Watersheds from a DEM These instructions enable you to create watersheds of specified area using a good quality Digital Elevation Model (DEM) in ArcGIS 8.1. The modeling is performed in ArcMap
GeoWEPP Tutorial Appendix
 GeoWEPP Tutorial Appendix Chris S. Renschler University at Buffalo - The State University of New York Department of Geography, 116 Wilkeson Quad Buffalo, New York 14261, USA Prepared for use at the WEPP/GeoWEPP
Tutorial 8 Raster Data Analysis
 Objectives Tutorial 8 Raster Data Analysis This tutorial is designed to introduce you to a basic set of raster-based analyses including: 1. Displaying Digital Elevation Model (DEM) 2. Slope calculations
Lauren Jacob May 6, Tectonics of the Northern Menderes Massif: The Simav Detachment and its relationship to three granite plutons
 Lauren Jacob May 6, 2010 Tectonics of the Northern Menderes Massif: The Simav Detachment and its relationship to three granite plutons I. Introduction: Purpose: While reading through the literature regarding
Final Project: Geodatabase of Mule Mountains Area, southeastern Arizona
 R. Aisner 11/24/09 GEO 386G Final Project: Geodatabase of Mule Mountains Area, southeastern Arizona Project goal: Develop a geodatabase with vector and raster data for future data organization and analysis.
Geo 327G Semester Project. Landslide Suitability Assessment of Olympic National Park, WA. Fall Shane Lewis
 Geo 327G Semester Project Landslide Suitability Assessment of Olympic National Park, WA Fall 2011 Shane Lewis 1 I. Problem Landslides cause millions of dollars of damage nationally every year, and are
Watershed Delineation
 Watershed Delineation Jessica L. Watkins, University of Georgia 2 April 2009 Updated by KC Love February 25, 2011 PURPOSE For this project, I delineated watersheds for the Coweeta synoptic sampling area
The University of Texas at Austin. Icebox Model Projections for Sea Level Fall in the Gulf Coast and Caribbean Sea Region
 The University of Texas at Austin Icebox Model Projections for Sea Level Fall in the Gulf Coast and Caribbean Sea Region Lizzadro-McPherson, Daniel J. December 3rd, 2015 Introduction Many climate scientists
GIS IN ECOLOGY: ANALYZING RASTER DATA
 GIS IN ECOLOGY: ANALYZING RASTER DATA Contents Introduction... 2 Raster Tools and Functionality... 2 Data Sources... 3 Tasks... 4 Getting Started... 4 Creating Raster Data... 5 Statistics... 8 Surface
Introduction To Raster Based GIS Dr. Zhang GISC 1421 Fall 2016, 10/19
 Introduction To Raster Based GIS Dr. Zhang GISC 1421 Fall 2016, 10/19 Model of the course Using and making maps Navigating GIS maps Map design Working with spatial data Geoprocessing Spatial data infrastructure
Acknowledgments xiii Preface xv. GIS Tutorial 1 Introducing GIS and health applications 1. What is GIS? 2
 Acknowledgments xiii Preface xv GIS Tutorial 1 Introducing GIS and health applications 1 What is GIS? 2 Spatial data 2 Digital map infrastructure 4 Unique capabilities of GIS 5 Installing ArcView and the
Data Structures & Database Queries in GIS
 Data Structures & Database Queries in GIS Objective In this lab we will show you how to use ArcGIS for analysis of digital elevation models (DEM s), in relationship to Rocky Mountain bighorn sheep (Ovis
EnvSci 360 Computer and Analytical Cartography
 EnvSci 360 Computer and Analytical Cartography Lecture 7 Mapping Images, Surfaces, and 3-D Data Brief Overview of Imagery What is Imagery? A spatial data model that defines space as an array of equally
Outline Anatomy of ArcGIS Metadata Data Types Vector Raster Conversion Adding Data Navigation Symbolization Methods Layer Files Editing Help Files
 UPlan Training Lab Exercise: Introduction to ArcGIS Outline Anatomy of ArcGIS Metadata Data Types Vector Raster Conversion Adding Data Navigation Symbolization Methods Layer Files Editing Help Files Anatomy
Delineation of high landslide risk areas as a result of land cover, slope, and geology in San Mateo County, California
 Delineation of high landslide risk areas as a result of land cover, slope, and geology in San Mateo County, California Introduction Problem Overview This project attempts to delineate the high-risk areas
Exercise 4 Estimating the effects of sea level rise on coastlines by reclassification
 Exercise 4 Estimating the effects of sea level rise on coastlines by reclassification Due: Thursday February 1; at the start of class Goal: Get familiar with symbolizing and making time-series maps of
SLR Calculator: Sea Level Rise (SLR) Inundation Surface Calculator Add-in for ArcGIS Desktop & 10.4
 Inundation Surface Calculator Add-in for ArcGIS Desktop & 10.4") 1 SLR Calculator: Sea Level Rise (SLR) Inundation Surface Calculator Add-in for ArcGIS Desktop 10.3.1 & 10.4 Florida Sea Level Scenario Sketch Planning Tool Version 1.6, July 2016 University of Florida
1 SLR Calculator: Sea Level Rise (SLR) Inundation Surface Calculator Add-in for ArcGIS Desktop 10.3.1 & 10.4 Florida Sea Level Scenario Sketch Planning Tool Version 1.6, July 2016 University of Florida
GIS IN ECOLOGY: ANALYZING RASTER DATA
 GIS IN ECOLOGY: ANALYZING RASTER DATA Contents Introduction... 2 Tools and Functionality for Raster Data... 2 Data Sources... 3 Tasks... 4 Getting Started... 4 Creating Raster Data... 5 Summary Statistics...
Spatial Data Analysis in Archaeology Anthropology 589b. Kriging Artifact Density Surfaces in ArcGIS
 Spatial Data Analysis in Archaeology Anthropology 589b Fraser D. Neiman University of Virginia 2.19.07 Spring 2007 Kriging Artifact Density Surfaces in ArcGIS 1. The ingredients. -A data file -- in.dbf
Using Ice Thickness and Bed Topography to Pick Field Sites Near Swiss Camp, Greenland
 Lauren Andrews 6 May 2010 GEO 386G: GIS final project Using Ice Thickness and Bed Topography to Pick Field Sites Near Swiss Camp, Greenland Problem Formulation My primary goal for this project is to map
DATA APPLIANCE FOR ARCGIS
 DATA APPLIANCE FOR ARCGIS Data Appliance for ArcGIS Provides Access to Multi-Scale Basemaps Down to Medium Scale Levels Worldwide And Large Scale for Most of the World The Data Appliance includes Several
Working with Digital Elevation Models in ArcGIS 8.3
 Working with Digital Elevation Models in ArcGIS 8.3 The homework that you need to turn in is found at the end of this document. This lab continues your introduction to using the Spatial Analyst Extension
IMPERIAL COUNTY PLANNING AND DEVELOPMENT
 IMPERIAL COUNTY PLANNING AND DEVELOPMENT GEODATABASE USER MANUAL FOR COUNTY BUSINESS DEVELOPMENT GIS June 2010 Prepared for: Prepared by: County of Imperial Planning and Development 801 Main Street El
Exercise 12 Spatial Analysis on Antarctica
 Exercise 12 Spatial Analysis on Antarctica Due: Tuesday, March 6 Goal: Using ArcMap s Spatial Analyst tools for digital elevation models and rasters. Datasets: Bed elevation Ice thickness Surface elevation
Laboratory Exercise X Most Dangerous Places to Live in the United States Based on Natural Disasters
 Brigham Young University BYU ScholarsArchive Engineering Applications of GIS - Laboratory Exercises Civil and Environmental Engineering 2016 Laboratory Exercise X Most Dangerous Places to Live in the United
Watershed Analysis of the Blue Ridge Mountains in Northwestern Virginia
 Watershed Analysis of the Blue Ridge Mountains in Northwestern Virginia Mason Fredericks December 6, 2018 Purpose The Blue Ridge Mountain range is one of the most popular mountain ranges in the United
Exercise 6: Working with Raster Data in ArcGIS 9.3
 Exercise 6: Working with Raster Data in ArcGIS 9.3 Why Spatial Analyst? Grid query Grid algebra Grid statistics Summary by zone Proximity mapping Reclassification Histograms Surface analysis Slope, aspect,
Gravity and Magnetic Anomalies Compared to Moho Depth throughout the State of Texas
 Gravity and Magnetic Anomalies Compared to Moho Depth throughout the State of Texas Taylor Borgfeldt Introduction My Master s thesis is to improve and create additional crustal seismic velocity models
Global Atmospheric Circulation Patterns Analyzing TRMM data Background Objectives: Overview of Tasks must read Turn in Step 1.
 Global Atmospheric Circulation Patterns Analyzing TRMM data Eugenio Arima arima@hws.edu Hobart and William Smith Colleges Department of Environmental Studies Background: Have you ever wondered why rainforests
Land Cover Data Processing Land cover data source Description and documentation Download Use Use
 Land Cover Data Processing This document provides a step by step procedure on how to build the land cover data required by EnSim. The steps provided here my be long and there may be short cuts (like using
Delineation of Watersheds
 Delineation of Watersheds Adirondack Park, New York by Introduction Problem Watershed boundaries are increasingly being used in land and water management, separating the direction of water flow such that
Hazard Assessment of Lava Flows, Wildfires, and Tsunamis on the Big Island of Hawaii s population. By: Thomas Ditges
 Hazard Assessment of Lava Flows, Wildfires, and Tsunamis on the Big Island of Hawaii s population By: Thomas Ditges The Problem: The Big Island of Hawaii is the largest and most dangerous of the Hawaiian
Modeling Incident Density with Contours in ArcGIS Pro
 Modeling Incident Density with Contours in ArcGIS Pro By Mike Price, Entrada/San Juan, Inc. What you will need ArcGIS Pro 1.4 license or later ArcGIS Spatial Analyst license ArcGIS Online for organizational
Within this document, the term NHDPlus is used when referring to NHDPlus Version 2.1 (unless otherwise noted).
.") Exercise 7 Watershed Delineation Using ArcGIS Spatial Analyst Last Updated 4/6/2017 Within this document, the term NHDPlus is used when referring to NHDPlus Version 2.1 (unless otherwise noted). There
Exercise 7 Watershed Delineation Using ArcGIS Spatial Analyst Last Updated 4/6/2017 Within this document, the term NHDPlus is used when referring to NHDPlus Version 2.1 (unless otherwise noted). There
Spatial Analyst: Multiple Criteria Evaluation Material adapted from FOR 4114 developed by Forestry Associate Professor Steve Prisley
 Spatial Analyst: Multiple Criteria Evaluation Material adapted from FOR 4114 developed by Forestry Associate Professor Steve Prisley Section 1: Data In this exercise we will be working with several types
Software requirements * : Part III: 2 hrs.
 Title: Product Type: Developer: Target audience: Format: Software requirements * : Data: Estimated time to complete: Mapping snow cover using MODIS Part I: The MODIS Instrument Part II: Normalized Difference
Intro to GIS In Review
 Intro to GIS In Review GIS Analysis Winter 2016 GIS A quarter in review Geographic data types Acquiring GIS data Projections / Coordinate systems Working with attribute tables Data classification Map design
Title of Paper: Computational grid generation modeling transport of pathogens in Lake Michigan
 Title of Paper: Computational grid generation modeling transport of pathogens in Lake Michigan Authors Names: Peter N. Shedivy, Hector Bravo PhD Abstract: An estimated 1.2 million people, mostly young
Mapping Global Carbon Dioxide Concentrations Using AIRS
 Title: Mapping Global Carbon Dioxide Concentrations Using AIRS Product Type: Curriculum Developer: Helen Cox (Professor, Geography, California State University, Northridge): helen.m.cox@csun.edu Laura
Handling Raster Data for Hydrologic Applications
 Handling Raster Data for Hydrologic Applications Prepared by Venkatesh Merwade Lyles School of Civil Engineering, Purdue University vmerwade@purdue.edu January 2018 Objective The objective of this exercise
Working with Digital Elevation Models and Digital Terrain Models in ArcMap 9
 Working with Digital Elevation Models and Digital Terrain Models in ArcMap 9 1 TABLE OF CONTENTS INTRODUCTION...3 WORKING WITH DIGITAL TERRAIN MODEL (DTM) DATA FROM NRVIS, CITY OF KITCHENER, AND CITY OF
Image Services Providing Access to Scientific Data at NOAA/NCEI
 Image Services Providing Access to Scientific Data at NOAA/NCEI Jesse Varner Cooperative Institute for Research in Environmental Sciences (CIRES), University of Colorado John Cartwright NOAA National Centers
Population Affected by the Tsunami of the Tohoku Earthquake; March 11, 2011
 Population Affected by the Tsunami of the Tohoku Earthquake; March 11, 2011 Sosuke Ichihashi December 5, 2018 Background: On March 11, 2011 magnitude 9.0 earthquake occurred in the northeast of Japan,
PHYTOPLANKTON AGGREGATE EVENTS AND HOW THEY RELATE TO SEA SURFACE SLOPE
 PHYTOPLANKTON AGGREGATE EVENTS AND HOW THEY RELATE TO SEA SURFACE SLOPE Emily E. Anderson CE 394K.3 Fall 2015 4 December 2015 Objective Using skills gained in this ArcGIS class I wanted to create a map
Classification of Erosion Susceptibility
 GEO327G: GIS & GPS Applications in Earth Sciences Classification of Erosion Susceptibility Denali National Park, Alaska Zehao Xue 12 3 2015 2 TABLE OF CONTENTS 1 Abstract... 3 2 Introduction... 3 2.1 Universal
Preliminary Data Release for the Humboldt Bay Sea Level Rise Vulnerability Assessment: Humboldt Bay Sea Level Rise Inundation Mapping
 Preliminary Data Release for the Humboldt Bay Sea Level Rise Vulnerability Assessment: Humboldt Bay Sea Level Rise Inundation Mapping Prepared by: Jeff Anderson, Northern Hydrology & Engineering (jeff@northernhydrology.com)
Natalie Cabrera GSP 370 Assignment 5.5 March 1, 2018
 Network Analysis: Modeling Overland Paths Using a Least-cost Path Model to Track Migrations of the Wolpertinger of Bavarian Folklore in Redwood National Park, Northern California Natalie Cabrera GSP 370
Alaska, USA. Sam Robbins
 Using ArcGIS to determine erosion susceptibility within Denali National Park, Alaska, USA Sam Robbins Introduction Denali National Park is six million acres of wild land with only one road and one road
Exercise 5e: Estimating the impact of sea level rise in coastal areas of the United States and comparing to the impact in coastal Asia
 Exercise 5e: Estimating the impact of sea level rise in coastal areas of the United States and comparing to the impact in coastal Asia Data sets (downloaded in previous homework from the National Geophysical
ArcGIS Pro: Essential Workflows STUDENT EDITION
 ArcGIS Pro: Essential Workflows STUDENT EDITION Copyright 2018 Esri All rights reserved. Course version 6.0. Version release date August 2018. Printed in the United States of America. The information contained
GED 554 IT & GIS. Lecture 6 Exercise 5. May 10, 2013
 GED 554 IT & GIS Lecture 6 Exercise 5 May 10, 2013 Free GIS data sources ******************* Mapping numerical data & Symbolization ******************* Exercise: Making maps for presentation GIS DATA SOFTWARE
ISU GIS CENTER S ARCSDE USER'S GUIDE AND DATA CATALOG
 ISU GIS CENTER S ARCSDE USER'S GUIDE AND DATA CATALOG 2 TABLE OF CONTENTS 1) INTRODUCTION TO ARCSDE............. 3 2) CONNECTING TO ARCSDE.............. 5 3) ARCSDE LAYERS...................... 9 4) LAYER
Using Earthscope and B4 LiDAR data to analyze Southern California s active faults
 Using Earthscope and B4 LiDAR data to analyze Southern California s active faults Exercise 8: Simple landscape morphometry and stream network delineation Introduction This exercise covers sample activities
Boston Coastal Flooding Analysis and Mapping
 Boston Coastal Flooding Analysis and Mapping Philip Orton, Dara Mendeloff, Jane Mills, Malgosia Madajewicz Funding This research was funded by the National Oceanic and Atmospheric Administration (NOAA)
Map My Property User Guide
 Map My Property User Guide Map My Property Table of Contents About Map My Property... 2 Accessing Map My Property... 2 Links... 3 Navigating the Map... 3 Navigating to a Specific Location... 3 Zooming
Analyzing Suitability of Land for Affordable Housing
 Analyzing Suitability of Land for Affordable Housing Vern C. Svatos Jarrod S. Doucette Abstract: This paper explains the use of a geographic information system (GIS) to distinguish areas that might have
BSEN 6220 GIS LAB #5
 BSEN 6220 GIS LAB #5 Dustin Till 10/29/2014 INTRODUCTION: ArcGIS is a geographic information system for working with maps and geographic information. It is used for creating and using maps, compiling geographic
These modules are covered with a brief information and practical in ArcGIS Software and open source software also like QGIS, ILWIS.
 Online GIS Training and training modules covered are: 1. ArcGIS, Analysis, Fundamentals and Implementation 2. ArcGIS Web Data Sharing 3. ArcGIS for Desktop 4. ArcGIS for Server These modules are covered
GPS and Mean Sea Level in ESRI ArcPad
 Summary In order to record elevation values as accurately as possible with, it is necessary to understand how ArcPad records elevation. Rather than storing elevation values relative to Mean Sea Level (MSL),
Using ArcGIS for Hydrology and Watershed Analysis:
 Using ArcGIS 10.2.2 for Hydrology and Watershed Analysis: A guide for running hydrologic analysis using elevation and a suite of ArcGIS tools Anna Nakae Feb. 10, 2015 Introduction Hydrology and watershed
SIE 509 Principles of GIS Exercise 5 An Introduction to Spatial Analysis
 SIE 509 Principles of GIS Exercise 5 An Introduction to Spatial Analysis Due: Oct. 31, 2017 Total Points: 50 Introduction: The Governor of Maine is asking communities to look at regionalization for major
Glaciers of Mt. Baker. Mt. Baker is located in Mt. Baker National for in the North West part of Washington. There are
 Thomas Mayo Professor Y.Q. Wang NRS533 December 5 th, 2012 Glaciers of Mt. Baker Introduction: Mt. Baker is located in Mt. Baker National for in the North West part of Washington. There are about 10 large
RiparianZone = buffer( River, 100 Feet )
") GIS Analysts perform spatial analysis when they need to derive new data from existing data. In GIS I, for example, you used the vector approach to derive a riparian buffer feature (output polygon) around
GIS Analysts perform spatial analysis when they need to derive new data from existing data. In GIS I, for example, you used the vector approach to derive a riparian buffer feature (output polygon) around
Software requirements * : Part III: 2 hrs.
 Title: Product Type: Developer: Target audience: Format: Software requirements * : Data: Estimated time to complete: Mapping snow cover using MODIS Part I: The MODIS Instrument Part II: Normalized Difference
Volcanic Hazards of Mt Shasta
 Volcanic Hazards of Mt Shasta Introduction Mt Shasta is a volcano in the northern part of California. Although it has been recently inactive for over 10,000 years. However, its eruption would cause damage
ArcGIS Tools for Professional Cartography
 ArcGIS Tools for Professional Cartography By Makram Murad-al-shaikh M.S. Cartography Senior instructor ESRI Educational Services ICC - A Coruña - Spain, 9-16 July, 2005 Overview Overview of the ArcGIS
Midterm Exam : Answer
 Midterm Exam : Answer Create a double-spaced document with answers to the questions below. File Name: LASTNAME_Midterm.pdf Make sure to include your Name, UWNetID, course number, quarter and year, and
11. Kriging. ACE 492 SA - Spatial Analysis Fall 2003
 11. Kriging ACE 492 SA - Spatial Analysis Fall 2003 c 2003 by Luc Anselin, All Rights Reserved 1 Objectives The goal of this lab is to further familiarize yourself with ESRI s Geostatistical Analyst, extending
Conservation Applications of LiDAR Data
 Program: Funding: Conservation Applications of LiDAR Data http://tsp.umn.edu/lidar Environment and Natural Resources Trust Fund Module: Instructor: Exercise: Hydrologic Applications Sean Vaughn, DNR GIS
Overlay Analysis II: Using Zonal and Extract Tools to Transfer Raster Values in ArcMap
 Overlay Analysis II: Using Zonal and Extract Tools to Transfer Raster Values in ArcMap Created by Patrick Florance and Jonathan Gale, Edited by Catherine Ressijac on March 26, 2018 If you have raster data
GIS Boot Camp for Education June th, 2011 Day 1. Instructor: Sabah Jabbouri Phone: (253) x 4854 Office: TC 136
 x 4854 Office: TC 136") GIS Boot Camp for Education June 27-30 th, 2011 Day 1 Instructor: Sabah Jabbouri Phone: (253) 833-9111 x 4854 Office: TC 136 Email: sjabbouri@greenriver.edu http://www.instruction.greenriver.edu/gis/ Summer
GIS Boot Camp for Education June 27-30 th, 2011 Day 1 Instructor: Sabah Jabbouri Phone: (253) 833-9111 x 4854 Office: TC 136 Email: sjabbouri@greenriver.edu http://www.instruction.greenriver.edu/gis/ Summer
Coastal Flooding in Brevard County, Florida
 Helen Gerlach CE 394K.3 December 4, 2015 Coastal Flooding in Brevard County, Florida Introduction My project was to create a model of the coastal flooding that occurred in Brevard County, Florida in August
Display data in a map-like format so that geographic patterns and interrelationships are visible
 Vilmaliz Rodríguez Guzmán M.S. Student, Department of Geology University of Puerto Rico at Mayagüez Remote Sensing and Geographic Information Systems (GIS) Reference: James B. Campbell. Introduction to
GEOREFERENCING, PROJECTIONS Part I. PRESENTING DATA Part II
 Week 7 GEOREFERENCING, PROJECTIONS Part I PRESENTING DATA Part II topics of the week Georeferencing Coordinate systems Map Projections ArcMap and Projections Geo-referencing Geo-referencing is the process
Mario Flores, Graduate Student Department of Applied Mathematics, UTSA. EES 5053: Remote Sensing
 Mario Flores, Graduate Student Department of Applied Mathematics, UTSA Miguel Balderas, E.I.T., Graduate Student Department of Civil/Environmental Engineering, UTSA EES 5053: Remote Sensing REMOTE SENSING
LANDSLIDE HAZARD ANALYSIS AND ITS EFFECT ON ENDANGERED SPECIES HABITATS, GRAND COUNTY, UTAH
 12/5/2016 LANDSLIDE HAZARD ANALYSIS AND ITS EFFECT ON ENDANGERED SPECIES HABITATS, GRAND COUNTY, UTAH GIS Final Project Ashlyn Murphy Fall 2016 1. Introduction and Problem A well-known geologic hazard
Lecture 6 - Raster Data Model & GIS File Organization
 Lecture 6 - Raster Data Model & GIS File Organization I. Overview of Raster Data Model Raster data models define objects in a fixed manner see Figure 1. Each grid cell has fixed size (resolution). The
Quality Assessment of Shuttle Radar Topography Mission Digital Elevation Data. Thanks to. SRTM Data Collection SRTM. SRTM Galapagos.
 Quality Assessment of Shuttle Radar Topography Mission Digital Elevation Data Third International Conference on Geographic Information Science College Park, Maryland, October 20-23 Ashton Shortridge Dept.
GIS CONCEPTS ARCGIS METHODS AND. 3 rd Edition, July David M. Theobald, Ph.D. Warner College of Natural Resources Colorado State University
 GIS CONCEPTS AND ARCGIS METHODS 3 rd Edition, July 2007 David M. Theobald, Ph.D. Warner College of Natural Resources Colorado State University Copyright Copyright 2007 by David M. Theobald. All rights
Local Government Basemaps using ArcGIS
 Local Government Basemaps using ArcGIS Steve Grisé Scott Oppmann Tuesday, July 14, 10:15-11:30am SDCC 30B Topics Basemaps for Local Government Essential Application-Driven New Ideas Design Strategies Discussion
Working with Digital Elevation Models and Spot Heights in ArcMap
 Working with Digital Elevation Models and Spot Heights in ArcMap 10.3.1 1 TABLE OF CONTENTS INTRODUCTION... 3 WORKING WITH SPOT HEIGHTS FROM NRVIS, CITY OF KITCHENER, AND CITY OF TORONTO...4 WORKING WITH
GIS Project: Groundwater analysis for the Rhodes property (Socorro, NM).
.") GIS Project: Groundwater analysis for the Rhodes property (Socorro, NM). Vanessa Garayburu-Caruso CE 547 May 2016 Contents Motivation and background... 3 Objectives... 3 Methods... 5 Data sources... 5
GIS Project: Groundwater analysis for the Rhodes property (Socorro, NM). Vanessa Garayburu-Caruso CE 547 May 2016 Contents Motivation and background... 3 Objectives... 3 Methods... 5 Data sources... 5
Geographical Information Systems
 Geographical Information Systems Geographical Information Systems (GIS) is a relatively new technology that is now prominent in the ecological sciences. This tool allows users to map geographic features