Midterm Exam : Answer
|
|
|
- Ruby Banks
- 5 years ago
- Views:
Transcription
1 Midterm Exam : Answer Create a double-spaced document with answers to the questions below. File Name: LASTNAME_Midterm.pdf Make sure to include your Name, UWNetID, course number, quarter and year, and assignment number on the document (points will be deducted if you have not identified your work). Use a 12-point black font and double spacing for your answers. Convert the document to an Adobe PDF file (points will be deducted if your file is not in PDF format). Upload the PDF file to Catalyst Collect It by the due time: 6PM. Screen capture or explain any intermediate steps or tools you use and include in answer and show your work Question 1 How do you decide whether to use define projection & project operation in ArcMap? (Short Statements) (5) If the layer itself is undefined, then you need to use Define Projection to assign projection to this layer. However, if the layer has its original projection but you need to project to the other projection, you will use Project operation to generate a new projection and you will have a new layer. Question 2 Geodatabase & Data Management (35) 1) Create a file geodatabase, named with your last name, LASTNAME.gdb, and show the snapsot of the process (5) 2) Import the following data into your geodatabase and show snapshot of process and results: (30) a. dem raster layers (location: L:\packgis\forest) b. Boundary, Soil, and Road layer from packgis geodatabase (location: L:\packgis\pcgis.mdb) c. Stream (polyline) and Stand (polygon) coverage files from forest folders (location: L:\packgis\forest) 1) In my M drive, right click on the mouse, then select new > file geodatabase. After finished this step, I type my LASTNAME for this geodatbase


2 2) a. Navigate the Raster Layer: DEM, right click on the mouse then choose Raster to Different Format


3 b. For these three layer, I righ click my mouse of my geodatbase, then choose import -> Feature Class (Multiple), then choose Boundary, Soil, and Road in Packgis.mdb
 and Stand")


4 c. Last, add Stream (polyline) and Stand (polygon) into ArcMap, right click these two layer and export them into my geodatabase.
 Download")
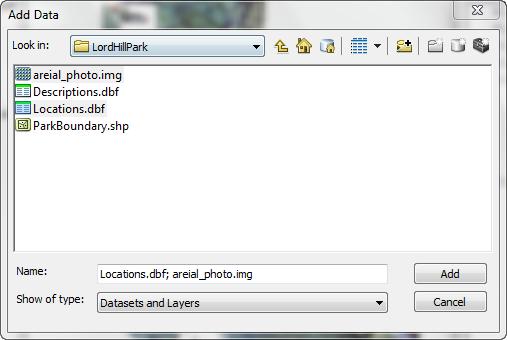
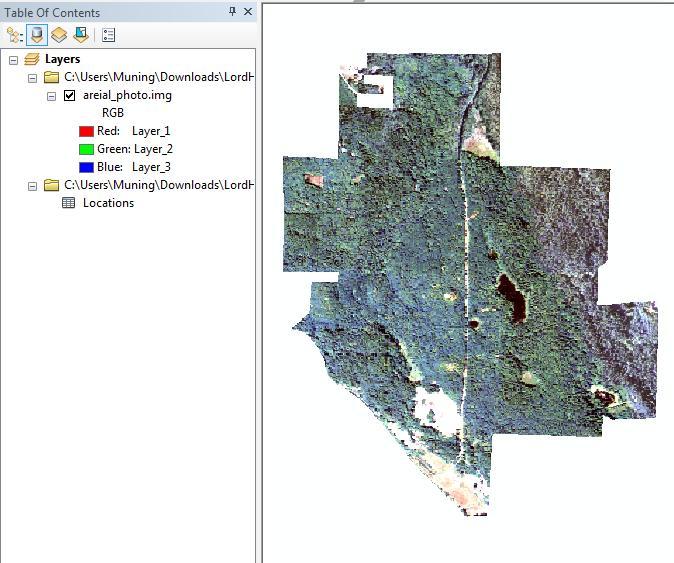
 Add the aerial photo and the Location table")
5 Now I have all layers within my Geodatabase now. Question 3 Generate XY points into a map (50) Download the LordHillPark.zip file and unzip it. 1) Add the aerial photo and the Location table (Locations.dbf) into the ArcMap (5)
6

7 2) Display XY data as an event layer and a. show a snapshot of the shown window, b. define the layer projection by using the aerial photo as the reference, show the process and results. (15) Right Click on the Table, then choose Display XY Data, then use Edit to import the coordination system


8 After assigned the projection as same as Aerial Photos in the same folder, the Projection system has been redefined. Then click on OK, you will see the result:


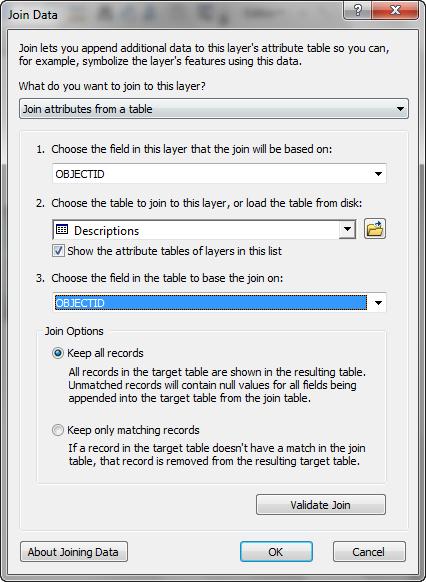
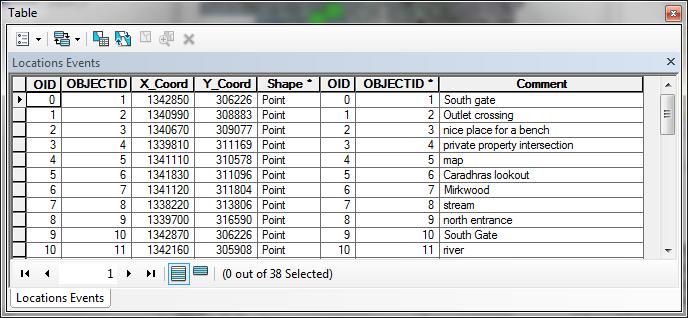
9 3) Add the Description.dbf table and join to the event layer by using OBJECTID as the field to join. Show the process and results of join (15) Add the Description.dbf into ArcMap, then right click on event layer, then click on Join Use OBJECTID to connect the Description.dbf into the event layer.
10
 Generate the map of this event layer and the areial photos within the zip file. (10)")
11 4) Export this layer into your geodatabase and name it as parktrail and show the snapshot. (5) Generate the map of this event layer and the areial photos within the zip file. (10)
 How many acres will be affected within 300 feet stream buffered area?")
12 Question 4 Vector Analysis I (40) Pack Forest is concerned about the flooding issue with their stands. Use the layers within the geodatabase you made to provide the following information for Pack Forest: 1) How many acres will be affected within 300 feet stream buffered area? [Hint: buffer, clip, calculate geometry] Use Buffer tool and set 300 ft as the buffered area, after that, right click the Shape_Area in the attribute table, you will see the value is sq. ft., which equals to 5121 acres.
 3) Show the result of stand cliped area.")

13 2) Show the result of stream buffer. (10) 3) Show the result of stand cliped area. (10) In order to get the stand attribute, I need to put input is stand and clip by the stream buffer, or use the intersect tool to get the two attributes into the table.
14 4) Show or explain the process how to update the fields by using calculate geometry (10) If you are using Geodatabase, you will not have to update the field, but check the Shape_Area to get the correct value. If you are using shapefile, right click on the area, then choose calculate geometry to update the area.
 and whose the result of")

15 5) Summarize the area (square feet) in different stands (Field: Species) and whose the result of table (10) Open the attribute table, right clicks from SPECIES field, and chooses sum of Shape_Area

 Show the soils that intersect with the buffered streams (15) First, Intersect")
16 Question 5 Vector Analysis II (20) After the flooding issue, Pack Forest would like to understand: what are the soils within this flooding area within the Pack Forest Boundary. Hence, you need to help them to get the different soil names and their area within the boundary: 1) Show the soils that intersect with the buffered streams (15) First, Intersect with Soil and Stream
17 Then clip the intersect area within the boundary 2) How many acres will be affected? And which soil (SoilName field) is this? (5)

18 Open the result layer table, right clicks on the AREA field, and then calculates geometry, choose the acre, and then click ok. After that, Use the SoilName as the field to summarize the table, but choose the AREA field. Question 6 Raster Analysis (50) It is important to understand the slope and its application within the Pack Forest boundary. 1) Show how to set up the environment for starting the spatial analysis (10) 2) Use the dem layer in your geodatabase, and reclassify the dem layer by the following elevations categories: (20) a. Elevation <1000 value=1 b. Elevation value=2 c. Elevation >1500 value=3 3) How many acres within the Pack Forest that elevation is less than 1000 feet (show the counts and acres) (10) 4) Use Set Null and/or other spatial analysis tools to eliminate the elevation larger than 1000 feet (from the DEM layer). Show the process and results. (10) 1)


19 2) Use the reclassify tool to reclassify as the window shown

 Use set null tool and try to get rid of the value 2 & 3 in the reclassed")
20 3) Already set up the mask as the boundary into the environment, hence my result will be within the boundary The area within 1000 ft has been classified as value 1, so I only need to see the count It has counts, equals to acres. (4) Use set null tool and try to get rid of the value 2 & 3 in the reclassed layer.


21 After running this process, I got the boundary for my DEM layer. I can reset the mask from the environment then run the dem layer from Raster Calculator again. Or, I can use the Extract by Mask function here.
22 After this extracion, I will get the value <1000 feet dem within the Pack Forest boundary.
Midterm Exam. 2) What are three important things to keep in mind when selecting colors for a map? (5)
 What are three important things to keep in mind when selecting colors for a map? (5)") Midterm Exam File Name: LASTNAME_Midterm.pdf Make sure to include your Name, UWNetID, course number, and quarter and year, on the document (points will be deducted if you have not identified your work).
Midterm Exam File Name: LASTNAME_Midterm.pdf Make sure to include your Name, UWNetID, course number, and quarter and year, on the document (points will be deducted if you have not identified your work).
Outcrop suitability analysis of blueschists within the Dry Lakes region of the Condrey Mountain Window, North-central Klamaths, Northern California
 Outcrop suitability analysis of blueschists within the Dry Lakes region of the Condrey Mountain Window, North-central Klamaths, Northern California (1) Introduction: This project proposes to assess the
SIE 509 Principles of GIS Exercise 5 An Introduction to Spatial Analysis
 SIE 509 Principles of GIS Exercise 5 An Introduction to Spatial Analysis Due: Oct. 31, 2017 Total Points: 50 Introduction: The Governor of Maine is asking communities to look at regionalization for major
The Geodatabase Working with Spatial Analyst. Calculating Elevation and Slope Values for Forested Roads, Streams, and Stands.
 GIS LAB 7 The Geodatabase Working with Spatial Analyst. Calculating Elevation and Slope Values for Forested Roads, Streams, and Stands. This lab will ask you to work with the Spatial Analyst extension.
(THIS IS AN OPTIONAL BUT WORTHWHILE EXERCISE)
") PART 2: Analysis in ArcGIS (THIS IS AN OPTIONAL BUT WORTHWHILE EXERCISE) Step 1: Start ArcCatalog and open a geodatabase If you have a shortcut icon for ArcCatalog on your desktop, double-click it to start
PART 2: Analysis in ArcGIS (THIS IS AN OPTIONAL BUT WORTHWHILE EXERCISE) Step 1: Start ArcCatalog and open a geodatabase If you have a shortcut icon for ArcCatalog on your desktop, double-click it to start
Lab#8: Working With Geodatabases. create a geodatabase with feature datasets, tables, raster datasets, and raster catalogs
 Lab#8: Geodatabase Concepts Page#1 of 25 In this lab, you will learn how to: Lab#8: Working With Geodatabases create a geodatabase with feature datasets, tables, raster datasets, and raster catalogs join
How to Create Stream Networks using DEM and TauDEM
 How to Create Stream Networks using DEM and TauDEM Take note: These procedures do not describe all steps. Knowledge of ArcGIS, DEMs, and TauDEM is required. TauDEM software ( http://hydrology.neng.usu.edu/taudem/
Land Cover Data Processing Land cover data source Description and documentation Download Use Use
 Land Cover Data Processing This document provides a step by step procedure on how to build the land cover data required by EnSim. The steps provided here my be long and there may be short cuts (like using
Creating Watersheds from a DEM
 Creating Watersheds from a DEM These instructions enable you to create watersheds of specified area using a good quality Digital Elevation Model (DEM) in ArcGIS 8.1. The modeling is performed in ArcMap
Geo 327G Semester Project. Landslide Suitability Assessment of Olympic National Park, WA. Fall Shane Lewis
 Geo 327G Semester Project Landslide Suitability Assessment of Olympic National Park, WA Fall 2011 Shane Lewis 1 I. Problem Landslides cause millions of dollars of damage nationally every year, and are
Map My Property User Guide
 Map My Property User Guide Map My Property Table of Contents About Map My Property... 2 Accessing Map My Property... 2 Links... 3 Navigating the Map... 3 Navigating to a Specific Location... 3 Zooming
Tutorial 8 Raster Data Analysis
 Objectives Tutorial 8 Raster Data Analysis This tutorial is designed to introduce you to a basic set of raster-based analyses including: 1. Displaying Digital Elevation Model (DEM) 2. Slope calculations
Exercise 6: Working with Raster Data in ArcGIS 9.3
 Exercise 6: Working with Raster Data in ArcGIS 9.3 Why Spatial Analyst? Grid query Grid algebra Grid statistics Summary by zone Proximity mapping Reclassification Histograms Surface analysis Slope, aspect,
Display data in a map-like format so that geographic patterns and interrelationships are visible
 Vilmaliz Rodríguez Guzmán M.S. Student, Department of Geology University of Puerto Rico at Mayagüez Remote Sensing and Geographic Information Systems (GIS) Reference: James B. Campbell. Introduction to
Exercise 6: Using Burn Severity Data to Model Erosion Risk
 Exercise 6: Using Burn Severity Data to Model Erosion Risk Document Updated: November 2009 Software Versions: ERDAS Imagine 9.3 and ArcGIS 9.3, Microsoft Office 2007 Introduction A common use of burn severity
In this exercise we will learn how to use the analysis tools in ArcGIS with vector and raster data to further examine potential building sites.
 GIS Level 2 In the Introduction to GIS workshop we filtered data and visually examined it to determine where to potentially build a new mixed use facility. In order to get a low interest loan, the building
Suitability Analysis on Second Home Areas Selection in Smithers British Columbia
 GEOG 613 Term Project Suitability Analysis on Second Home Areas Selection in Smithers British Columbia Zhengzhe He November 2005 Abstract Introduction / background Data Source Data Manipulation Spatial
GEOG 487 Lesson 7: Step-by-Step Activity
 GEOG 487 Lesson 7: Step-by-Step Activity Part I: Review the Relevant Data Layers and Organize the Map Document In Part I, we will review the data and organize the map document for analysis. 1. Unzip the
Calhoun County, Texas Under 5 Meter Sea Level Rise
 Kyle Kacal GEO 327G Calhoun County, Texas Under 5 Meter Sea Level Rise PROBLEM AND PURPOSE: Sea level rise is threat to all coastal areas. Although natural sea level rise happens at a very slow rate, hurricanes
Data Structures & Database Queries in GIS
 Data Structures & Database Queries in GIS Objective In this lab we will show you how to use ArcGIS for analysis of digital elevation models (DEM s), in relationship to Rocky Mountain bighorn sheep (Ovis
Vector Analysis: Farm Land Suitability Analysis in Groton, MA
 Vector Analysis: Farm Land Suitability Analysis in Groton, MA Written by Adrienne Goldsberry, revised by Carolyn Talmadge 10/9/2018 Introduction In this assignment, you will help to identify potentially
The data for this lab comes from McDonald Forest. We will be working with spatial data representing the forest boundary, streams, roads, and stands.
 GIS LAB 6 Using the Projection Utility. Converting Data to Oregon s Approved Lambert Projection. Determining Stand Size, Stand Types, Road Length, and Stream Length. This lab will ask you to work with
Watershed Modeling Orange County Hydrology Using GIS Data
 v. 10.0 WMS 10.0 Tutorial Watershed Modeling Orange County Hydrology Using GIS Data Learn how to delineate sub-basins and compute soil losses for Orange County (California) hydrologic modeling Objectives
Exercise 2: Working with Vector Data in ArcGIS 9.3
 Exercise 2: Working with Vector Data in ArcGIS 9.3 There are several tools in ArcGIS 9.3 used for GIS operations on vector data. In this exercise we will use: Analysis Tools in ArcToolbox Overlay Analysis
Raster Analysis: An Example
 Raster Analysis: An Example Fires (1 or 4) Slope (1-4) + Geology (1-4) Erosion Ranking (3-12) 1 Typical Raster Model Types: Suitability Modeling: Where is optimum location? Distance Modeling: What is the
Automatic Watershed Delineation using ArcSWAT/Arc GIS
 Automatic Watershed Delineation using ArcSWAT/Arc GIS By: - Endager G. and Yalelet.F 1. Watershed Delineation This tool allows the user to delineate sub watersheds based on an automatic procedure using
Instructions for Mapping 2011 Census Data
 Instructions for Mapping 2011 Census Data To map 2011 census data, you must download the census boundary files and the census data separately, then join the two files in ArcMap. In this guide, we will
Raster Analysis; A Yellowstone Example 3/29/2018
 Fires (1 or 4) Typical Raster Model Types: Raster Analysis: An Example Suitability Modeling: Where is optimum location? Distance Modeling: What is the most efficient path from A to B? + Slope (1-4) Geology
INTRODUCTION TO GIS. Practicals Guide. Chinhoyi University of Technology
 INTRODUCTION TO GIS Practicals Guide Chinhoyi University of Technology Lab 1: Basic Visualisation You have been requested to make a map of Zimbabwe showing the international boundary and provinces. The
Geodatabases and ArcCatalog
 Geodatabases and ArcCatalog Francisco Olivera, Ph.D., P.E. Srikanth Koka Lauren Walker Aishwarya Vijaykumar Keri Clary Department of Civil Engineering April 21, 2014 Contents Geodatabases and ArcCatalog...
Raster Analysis; A Yellowstone Example 10/24/2013. M. Helper GEO327G/386G, UT Austin 2. M. Helper GEO327G/386G, UT Austin 4
 + Fires (1 or 4) Slope (1-4) Geology (1-4) Erosion Ranking (3-12) Raster Analysis: An Example Typical Raster Model Types: Suitability Modeling: Where is optimum location? Distance Modeling: What is the
Handling Raster Data for Hydrologic Applications
 Handling Raster Data for Hydrologic Applications Prepared by Venkatesh Merwade Lyles School of Civil Engineering, Purdue University vmerwade@purdue.edu January 2018 Objective The objective of this exercise
Introduction. Project Summary In 2014 multiple local Otsego county agencies, Otsego County Soil and Water
 Introduction Project Summary In 2014 multiple local Otsego county agencies, Otsego County Soil and Water Conservation District (SWCD), the Otsego County Planning Department (OPD), and the Otsego County
Delineation of Watersheds
 Delineation of Watersheds Adirondack Park, New York by Introduction Problem Watershed boundaries are increasingly being used in land and water management, separating the direction of water flow such that
Watershed Delineation
 Watershed Delineation Jessica L. Watkins, University of Georgia 2 April 2009 Updated by KC Love February 25, 2011 PURPOSE For this project, I delineated watersheds for the Coweeta synoptic sampling area
Raster Analysis: An Example
 Raster Analysis: An Example Fires (1 or 4) Slope (1-4) + Geology (1-4) Erosion Ranking (3-12) 11/8/2016 GEO327G/386G, UT Austin 1 Typical Raster Model Types: Suitability Modeling: Where is optimum location?
Lauren Jacob May 6, Tectonics of the Northern Menderes Massif: The Simav Detachment and its relationship to three granite plutons
 Lauren Jacob May 6, 2010 Tectonics of the Northern Menderes Massif: The Simav Detachment and its relationship to three granite plutons I. Introduction: Purpose: While reading through the literature regarding
Delineation of high landslide risk areas as a result of land cover, slope, and geology in San Mateo County, California
 Delineation of high landslide risk areas as a result of land cover, slope, and geology in San Mateo County, California Introduction Problem Overview This project attempts to delineate the high-risk areas
Using the Stock Hydrology Tools in ArcGIS
 Using the Stock Hydrology Tools in ArcGIS This lab exercise contains a homework assignment, detailed at the bottom, which is due Wednesday, October 6th. Several hydrology tools are part of the basic ArcGIS
Protocol for Prioritizing Conservation Opportunity Areas in Centre County and Clinton County
 Protocol for Prioritizing Conservation Opportunity Areas in Centre County and Clinton County Chesapeake Conservancy has developed this methodology to prioritize conservation opportunity areas in Centre
Trail Flow: Analysis of Drainage Patterns Affecting a Mountain Bike Trail
 Andy Belcher BAE 590 Professor Huffman 12.9.11 Location Trail Flow: Analysis of Drainage Patterns Affecting a Mountain Bike Trail The location of the project area rests in the Cary area of Wake County,
Alaska, USA. Sam Robbins
 Using ArcGIS to determine erosion susceptibility within Denali National Park, Alaska, USA Sam Robbins Introduction Denali National Park is six million acres of wild land with only one road and one road
Course overview. Grading and Evaluation. Final project. Where and When? Welcome to REM402 Applied Spatial Analysis in Natural Resources.
 Welcome to REM402 Applied Spatial Analysis in Natural Resources Eva Strand, University of Idaho Map of the Pacific Northwest from http://www.or.blm.gov/gis/ Where and When? Lectures Monday & Wednesday
How do I do that in Quantum GIS: illustrating classic GIS tasks Edited by: Arthur J. Lembo, Jr.; Salisbury University
 How do I do that in Quantum GIS: illustrating classic GIS tasks Edited by: Arthur J. Lembo, Jr.; Salisbury University How do I do that in Quantum GIS Page 1 Introduction from the editor:... 4 Database
Lab 7: Cell, Neighborhood, and Zonal Statistics
 Lab 7: Cell, Neighborhood, and Zonal Statistics Exercise 1: Use the Cell Statistics function to detect change In this exercise, you will use the Spatial Analyst Cell Statistics function to compare the
CE 365K Exercise 1: GIS Basemap for Design Project Spring 2014 Hydraulic Engineering Design
 CE 365K Exercise 1: GIS Basemap for Design Project Spring 2014 Hydraulic Engineering Design The purpose of this exercise is for you to construct a basemap in ArcGIS for your design project. You may execute
Displaying Latitude & Longitude Data (XY Data) in ArcGIS
 in ArcGIS") Displaying Latitude & Longitude Data (XY Data) in ArcGIS Created by Barbara Parmenter and updated on 2/15/2018 If you have a table of data that has longitude and latitude, or XY coordinates, you can view
Displaying Latitude & Longitude Data (XY Data) in ArcGIS Created by Barbara Parmenter and updated on 2/15/2018 If you have a table of data that has longitude and latitude, or XY coordinates, you can view
Week 7 Last week: This week s topics. GIS and Forest Engineering Applications. FE 257. GIS and Forest Engineering Applications.
 FE 257. GIS and Forest Engineering Applications Week 7 Week 7 Last week: Spatial Projections Questions? Next week- read: Chapter 10: Updating GIS Databases Chapter 12: Synthesis of Techniques Applied to
v WMS Tutorials GIS Module Importing, displaying, and converting shapefiles Required Components Time minutes
 v. 11.0 WMS 11.0 Tutorial Importing, displaying, and converting shapefiles Objectives This tutorial demonstrates how to import GIS data, visualize it, and convert it into WMS coverage data that could be
Spatial Analyst: Multiple Criteria Evaluation Material adapted from FOR 4114 developed by Forestry Associate Professor Steve Prisley
 Spatial Analyst: Multiple Criteria Evaluation Material adapted from FOR 4114 developed by Forestry Associate Professor Steve Prisley Section 1: Data In this exercise we will be working with several types
Watershed and Stream Network Delineation
 Watershed and Stream Network Delineation GIS in Water Resources, Fall 2011 Prepared by David Tarboton, Utah State University Purpose The purpose of this exercise is to illustrate watershed and stream network
Compilation of GIS data for the Lower Brazos River basin
 Compilation of GIS data for the Lower Brazos River basin Francisco Olivera, Ph.D., P.E. Srikanth Koka Lauren Walker Aishwarya Vijaykumar Department of Civil Engineering December 5, 2011 Contents Brief
Spatial Data Analysis in Archaeology Anthropology 589b. Kriging Artifact Density Surfaces in ArcGIS
 Spatial Data Analysis in Archaeology Anthropology 589b Fraser D. Neiman University of Virginia 2.19.07 Spring 2007 Kriging Artifact Density Surfaces in ArcGIS 1. The ingredients. -A data file -- in.dbf
Visual Studies Exercise, Assignment 07 (Architectural Paleontology) Geographic Information Systems (GIS), Part II
 Geographic Information Systems (GIS), Part II") ARCH1291 Visual Studies II Week 8, Spring 2013 Assignment 7 GIS I Prof. Alihan Polat Visual Studies Exercise, Assignment 07 (Architectural Paleontology) Geographic Information Systems (GIS), Part II Medium:
ARCH1291 Visual Studies II Week 8, Spring 2013 Assignment 7 GIS I Prof. Alihan Polat Visual Studies Exercise, Assignment 07 (Architectural Paleontology) Geographic Information Systems (GIS), Part II Medium:
Task 1: Start ArcMap and add the county boundary data from your downloaded dataset to the data frame.
 Exercise 6 Coordinate Systems and Map Projections The following steps describe the general process that you will follow to complete the exercise. Specific steps will be provided later in the step-by-step
Fire Susceptibility Analysis Carson National Forest New Mexico. Can a geographic information system (GIS) be used to analyze the susceptibility of
 be used to analyze the susceptibility of") 1 David Werth Fire Susceptibility Analysis Carson National Forest New Mexico Can a geographic information system (GIS) be used to analyze the susceptibility of Carson National Forest, New Mexico to forest
1 David Werth Fire Susceptibility Analysis Carson National Forest New Mexico Can a geographic information system (GIS) be used to analyze the susceptibility of Carson National Forest, New Mexico to forest
Watershed Analysis of the Blue Ridge Mountains in Northwestern Virginia
 Watershed Analysis of the Blue Ridge Mountains in Northwestern Virginia Mason Fredericks December 6, 2018 Purpose The Blue Ridge Mountain range is one of the most popular mountain ranges in the United
Exercise 2: Working with Vector Data in ArcGIS 9.3
 Exercise 2: Working with Vector Data in ArcGIS 9.3 There are several tools in ArcGIS 9.3 used for GIS operations on vector data. In this exercise we will use: Analysis Tools in ArcToolbox Overlay Analysis
Hazard Assessment of Lava Flows, Wildfires, and Tsunamis on the Big Island of Hawaii s population. By: Thomas Ditges
 Hazard Assessment of Lava Flows, Wildfires, and Tsunamis on the Big Island of Hawaii s population By: Thomas Ditges The Problem: The Big Island of Hawaii is the largest and most dangerous of the Hawaiian
ArcGIS Pro: Essential Workflows STUDENT EDITION
 ArcGIS Pro: Essential Workflows STUDENT EDITION Copyright 2018 Esri All rights reserved. Course version 6.0. Version release date August 2018. Printed in the United States of America. The information contained
MERGING (MERGE / MOSAIC) GEOSPATIAL DATA
 GEOSPATIAL DATA") This help guide describes how to merge two or more feature classes (vector) or rasters into one single feature class or raster dataset. The Merge Tool The Merge Tool combines input features from input
This help guide describes how to merge two or more feature classes (vector) or rasters into one single feature class or raster dataset. The Merge Tool The Merge Tool combines input features from input
Geodatabases and ArcCatalog
 Geodatabases and ArcCatalog Prepared by Francisco Olivera, Ph.D. and Srikanth Koka Department of Civil Engineering Texas A&M University February 2004 Contents Brief Overview of Geodatabases Goals of the
GIS Final Project Determining Regions of Anthropogenic Recharge
 Michael Passarello 04/06/10 GIS Final Project Determining Regions of Anthropogenic Recharge Objective A grid for the recharge zone of the Barton Springs segment of the Edwards Aquifer within the city limits
GIS IN ECOLOGY: ANALYZING RASTER DATA
 GIS IN ECOLOGY: ANALYZING RASTER DATA Contents Introduction... 2 Raster Tools and Functionality... 2 Data Sources... 3 Tasks... 4 Getting Started... 4 Creating Raster Data... 5 Statistics... 8 Surface
Learning Unit Student Guide. Title: Estimating Areas of Suitable Grazing Land Using GPS, GIS, and Remote Sensing
 Learning Unit Student Guide Name of Creator: Jeff Sun Institution: Casper College Email: jsun@caspercollege.edu Phone: Office (307) 268-3560 Cell (307) 277-9766 Title: Estimating Areas of Suitable Grazing
STARS: SPATIAL TOOLS FOR THE ANALYSIS OF RIVER SYSTEMS - A TUTORIAL
 STARS: SPATIAL TOOLS FOR THE ANALYSIS OF RIVER SYSTEMS - A TUTORIAL Dr. Erin E. Peterson EP111313 28 March 2011 Enquiries should be addressed to: Erin E. Peterson 41 Boggo Rd., Dutton Park, QLD, 4102 Erin.Peterson@csiro.au
WORKING WITH DMTI DIGITAL ELEVATION MODELS (DEM)
") WORKING WITH DMTI DIGITAL ELEVATION MODELS (DEM) Contents (Ctrl-Click to jump to a specific page) Manipulating the DEM Step 1: Finding the DEM Tiles You Need... 2 Step 2: Importing the DEM Tiles into ArcMap...
WORKING WITH DMTI DIGITAL ELEVATION MODELS (DEM) Contents (Ctrl-Click to jump to a specific page) Manipulating the DEM Step 1: Finding the DEM Tiles You Need... 2 Step 2: Importing the DEM Tiles into ArcMap...
Brief Overview of Geodatabases. Procedure IT GEOGRAPHIC INFORMATION SYSTEMS LAB 9 GEODATABASE AND DIGITIZING SHAPEFILED
 Developing entirely new maps using on-screen digitizing to create spatial features (such as points, lines, and polygons) is a vital GIS capability. ArcGIS provides a useful, but proprietary, spatial data
Within this document, the term NHDPlus is used when referring to NHDPlus Version 2.1 (unless otherwise noted).
.") Exercise 7 Watershed Delineation Using ArcGIS Spatial Analyst Last Updated 4/6/2017 Within this document, the term NHDPlus is used when referring to NHDPlus Version 2.1 (unless otherwise noted). There
Exercise 7 Watershed Delineation Using ArcGIS Spatial Analyst Last Updated 4/6/2017 Within this document, the term NHDPlus is used when referring to NHDPlus Version 2.1 (unless otherwise noted). There
Lab 4 -Vector data and Attributes
 Lab 4 -Vector data and Attributes ERSC/BIOL 4421/5421 Name In this lab you will learn how to create your own vector data by collecting point data from GPS coordinates and by digitizing lines using an Aerial
Spatial Analysis using Vector GIS THE GOAL: PREPARATION:
 PLAN 512 GIS FOR PLANNERS Department of Urban and Environmental Planning University of Virginia Fall 2006 Prof. David L. Phillips Spatial Analysis using Vector GIS THE GOAL: This tutorial explores some
Classification of Erosion Susceptibility
 GEO327G: GIS & GPS Applications in Earth Sciences Classification of Erosion Susceptibility Denali National Park, Alaska Zehao Xue 12 3 2015 2 TABLE OF CONTENTS 1 Abstract... 3 2 Introduction... 3 2.1 Universal
Introduction. Purpose
 Introduction The Edwards Aquifer is a karst aquifer in Central Texas whose hydrogeological properties are not fully understood. This is due to exaggerated heterogeneity of properties, high anisotropy due
Creating Watersheds from a DEM in ArcGIS 9.x
 Creating Watersheds from a DEM in ArcGIS 9.x These instructions enable you to create watersheds (a.k.a. catchments or basins) using a good quality Digital Elevation Model (DEM) in ArcGIS 9.1. The modeling
Laboratory Exercise X Most Dangerous Places to Live in the United States Based on Natural Disasters
 Brigham Young University BYU ScholarsArchive Engineering Applications of GIS - Laboratory Exercises Civil and Environmental Engineering 2016 Laboratory Exercise X Most Dangerous Places to Live in the United
ISU GIS CENTER S ARCSDE USER'S GUIDE AND DATA CATALOG
 ISU GIS CENTER S ARCSDE USER'S GUIDE AND DATA CATALOG 2 TABLE OF CONTENTS 1) INTRODUCTION TO ARCSDE............. 3 2) CONNECTING TO ARCSDE.............. 5 3) ARCSDE LAYERS...................... 9 4) LAYER
THE CONSERVATION LANDSCAPE CONTEXT TOOLBOX: A Custom ESRI ArcToolbox for the Stewardship of Conservation Lands in Rhode Island
 THE CONSERVATION LANDSCAPE CONTEXT TOOLBOX: A Custom ESRI ArcToolbox for the Stewardship of Conservation Lands in Rhode Island Ann Borowik M.E.S.M. Research Project University of Rhode Island May 2008
Exercise 4. Watershed and Stream Network Delineation
 Exercise 4. Watershed and Stream Network Delineation GIS in Water Resources, Fall 2018 Prepared by David G Tarboton and David R. Maidment Revised 9 October, 2018 Purpose The purpose of this exercise is
Overlay Analysis II: Using Zonal and Extract Tools to Transfer Raster Values in ArcMap
 Overlay Analysis II: Using Zonal and Extract Tools to Transfer Raster Values in ArcMap Created by Patrick Florance and Jonathan Gale, Edited by Catherine Ressijac on March 26, 2018 If you have raster data
i-tree Eco Random Plots Workbook: Pre - Stratification Tips red green
 i-tree Eco Random Plots Workbook: Pre - Stratification These instructions help users of all skill levels create random, pre-stratified UFORE sample points and their associated UFORE-required data within
Determining the Location of the Simav Fault
 Lindsey German May 3, 2012 Determining the Location of the Simav Fault 1. Introduction and Problem Formulation: The issue I will be focusing on involves interpreting the location of the Simav fault in
Outline. Chapter 1. A history of products. What is ArcGIS? What is GIS? Some GIS applications Introducing the ArcGIS products How does GIS work?
 Outline Chapter 1 Introducing ArcGIS What is GIS? Some GIS applications Introducing the ArcGIS products How does GIS work? Basic data formats The ArcCatalog interface 1-1 1-2 A history of products Arc/Info
Exercise 4 Estimating the effects of sea level rise on coastlines by reclassification
 Exercise 4 Estimating the effects of sea level rise on coastlines by reclassification Due: Thursday February 1; at the start of class Goal: Get familiar with symbolizing and making time-series maps of
Outline Anatomy of ArcGIS Metadata Data Types Vector Raster Conversion Adding Data Navigation Symbolization Methods Layer Files Editing Help Files
 UPlan Training Lab Exercise: Introduction to ArcGIS Outline Anatomy of ArcGIS Metadata Data Types Vector Raster Conversion Adding Data Navigation Symbolization Methods Layer Files Editing Help Files Anatomy
Spatio-temporal models
 Spatio-temporal models Involve a least a three dimensional representation of one or more key attribute variation in planar (X-Y) space and through time. (a 4 th dimension could also be use, like Z for
Task 1: Open ArcMap and activate the Spatial Analyst extension.
 Exercise 10 Spatial Analyst The following steps describe the general process that you will follow to complete the exercise. Specific steps will be provided later in the step-by-step instructions component
Lesson 9 and 10: Final Project. by Diana Jo Lau
 Lesson 9 and 10: Final Project by Diana Jo Lau Introduction Acme Conservation Unlimited conducted a site selection analysis of conservation areas meeting specific criteria. The results of our analysis
Exercise 5e: Estimating the impact of sea level rise in coastal areas of the United States and comparing to the impact in coastal Asia
 Exercise 5e: Estimating the impact of sea level rise in coastal areas of the United States and comparing to the impact in coastal Asia Data sets (downloaded in previous homework from the National Geophysical
GEOG 487 Lesson 3: Step-by-Step Activity
 GEOG 487 Lesson 3: Step-by-Step Activity Part I: Explore Publically Available Wetlands Data & Historical Imagery In Part I, we will explore our study area and the time-series aerial photos used to digitize
GIS in Water Resources Midterm Exam Fall 2012 There are five questions on this exam. Please do all five.
 Page 1 of 6 Name: Key GIS in Water Resources Midterm Exam Fall 2012 There are five questions on this exam. Please do all five. Question 1 (a) You have worked with the location of Utah State University
Lab 5 - Introduction to the Geodatabase
 Lab 5 - Introduction to the Geodatabase 1. Design Process GIS is becoming an increasingly accessible and important tool for land managers. In this exercise you will begin creating a Personal Geodatabase
WHAT MAKES A GOOD GIS LAB EXERCISE? Robert N. Martin
 WHAT MAKES A GOOD GIS LAB EXERCISE? Robert N. Martin ABSTRACT Having taught GIS for over fifteen years in a lecture/laboratory format, I have developed a series of laboratory exercise that provide a good
Exercise 4. Watershed and Stream Network Delineation
 Exercise 4. Watershed and Stream Network Delineation GIS in Water Resources, Fall 2015 Prepared by David G Tarboton and David R. Maidment Purpose The purpose of this exercise is to illustrate watershed
Creating Faulted Geologic Surfaces with ArcGIS
 What You Will Need ArcGIS 10.2 for Desktop (Basic, Standard, or Advanced license level) ArcGIS Geostatistical Analyst extension ArcGIS Spatial Analyst extension Sample dataset downloaded from esri.com/arcuser
Working with Digital Elevation Models in ArcGIS 8.3
 Working with Digital Elevation Models in ArcGIS 8.3 The homework that you need to turn in is found at the end of this document. This lab continues your introduction to using the Spatial Analyst Extension
The Looming Threat of Rising Sea Levels to the Florida Keys
 The Looming Threat of Rising Sea Levels to the Florida Keys 1. Introduction Sea levels are rising, and possibly faster than we thought before. In a recent report in 2017 by the National Oceanic and Atmospheric
Esri UC2013. Technical Workshop.
 Esri International User Conference San Diego, California Technical Workshops July 9, 2013 CAD: Introduction to using CAD Data in ArcGIS Jeff Reinhart & Phil Sanchez Agenda Overview of ArcGIS CAD Support
Effects of sea level rise on shallow atolls in the South Pacific
 Tuvalu 2100 Effects of sea level rise on shallow atolls in the South Pacific Kristin Vollmann GEO 327GG December 3, 20100 INTRODUCTION Residents of the tiny island nation of Tuvalu, withh a maximumm elevation
Exercise 3: GIS data on the World Wide Web
 Exercise 3: GIS data on the World Wide Web These web sites are a few examples of sites that are serving free GIS data. Many other sites exist. Search in Google or other search engine to find GIS data for
Modeling Incident Density with Contours in ArcGIS Pro
 Modeling Incident Density with Contours in ArcGIS Pro By Mike Price, Entrada/San Juan, Inc. What you will need ArcGIS Pro 1.4 license or later ArcGIS Spatial Analyst license ArcGIS Online for organizational