Final Project: Geodatabase of Mule Mountains Area, southeastern Arizona
|
|
|
- Blaise Andrews
- 6 years ago
- Views:
Transcription
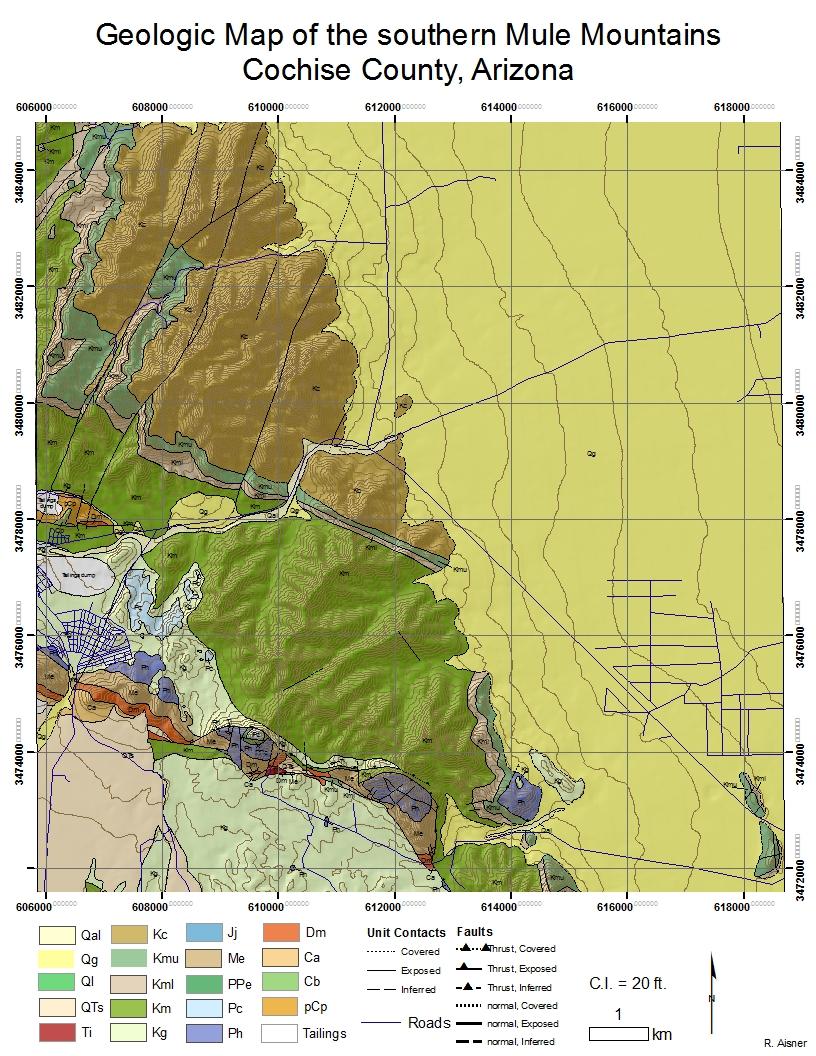
1 R. Aisner 11/24/09 GEO 386G Final Project: Geodatabase of Mule Mountains Area, southeastern Arizona Project goal: Develop a geodatabase with vector and raster data for future data organization and analysis. Vector Data Geology (digitized from raster imagery) Roads (downloaded from USGS National Map Seamless Server) Measured Section locations (collected with RTK-GPS system in the field. This is a very bad dataset collected at the beginning of my field work) Strikes and dips (field data) Raster Data 1 arc-second DEM (GRID format downloaded from USGS National Map Seamless Server, resolution 28m x 28m, 32 bits) 1/9 arc-second DEM for Paul Spur (GRID format downloaded from USGS National Map Seamless Server, resolution 3.2m x 3.2m, 16 bits) Orthophoto (GRID format downloaded from USGS National Map Seamless Server,) Outcrop photos (JPEG format, collected in the field) All data downloaded from seamless server contained metadata and.prj files. Database Organization A personal geodatabase was created with 1 feature dataset: 1) Geology - Faults - Topology - Outline - Unit contacts - Polygons (created from topology) 2) GPS - GHE_Points RTK and other field data are stored here for 2 measured sections in my field area. More data collected in November will be imported after postprocessing. All other shape and layer files were created from pre-existing data. Data were organized for the global field area (southern Mule Mountains) and for the Paul Spur area of interest.

2 Processes Step 1: Define Coordinate system Point data were collected in the field in UTM coordinates (NAD83, Zone 12N). I prefer to bring these data in later without having to do any conversion. Step 2: Reproject raster/vector data to UTM Coordinate system Elevation, Road, and orthophoto raster data were downloaded in various coordinate systems. Example elevation data acquired in GCS NAD83 coordinates:


3 All downloaded raster and vector data were converted to UTM Zone 12 coordinates using ArcToolbox -> Data management tools -> Projections and transformations (for feature and raster) Step 3: Fix elevation data Raw elevation data did not show certain features (outlined in red):


4 A clipping mask was set up in Spatial Analyst to Paul Spur area of interest and working directory was assigned: Elevation raster data were clipped to the paul spur AOI using Spatial Analyst raster calculator and made permanent:
 Imported, reprojected, and clipped to Paul Spur Area of Interest: Much better resolution for a ~1mi x 2mi area.")
5 The Paul Spur feature is not well-visualized here, as resolution is 28m x28m. The area of interest is ~2km x 3km. I found 1/9 arc second data (resolution ~3m x 3m) Imported, reprojected, and clipped to Paul Spur Area of Interest: Much better resolution for a ~1mi x 2mi area. Tweaked the raster data symbology and added hillshade to bring out elevation data for Paul Spur.

6 Step 4: Create orthophoto Reprojected orthoimagery was added to ArcMap:

7 The default symbology yielded poor color quality. The raster data were symbolized to show a more realistic aerial image, using 4 standard deviations in the RGB composite:

8 The orthophoto looked faded, but colors were more accurate. Minimum-Maximum stretched yielded a very washed out and red photo. Tweaking the histogram often yielded discoloration. I decided to stick with min-max and apply a hillshade to bring out


9 the relief of the patch reef. I clipped the hillshade to Paul Spur AOI with no problems. However, when I tried to clip the orthoimage from the Spatial Analyst tool in ArcMap, I received the following error: I made sure the raster was not active in another window and retried, but received the same error.
.")
10 For the rest of the map area, 1 arc-second elevation data were clipped to Outline from geodatabase using clip tool in ArcToolbox for rasters: A hillshade was created to use with geologic map below (see above image). Step 4: Add geologic map image for digitizing:
 in ArcMap to display in")
 Feature classes were")
11 Spatial Reference was defined in ArcCatalog: Geology raster was georeferenced w/ Roads vector data (also in UTM zone 12 coordinates) in ArcMap to display in real world coordinates using georeferencing tool. Step 5: Create Geology geodatabase for digitizing 1) Feature classes were created in Arizona personal geodatabase

12 New Geology feature data set Faults (line) Outline (polygon) Rock contacts (line) 2) Domains were created for data entry after digitizing and attach to feature classes as needed: Faults were digitized, attributed and symbolized:


13 Unit contacts were digitized, set snapping VEE for faults, contacts, outline) and defaults:

.")
14 A topology was created from faults and contacts and errors were fixed. NOTE: Did not include dangle rule because I could not fix the point errors, even though lines were snapped together while digitizing (trust me I checked snapping because I did this twice). Rock unit polygons were created from topology using BOTH faults and contacts.


15 Unit name and abbreviation fields were added to new polygon feature class: Rock polygons were attributed: Made geology polygons transparent and added the hillshade layer calculated from the elevation raster and applied labels to polygons layer: properties -> label by unit_abbrev:

16 Converted labels to Annotation to make labels neater in congested areas:

.")
17 Extracted Elevation contours from DEM: Spatial Analysis -> Surface Analysis -> contour, using Polygons feature class as the mask. Symbolized 100-contours 1pt, other contours 0.25pt: Final geologic map includes digitized geology polygons, unit labels, elevation contours, UTM grid at 2000m X/Y spacing, hillshade, and roads (see attached map). Step 6: Import XYZ data and add fields for data storage

18 1) In ArcToolbox: 3D Analyst Tools ->Conversion -> From File -> ASCII3D to Feature Class. Created GHE_Points feature class for 2 measured sections that were calibrated with RTK GPS points. Data were collected with Trimble RTK- GPS during Summer, ) Add fields to store other data: Strike (short integer with strike domain) Dip (short integer with dip domain) Secn_loc (text) name of measured section Spl_No (short integer) stores number of samples taken for section Image (raster) outcrop photos or photomicrographs from thin section 3) Add feature class to ArcMap and populate fields with data from measured sections. NOTE: This is a terrible data set. I collected RTK points of facies contacts and not
 Could not figure out how to filter the data to filter to show which points have photos, but it would be nice to have a map of GPS points with field photos so I can look at vertical facies trends.")
19 samples and strikes and dips like I should have. The dataset is thus VERY incomplete I still need to get my other post-processed data collected in November from BEG staff. 4) Could not figure out how to filter the data to filter to show which points have photos, but it would be nice to have a map of GPS points with field photos so I can look at vertical facies trends. It would also be nice to store more than one photo for each point, but I could not figure out how to do this either I tried creating multiple raster fields but that was not allowed; also tried to add another photo but the first photo was overwritten.
20
Watershed Delineation
 Watershed Delineation Jessica L. Watkins, University of Georgia 2 April 2009 Updated by KC Love February 25, 2011 PURPOSE For this project, I delineated watersheds for the Coweeta synoptic sampling area
Geo 327G Semester Project. Landslide Suitability Assessment of Olympic National Park, WA. Fall Shane Lewis
 Geo 327G Semester Project Landslide Suitability Assessment of Olympic National Park, WA Fall 2011 Shane Lewis 1 I. Problem Landslides cause millions of dollars of damage nationally every year, and are
Determining the Location of the Simav Fault
 Lindsey German May 3, 2012 Determining the Location of the Simav Fault 1. Introduction and Problem Formulation: The issue I will be focusing on involves interpreting the location of the Simav fault in
Data Structures & Database Queries in GIS
 Data Structures & Database Queries in GIS Objective In this lab we will show you how to use ArcGIS for analysis of digital elevation models (DEM s), in relationship to Rocky Mountain bighorn sheep (Ovis
Outcrop suitability analysis of blueschists within the Dry Lakes region of the Condrey Mountain Window, North-central Klamaths, Northern California
 Outcrop suitability analysis of blueschists within the Dry Lakes region of the Condrey Mountain Window, North-central Klamaths, Northern California (1) Introduction: This project proposes to assess the
Lauren Jacob May 6, Tectonics of the Northern Menderes Massif: The Simav Detachment and its relationship to three granite plutons
 Lauren Jacob May 6, 2010 Tectonics of the Northern Menderes Massif: The Simav Detachment and its relationship to three granite plutons I. Introduction: Purpose: While reading through the literature regarding
GIS CONCEPTS ARCGIS METHODS AND. 3 rd Edition, July David M. Theobald, Ph.D. Warner College of Natural Resources Colorado State University
 GIS CONCEPTS AND ARCGIS METHODS 3 rd Edition, July 2007 David M. Theobald, Ph.D. Warner College of Natural Resources Colorado State University Copyright Copyright 2007 by David M. Theobald. All rights
MERGING (MERGE / MOSAIC) GEOSPATIAL DATA
 GEOSPATIAL DATA") This help guide describes how to merge two or more feature classes (vector) or rasters into one single feature class or raster dataset. The Merge Tool The Merge Tool combines input features from input
This help guide describes how to merge two or more feature classes (vector) or rasters into one single feature class or raster dataset. The Merge Tool The Merge Tool combines input features from input
EnvSci 360 Computer and Analytical Cartography
 EnvSci 360 Computer and Analytical Cartography Lecture 7 Mapping Images, Surfaces, and 3-D Data Brief Overview of Imagery What is Imagery? A spatial data model that defines space as an array of equally
Hydrology and Watershed Analysis
 Hydrology and Watershed Analysis Manual By: Elyse Maurer Reference Map Figure 1. This map provides context to the area of Washington State that is being focused on. The red outline indicates the boundary
These modules are covered with a brief information and practical in ArcGIS Software and open source software also like QGIS, ILWIS.
 Online GIS Training and training modules covered are: 1. ArcGIS, Analysis, Fundamentals and Implementation 2. ArcGIS Web Data Sharing 3. ArcGIS for Desktop 4. ArcGIS for Server These modules are covered
Calhoun County, Texas Under 5 Meter Sea Level Rise
 Kyle Kacal GEO 327G Calhoun County, Texas Under 5 Meter Sea Level Rise PROBLEM AND PURPOSE: Sea level rise is threat to all coastal areas. Although natural sea level rise happens at a very slow rate, hurricanes
of my field area located in McKittrick Canyon, Guadalupe Mountains, New Mexico and west
 Fall 2009 GIS Project: Correcting a Partial Geologic Map of Guadalupe Mountain National Park, New Mexico and west Texas and Developing a Geodatabase for McKittrick Canyon, New Mexico and west Texas Cari
Outline. Chapter 1. A history of products. What is ArcGIS? What is GIS? Some GIS applications Introducing the ArcGIS products How does GIS work?
 Outline Chapter 1 Introducing ArcGIS What is GIS? Some GIS applications Introducing the ArcGIS products How does GIS work? Basic data formats The ArcCatalog interface 1-1 1-2 A history of products Arc/Info
The Geodatabase Working with Spatial Analyst. Calculating Elevation and Slope Values for Forested Roads, Streams, and Stands.
 GIS LAB 7 The Geodatabase Working with Spatial Analyst. Calculating Elevation and Slope Values for Forested Roads, Streams, and Stands. This lab will ask you to work with the Spatial Analyst extension.
Display data in a map-like format so that geographic patterns and interrelationships are visible
 Vilmaliz Rodríguez Guzmán M.S. Student, Department of Geology University of Puerto Rico at Mayagüez Remote Sensing and Geographic Information Systems (GIS) Reference: James B. Campbell. Introduction to
Exercise 3: GIS data on the World Wide Web
 Exercise 3: GIS data on the World Wide Web These web sites are a few examples of sites that are serving free GIS data. Many other sites exist. Search in Google or other search engine to find GIS data for
The Looming Threat of Rising Sea Levels to the Florida Keys
 The Looming Threat of Rising Sea Levels to the Florida Keys 1. Introduction Sea levels are rising, and possibly faster than we thought before. In a recent report in 2017 by the National Oceanic and Atmospheric
Exercise 6: Working with Raster Data in ArcGIS 9.3
 Exercise 6: Working with Raster Data in ArcGIS 9.3 Why Spatial Analyst? Grid query Grid algebra Grid statistics Summary by zone Proximity mapping Reclassification Histograms Surface analysis Slope, aspect,
Field Maps of the Beypazari Granitoid north central Turkey. Pamela Speciale GEO327 4 May 2012
 Field Maps of the Beypazari Granitoid north central Turkey Pamela Speciale GEO327 4 May 2012 2 Contents Introduction... 4 Background... 4 The Problem... 4 This Report... 5 Data Collection... 5 Existing
NR402 GIS Applications in Natural Resources
 NR402 GIS Applications in Natural Resources Lesson 1 Introduction to GIS Eva Strand, University of Idaho Map of the Pacific Northwest from http://www.or.blm.gov/gis/ Welcome to NR402 GIS Applications in
Introduction to Geographic Information Systems (GIS): Environmental Science Focus
: Environmental Science Focus") Introduction to Geographic Information Systems (GIS): Environmental Science Focus September 9, 2013 We will begin at 9:10 AM. Login info: Username:!cnrguest Password: gocal_bears Instructor: Domain: CAMPUS
Introduction to Geographic Information Systems (GIS): Environmental Science Focus September 9, 2013 We will begin at 9:10 AM. Login info: Username:!cnrguest Password: gocal_bears Instructor: Domain: CAMPUS
Outline Anatomy of ArcGIS Metadata Data Types Vector Raster Conversion Adding Data Navigation Symbolization Methods Layer Files Editing Help Files
 UPlan Training Lab Exercise: Introduction to ArcGIS Outline Anatomy of ArcGIS Metadata Data Types Vector Raster Conversion Adding Data Navigation Symbolization Methods Layer Files Editing Help Files Anatomy
Census Mapping with ArcGIS
 Census Mapping with ArcGIS Jin Lee, GIS manager at the Lewis Mumford Center and Center for Social and Demographic Analysis Email: jwlee@albany.edu Phone: 442-5402 Quick summary of Day1 http://csda.albany.edu/events-news/gisworkshop_outline_fall_3-1.pdf
How to Create Stream Networks using DEM and TauDEM
 How to Create Stream Networks using DEM and TauDEM Take note: These procedures do not describe all steps. Knowledge of ArcGIS, DEMs, and TauDEM is required. TauDEM software ( http://hydrology.neng.usu.edu/taudem/
Today: GEOL 452/552 - GIS for Geoscientists I. Lecture 3 - Chapter 1. GIS vector Data (review) Let s annotate this layer (draw on paper)
 Let s annotate this layer (draw on paper)") Today: GEOL 452/552 - GIS for Geoscientists I Lecture 3 - Chapter 1 GIS vector data - review raster data history: ArcView/ArcINFO - ArcGIS types of GIS data files Lab: finish Ch. 1 tutorial and HW1 Please
Today: GEOL 452/552 - GIS for Geoscientists I Lecture 3 - Chapter 1 GIS vector data - review raster data history: ArcView/ArcINFO - ArcGIS types of GIS data files Lab: finish Ch. 1 tutorial and HW1 Please
Overview key concepts and terms (based on the textbook Chang 2006 and the practical manual)
") Introduction Geo-information Science (GRS-10306) Overview key concepts and terms (based on the textbook 2006 and the practical manual) Introduction Chapter 1 Geographic information system (GIS) Geographically
Introduction Geo-information Science (GRS-10306) Overview key concepts and terms (based on the textbook 2006 and the practical manual) Introduction Chapter 1 Geographic information system (GIS) Geographically
Tutorial 8 Raster Data Analysis
 Objectives Tutorial 8 Raster Data Analysis This tutorial is designed to introduce you to a basic set of raster-based analyses including: 1. Displaying Digital Elevation Model (DEM) 2. Slope calculations
Working with Digital Elevation Models and Digital Terrain Models in ArcMap 9
 Working with Digital Elevation Models and Digital Terrain Models in ArcMap 9 1 TABLE OF CONTENTS INTRODUCTION...3 WORKING WITH DIGITAL TERRAIN MODEL (DTM) DATA FROM NRVIS, CITY OF KITCHENER, AND CITY OF
Learning ArcGIS: Introduction to ArcCatalog 10.1
 Learning ArcGIS: Introduction to ArcCatalog 10.1 Estimated Time: 1 Hour Information systems help us to manage what we know by making it easier to organize, access, manipulate, and apply knowledge to the
Sea Level Scare in South Carolina. by William Witmer GEO 327G 5 December 2016
 Sea Level Scare in South Carolina by William Witmer GEO 327G 5 December 2016 Problem Hilton Head Island in South Carolina attracts 2.5 million tourists every year. This popular locale features endangered
WORKING WITH DMTI DIGITAL ELEVATION MODELS (DEM)
") WORKING WITH DMTI DIGITAL ELEVATION MODELS (DEM) Contents (Ctrl-Click to jump to a specific page) Manipulating the DEM Step 1: Finding the DEM Tiles You Need... 2 Step 2: Importing the DEM Tiles into ArcMap...
WORKING WITH DMTI DIGITAL ELEVATION MODELS (DEM) Contents (Ctrl-Click to jump to a specific page) Manipulating the DEM Step 1: Finding the DEM Tiles You Need... 2 Step 2: Importing the DEM Tiles into ArcMap...
GeoWEPP Tutorial Appendix
 GeoWEPP Tutorial Appendix Chris S. Renschler University at Buffalo - The State University of New York Department of Geography, 116 Wilkeson Quad Buffalo, New York 14261, USA Prepared for use at the WEPP/GeoWEPP
Lecture 2. A Review: Geographic Information Systems & ArcGIS Basics
 Lecture 2 A Review: Geographic Information Systems & ArcGIS Basics GIS Overview Types of Maps Symbolization & Classification Map Elements GIS Data Models Coordinate Systems and Projections Scale Geodatabases
Lecture 6 - Raster Data Model & GIS File Organization
 Lecture 6 - Raster Data Model & GIS File Organization I. Overview of Raster Data Model Raster data models define objects in a fixed manner see Figure 1. Each grid cell has fixed size (resolution). The
Lab#8: Working With Geodatabases. create a geodatabase with feature datasets, tables, raster datasets, and raster catalogs
 Lab#8: Geodatabase Concepts Page#1 of 25 In this lab, you will learn how to: Lab#8: Working With Geodatabases create a geodatabase with feature datasets, tables, raster datasets, and raster catalogs join
GIS IN ECOLOGY: ANALYZING RASTER DATA
 GIS IN ECOLOGY: ANALYZING RASTER DATA Contents Introduction... 2 Tools and Functionality for Raster Data... 2 Data Sources... 3 Tasks... 4 Getting Started... 4 Creating Raster Data... 5 Summary Statistics...
ESRI Object Models and Data Capture 2/1/2018
 Number 123 124 125 ESRI* Object Models; Data Capture Feature Class (spatial table) Age_Ma 142 136 1_sigma 1.5 2.0 Rx_Type B_schist G_schist Object Class (nonspatial table) Size_kg 3.4 1.3 Y Control Point
caused displacement of ocean water resulting in a massive tsunami. II. Purpose
 I. Introduction The Great Sumatra Earthquake event took place on December 26, 2004, and was one of the most notable and devastating natural disasters of the decade. The event consisted of a major initial
Welcome to NR502 GIS Applications in Natural Resources. You can take this course for 1 or 2 credits. There is also an option for 3 credits.
 Welcome to NR502 GIS Applications in Natural Resources. You can take this course for 1 or 2 credits. There is also an option for 3 credits. The 1st credit consists of a series of readings, demonstration,
Watershed Analysis of the Blue Ridge Mountains in Northwestern Virginia
 Watershed Analysis of the Blue Ridge Mountains in Northwestern Virginia Mason Fredericks December 6, 2018 Purpose The Blue Ridge Mountain range is one of the most popular mountain ranges in the United
In this exercise we will learn how to use the analysis tools in ArcGIS with vector and raster data to further examine potential building sites.
 GIS Level 2 In the Introduction to GIS workshop we filtered data and visually examined it to determine where to potentially build a new mixed use facility. In order to get a low interest loan, the building
GIS IN ECOLOGY: ANALYZING RASTER DATA
 GIS IN ECOLOGY: ANALYZING RASTER DATA Contents Introduction... 2 Raster Tools and Functionality... 2 Data Sources... 3 Tasks... 4 Getting Started... 4 Creating Raster Data... 5 Statistics... 8 Surface
Designing GIS Databases to Support Mapping and Map Production Charlie Frye, ESRI Redlands Aileen Buckley, ESRI Redlands
 Designing GIS Databases to Support Mapping and Map Production Charlie Frye, ESRI Redlands Aileen Buckley, ESRI Redlands 1 Designing GIS Databases to Support Mapping and Map Production Charlie Frye, ESRI
Gravity and Magnetic Anomalies Compared to Moho Depth throughout the State of Texas
 Gravity and Magnetic Anomalies Compared to Moho Depth throughout the State of Texas Taylor Borgfeldt Introduction My Master s thesis is to improve and create additional crustal seismic velocity models
ArcGIS Tools for Professional Cartography
 ArcGIS Tools for Professional Cartography By Makram Murad-al-shaikh M.S. Cartography Senior instructor ESRI Educational Services ICC - A Coruña - Spain, 9-16 July, 2005 Overview Overview of the ArcGIS
Effects of Rising Sea Levels on Coral Reef and Mangrove Distributions along the Great Barrier Reef in Australia
 Effects of Rising Sea Levels on Coral Reef and Mangrove Distributions along the Great Barrier Reef in Australia Sarah Barfield Graduate Student Department of Integrative Biology University of Texas, Austin
Working with Digital Elevation Models and Spot Heights in ArcMap
 Working with Digital Elevation Models and Spot Heights in ArcMap 10.3.1 1 TABLE OF CONTENTS INTRODUCTION... 3 WORKING WITH SPOT HEIGHTS FROM NRVIS, CITY OF KITCHENER, AND CITY OF TORONTO...4 WORKING WITH
Measuring earthquake-generated surface offsets from high-resolution digital topography
 Measuring earthquake-generated surface offsets from high-resolution digital topography July 19, 2011 David E. Haddad david.e.haddad@asu.edu Active Tectonics, Quantitative Structural Geology, and Geomorphology
Working with Digital Elevation Models in ArcGIS 8.3
 Working with Digital Elevation Models in ArcGIS 8.3 The homework that you need to turn in is found at the end of this document. This lab continues your introduction to using the Spatial Analyst Extension
JJ Munoz. Explanation of the Project/Outline
 JJ Munoz Helper GEO 386G 1 December, 2016 GIS Project: Using ArcHydro and Surface Roughness tools to Determine Alluvial Fan Catchment Area Morphology Statistics from 1-meter resolution LiDAR DEM s. Explanation
Delineation of high landslide risk areas as a result of land cover, slope, and geology in San Mateo County, California
 Delineation of high landslide risk areas as a result of land cover, slope, and geology in San Mateo County, California Introduction Problem Overview This project attempts to delineate the high-risk areas
Classification of Erosion Susceptibility
 GEO327G: GIS & GPS Applications in Earth Sciences Classification of Erosion Susceptibility Denali National Park, Alaska Zehao Xue 12 3 2015 2 TABLE OF CONTENTS 1 Abstract... 3 2 Introduction... 3 2.1 Universal
ESRI* Object Models; Data Capture
 ESRI* Object Models; Data Capture * Environmental Systems Research Institute Feature Class (spatial table) Number Age_Ma 1_sigma Rx_Type Size_kg 123 124 125 142 1.5 B_schist 136 2.0 G_schist Object Class
Exercise 12 Spatial Analysis on Antarctica
 Exercise 12 Spatial Analysis on Antarctica Due: Tuesday, March 6 Goal: Using ArcMap s Spatial Analyst tools for digital elevation models and rasters. Datasets: Bed elevation Ice thickness Surface elevation
Data Set Projection Checklist
 1 of 6 12/20/2012 12:38 PM Data Set Projection Checklist There are two projections/coordinate systems you must worry about: 1. 2. That of your map. You can pick this to be whatever you want, and your GIS
LANDSLIDE HAZARD ANALYSIS AND ITS EFFECT ON ENDANGERED SPECIES HABITATS, GRAND COUNTY, UTAH
 12/5/2016 LANDSLIDE HAZARD ANALYSIS AND ITS EFFECT ON ENDANGERED SPECIES HABITATS, GRAND COUNTY, UTAH GIS Final Project Ashlyn Murphy Fall 2016 1. Introduction and Problem A well-known geologic hazard
Task 1: Start ArcMap and add the county boundary data from your downloaded dataset to the data frame.
 Exercise 6 Coordinate Systems and Map Projections The following steps describe the general process that you will follow to complete the exercise. Specific steps will be provided later in the step-by-step
ESRI* Object Models; Data Capture
 ESRI* Object Models; Data Capture * Environmental Systems Research Institute Feature Class (spatial table) Number Age_Ma 1_sigma Rx_Type Size_kg 123 124 125 142 1.5 B_schist 136 2.0 G_schist Object Class
Delineation of Watersheds
 Delineation of Watersheds Adirondack Park, New York by Introduction Problem Watershed boundaries are increasingly being used in land and water management, separating the direction of water flow such that
Part 1: GIS Data from the Web: Downloading and Projecting Digital Elevation Models (DEM) and BTS Road data
 and BTS Road data") Field Geology I Hometown GIS, Part 1 October 03, 2005 Lab Exercise 2.1 Part 1: GIS Data from the Web: Downloading and Projecting Digital Elevation Models (DEM) and BTS Road data 1. Introduction a. GIS
Field Geology I Hometown GIS, Part 1 October 03, 2005 Lab Exercise 2.1 Part 1: GIS Data from the Web: Downloading and Projecting Digital Elevation Models (DEM) and BTS Road data 1. Introduction a. GIS
Acknowledgments xiii Preface xv. GIS Tutorial 1 Introducing GIS and health applications 1. What is GIS? 2
 Acknowledgments xiii Preface xv GIS Tutorial 1 Introducing GIS and health applications 1 What is GIS? 2 Spatial data 2 Digital map infrastructure 4 Unique capabilities of GIS 5 Installing ArcView and the
Effects of sea level rise on shallow atolls in the South Pacific
 Tuvalu 2100 Effects of sea level rise on shallow atolls in the South Pacific Kristin Vollmann GEO 327GG December 3, 20100 INTRODUCTION Residents of the tiny island nation of Tuvalu, withh a maximumm elevation
Using Feature Templates for Complex Editing
 Using Feature Templates for Complex Editing By Mike Price, Entrada/San Juan, Inc. What You Will Need ArcGIS 10.3 for Desktop (Basic, Standard, or Advanced license) Sample dataset downloaded from esri.com/arcuser
GEO 327G Fall 2016 Project: Expansion of the Columbia South Shore Well Field
 GEO 327G Fall 2016 Project: Expansion of the Columbia South Shore Well Field Problem: If the Portland, OR surface water supply is rendered useless by turbidity or another natural event, then the Columbia
How to Convert USGS Topographic GeoPDF 1 Maps to GeoTIFF using ArcGIS 10.4
 How to Convert USGS Topographic GeoPDF 1 Maps to GeoTIFF using ArcGIS 10.4 This tutorial assumes that you have: 1) downloaded some USGS geopdfs, 2) a pdf reader such as Adobe Acrobat, and 3) ArcGIS 10.4
Suitability Analysis on Second Home Areas Selection in Smithers British Columbia
 GEOG 613 Term Project Suitability Analysis on Second Home Areas Selection in Smithers British Columbia Zhengzhe He November 2005 Abstract Introduction / background Data Source Data Manipulation Spatial
ESRI Object Models and Data Capture 9/18/ /18/2014 M. Helper GEO327G/386G, UT Austin 2. ESRI Arc/Info ArcView ArcGIS
 ESRI Object Models; Data Capture Conceptual Models Conceptual Models Characterized all features or phenomena as: Feature Class (spatial table) Number Age_Ma 1_sigma Rx_Type 123 142 1.5 B_schist 124 136
Lecture 9: Reference Maps & Aerial Photography
 Lecture 9: Reference Maps & Aerial Photography I. Overview of Reference and Topographic Maps There are two basic types of maps? Reference Maps - General purpose maps & Thematic Maps - maps made for a specific
GIS CONCEPTS ARCGIS METHODS AND. 2 nd Edition, July David M. Theobald, Ph.D. Natural Resource Ecology Laboratory Colorado State University
 GIS CONCEPTS AND ARCGIS METHODS 2 nd Edition, July 2005 David M. Theobald, Ph.D. Natural Resource Ecology Laboratory Colorado State University Copyright Copyright 2005 by David M. Theobald. All rights
Esri UC2013. Technical Workshop.
 Esri International User Conference San Diego, California Technical Workshops July 9, 2013 CAD: Introduction to using CAD Data in ArcGIS Jeff Reinhart & Phil Sanchez Agenda Overview of ArcGIS CAD Support
GIS Boot Camp for Education June th, 2011 Day 1. Instructor: Sabah Jabbouri Phone: (253) x 4854 Office: TC 136
 x 4854 Office: TC 136") GIS Boot Camp for Education June 27-30 th, 2011 Day 1 Instructor: Sabah Jabbouri Phone: (253) 833-9111 x 4854 Office: TC 136 Email: sjabbouri@greenriver.edu http://www.instruction.greenriver.edu/gis/ Summer
GIS Boot Camp for Education June 27-30 th, 2011 Day 1 Instructor: Sabah Jabbouri Phone: (253) 833-9111 x 4854 Office: TC 136 Email: sjabbouri@greenriver.edu http://www.instruction.greenriver.edu/gis/ Summer
NWT Open Report Delineation of Watersheds in the Mackenzie Mountains
 NWT Open Report 2015-007 Delineation of Watersheds in the Mackenzie Mountains K.L. Pierce and H. Falck Recommended Citation: Pierce, K.L. and Falck, H., 2015. Delineation of watersheds in the Mackenzie
Introduction To Raster Based GIS Dr. Zhang GISC 1421 Fall 2016, 10/19
 Introduction To Raster Based GIS Dr. Zhang GISC 1421 Fall 2016, 10/19 Model of the course Using and making maps Navigating GIS maps Map design Working with spatial data Geoprocessing Spatial data infrastructure
ArcHYDRO: GIS for Water Resources
 SOCRATES ERASMUS Intensive Programme ArcHYDRO: GIS for Water Resources Source: Center for Research in Water Resources, University of Texas at Austin Tutorial: Watershed and Stream Network Delineation Goals
Geographic Information Systems. Introduction to Data and Data Sources
 Geographic Information Systems Introduction to Data and Data Sources Presented by John Showler, NJDA-SSCC NJ SCD GIS Training Session December 10, 209 The Objectives of this session are 3-fold: 1. Introduce
Course overview. Grading and Evaluation. Final project. Where and When? Welcome to REM402 Applied Spatial Analysis in Natural Resources.
 Welcome to REM402 Applied Spatial Analysis in Natural Resources Eva Strand, University of Idaho Map of the Pacific Northwest from http://www.or.blm.gov/gis/ Where and When? Lectures Monday & Wednesday
A Detailed Examination of DTM Creation Methods and Sources. Study Area Overview
 A Detailed Examination of DTM Creation Methods and Sources Adam Mosbrucker & Melinda Lamb Geography 593: Dec. 2 nd, 2010 Study Area Overview Mt. St. Helens -active volcano many eruptions in the past 30
Spatial Data Analysis in Archaeology Anthropology 589b. Kriging Artifact Density Surfaces in ArcGIS
 Spatial Data Analysis in Archaeology Anthropology 589b Fraser D. Neiman University of Virginia 2.19.07 Spring 2007 Kriging Artifact Density Surfaces in ArcGIS 1. The ingredients. -A data file -- in.dbf
Innovation in Geology and Earth Sciences with ArcGIS. Presented by: Mike Price Entrada/San Juan, Inc. Blaine, WA
 Innovation in Geology and Earth Sciences with ArcGIS Presented by: Mike Price Entrada/San Juan, Inc. Blaine, WA Organization Overview Entrada/San Juan is a GIS consultancy based in Blaine, WA Industries
Introduction to Spatial Data Resources and Analysis for research in Urban Design and Planning
 Introduction to Spatial Data Resources and Analysis for research in Urban Design and Planning 2-day workshop notes 27-28 September 2004 Introductions please put on a name tag to help me know who you are
Spatial Analyst: Multiple Criteria Evaluation Material adapted from FOR 4114 developed by Forestry Associate Professor Steve Prisley
 Spatial Analyst: Multiple Criteria Evaluation Material adapted from FOR 4114 developed by Forestry Associate Professor Steve Prisley Section 1: Data In this exercise we will be working with several types
GIS Project: Study on Gulf of Mexico basin provenance in Lower Miocene
 GIS Project: Study on Gulf of Mexico basin provenance in Lower Miocene Introduction Background: The Lower Miocene of the Gulf of Mexico (GOM) Basin is a transitional unit from many respects. It is a time
Terms GIS GPS Vector Data Model Raster Data Model Feature Attribute Table Point Line Polygon Pixel RGB Overlay Function
 FINAL REVIEW FOR GIS (2016) PRACTICAL COMPONENT The first 40 mins of the exam will be open book and will require you to make a map using all the techniques learned over the semester. This map will be e-mailed
Using CAD data in ArcGIS
 Using CAD data in ArcGIS Phil Sanchez and Jeff Reinhart Esri UC 2014 Technical Workshop Agenda Overview of ArcGIS CAD Support Using CAD Datasets in ArcMap Georeferencing CAD data for ArcGIS Loading CAD
Popular Mechanics, 1954
 Introduction to GIS Popular Mechanics, 1954 1986 $2,599 1 MB of RAM 2017, $750, 128 GB memory, 2 GB of RAM Computing power has increased exponentially over the past 30 years, Allowing the existence of
Digital Elevation Models (DEM)
") Digital Elevation Models (DEM) Digital representation of the terrain surface enable 2.5 / 3D views Rule #1: they are models, not reality Rule #2: they always include some errors (subject to scale and data
Digital Elevation Models (DEM) Digital representation of the terrain surface enable 2.5 / 3D views Rule #1: they are models, not reality Rule #2: they always include some errors (subject to scale and data
Conservation Applications of LiDAR Data
 Program: Funding: Conservation Applications of LiDAR Data http://tsp.umn.edu/lidar Environment and Natural Resources Trust Fund Module: Instructor: Exercise: Hydrologic Applications Sean Vaughn, DNR GIS
Trail Flow: Analysis of Drainage Patterns Affecting a Mountain Bike Trail
 Andy Belcher BAE 590 Professor Huffman 12.9.11 Location Trail Flow: Analysis of Drainage Patterns Affecting a Mountain Bike Trail The location of the project area rests in the Cary area of Wake County,
SCHOOL OF ENGINEERING AND TECHNOLOGY COMPUTER LAB
 PHASE 1_6 TH SESSION ARCGIS TRAINING AT KU GIS LABS: INTRODUCTION TO GIS: EXPLORING ARCCATALOG AND ARCGIS TOOLS 6 TH SESSION REPORT: 3 RD -5 TH SEPTEMBER 2014 SCHOOL OF ENGINEERING AND TECHNOLOGY COMPUTER
ISU GIS CENTER S ARCSDE USER'S GUIDE AND DATA CATALOG
 ISU GIS CENTER S ARCSDE USER'S GUIDE AND DATA CATALOG 2 TABLE OF CONTENTS 1) INTRODUCTION TO ARCSDE............. 3 2) CONNECTING TO ARCSDE.............. 5 3) ARCSDE LAYERS...................... 9 4) LAYER
What could you use to indicate historical earth conditions?
 03 22 2014 What could you use to indicate historical earth conditions? Deeds, Plats, Surveys Aerials Topography Soils Rainfall http://search.gsccca.org/plat/bookpagesearch.asp Google Earth as aerial previewer
Digital Elevation Models (DEM) / DTM
 / DTM") Digital Elevation Models (DEM) / DTM Uses in remote sensing: queries and analysis, 3D visualisation, classification input Fogo Island, Cape Verde Republic ASTER DEM / image Banks Peninsula, Christchurch,
Digital Elevation Models (DEM) / DTM Uses in remote sensing: queries and analysis, 3D visualisation, classification input Fogo Island, Cape Verde Republic ASTER DEM / image Banks Peninsula, Christchurch,
SIE 509 Principles of GIS Exercise 5 An Introduction to Spatial Analysis
 SIE 509 Principles of GIS Exercise 5 An Introduction to Spatial Analysis Due: Oct. 31, 2017 Total Points: 50 Introduction: The Governor of Maine is asking communities to look at regionalization for major
Week 7 Last week: This week s topics. GIS and Forest Engineering Applications. FE 257. GIS and Forest Engineering Applications.
 FE 257. GIS and Forest Engineering Applications Week 7 Week 7 Last week: Spatial Projections Questions? Next week- read: Chapter 10: Updating GIS Databases Chapter 12: Synthesis of Techniques Applied to
Handling Raster Data for Hydrologic Applications
 Handling Raster Data for Hydrologic Applications Prepared by Venkatesh Merwade Lyles School of Civil Engineering, Purdue University vmerwade@purdue.edu January 2018 Objective The objective of this exercise
Raster Analysis: An Example
 Raster Analysis: An Example Fires (1 or 4) Slope (1-4) + Geology (1-4) Erosion Ranking (3-12) 1 Typical Raster Model Types: Suitability Modeling: Where is optimum location? Distance Modeling: What is the
Project Information system (Geodatabase) Norway Grants
 Norway Grants") Project Information system (Geodatabase) Norway Grants Lucie Kondrová Lenka Kociánová Zuzana Krejčí Martin Paleček Czech Geological Survey, Department of Information Systems 8.11. 2016 CZECH GEOLOGICAL
Project Information system (Geodatabase) Norway Grants Lucie Kondrová Lenka Kociánová Zuzana Krejčí Martin Paleček Czech Geological Survey, Department of Information Systems 8.11. 2016 CZECH GEOLOGICAL
Midterm Exam. 2) What are three important things to keep in mind when selecting colors for a map? (5)
 What are three important things to keep in mind when selecting colors for a map? (5)") Midterm Exam File Name: LASTNAME_Midterm.pdf Make sure to include your Name, UWNetID, course number, and quarter and year, on the document (points will be deducted if you have not identified your work).
Midterm Exam File Name: LASTNAME_Midterm.pdf Make sure to include your Name, UWNetID, course number, and quarter and year, on the document (points will be deducted if you have not identified your work).
Creating Watersheds from a DEM
 Creating Watersheds from a DEM These instructions enable you to create watersheds of specified area using a good quality Digital Elevation Model (DEM) in ArcGIS 8.1. The modeling is performed in ArcMap