Laboratory Exercise X Most Dangerous Places to Live in the United States Based on Natural Disasters
|
|
|
- Cody Tucker
- 5 years ago
- Views:
Transcription

. Engineering Applications of GIS - Laboratory Exercises. 21. https://scholarsarchive.byu.")
1 Brigham Young University BYU ScholarsArchive Engineering Applications of GIS - Laboratory Exercises Civil and Environmental Engineering 2016 Laboratory Exercise X Most Dangerous Places to Live in the United States Based on Natural Disasters Joshua Alpers Luke Kevan Santiago Tovar Follow this and additional works at: Part of the Civil Engineering Commons, and the Geographic Information Sciences Commons Recommended Citation Alpers, Joshua; Kevan, Luke; and Tovar, Santiago, "Laboratory Exercise X Most Dangerous Places to Live in the United States Based on Natural Disasters" (2016). Engineering Applications of GIS - Laboratory Exercises This Article is brought to you for free and open access by the Civil and Environmental Engineering at BYU ScholarsArchive. It has been accepted for inclusion in Engineering Applications of GIS - Laboratory Exercises by an authorized administrator of BYU ScholarsArchive. For more information, please contact scholarsarchive@byu.edu.
2 GROUP PROJECT: US HISTORICAL NATURAL DISTASTERS By: Los Cachacos Joshua Alpers, Luke Kevan, and Santiago Tovar Graduate Students Department of Civil and Environmental Engineering Brigham Young University Provo, UT For: Daniel P. Ames, Ph.D. CEEn 414 Engineering Applications of GIS Department of Civil and Environmental Engineering Brigham Young University Provo, UT December 8, 2016
3 Laboratory Exercise X Most Dangerous Places to Live in the United States Based on Natural Disasters Background Problem Statement This laboratory assignment simulates the most dangerous places to live in the United States based on natural disasters. The natural disasters that will be used in this assignment include wild fires, earthquakes, landslides, hurricanes, tornadoes, and flooding. These inputs will be required in creating a heat map of the United States showing what locations are most likely to have a high probability of natural disasters. Spatial Considerations For this exercise, you will limit the factors with which you are concerned to the following: River Flood Plain: we know floods occur near rivers, however, a big concern is how far out the flooding goes from the river. We will assign specific conservative distances from the river, in order to represent the flood plains surrounding rivers. Data Wild Fires: To download this data you need to follow the link provided. At the bottom of the page you will see a link that says data publication. Follow this link and you will download a raster that contains fire hazard across the US. Earthquakes: You will need to download a map of historic ground motions based on past earthquakes. Follow the link provided, and under the year 2014 select the GIS Shapefiles link. This downloads a shapefile of ground motions based on path Earthquakes. Tornadoes: You will need to download the free shapefile of tornadoes in the United States. This can be done by following the link and clicking the Download torn.zip. This zip file contains data that can be used in ArcMap to map tornadoes that have occurred between 1950 and Flooding: you will need to download the USA Major Rivers shapefile that is provided by ArcGIS. After following the link there is a download button on the right hand side of the
4 page. These rivers will have to be buffered using a multiple ring buffer tool in order to get carrying flood threat levels for the major rivers in the United States. Landslides: You will need to download a shapefile of landslide hazard from the USGS website. The link provided will take you to the USGS website. On the right hand side of the page click the link Shapefiles of the landslide data. You will then have a shapefile of the landslide hazard across the US. Hurricanes: The last set of data needed for this project is hurricane data. This shapefile is of the path of hurricanes that have occurred in the US in the past. Part of this data is the category of the hurricane, this is what we will use to determine the danger. Additionally, a shapefile of the United States needs to be downloaded for use in this assignment. ModelBuilder Tools Throughout this exercise the following tools will be used: Project is a ModelBuilder tool that can be used to project one set of spatial data from one coordinate system to another. In this laboratory assignment the project tool will need to be used in order to get all of the data into the same coordinate system. Multiple Ring Buffer is a tool that allows the user to project multiple buffers around spatial data sets at specified distances. These buffers can be optionally merged and dissolved using the buffer distance values to create non-overlapping buffers. This tool will be used specifically on the major rivers and hurricane shapefiles. It will be used to generate a higher threat level closer to historical hurricane paths and to the rivers. Buffer is useful tool that creates a buffer around data files at specified distances. The buffer tool will be used on the tornado files to illustrate the threat of the tornadoes over a distance because tornadoes do not necessarily follow the same path every time they appear in a certain area. Polygon to Raster is a tool that can be used to change points, lines, and other polygon features into raster format. By changing data into raster format other important computational tools can be used in order to solve the problems at hand. In this laboratory assignment the Polygon to Raster tool will be used to transform all of the data sets, with the exception of the wildfires data set, from a polygon feature into a raster data set. Reclassify is a useful tool used to change the values of items in a raster. This tool will be used to rate the danger level of the natural disasters on a scale of one to five with five being the highest threat level. Raster Calculator is a tool that allows the user to do math equations using spatial data in ArcGIS. This tool will allow you to multiply and add rasters together in order to combine the threat levels of all of the natural disasters together.

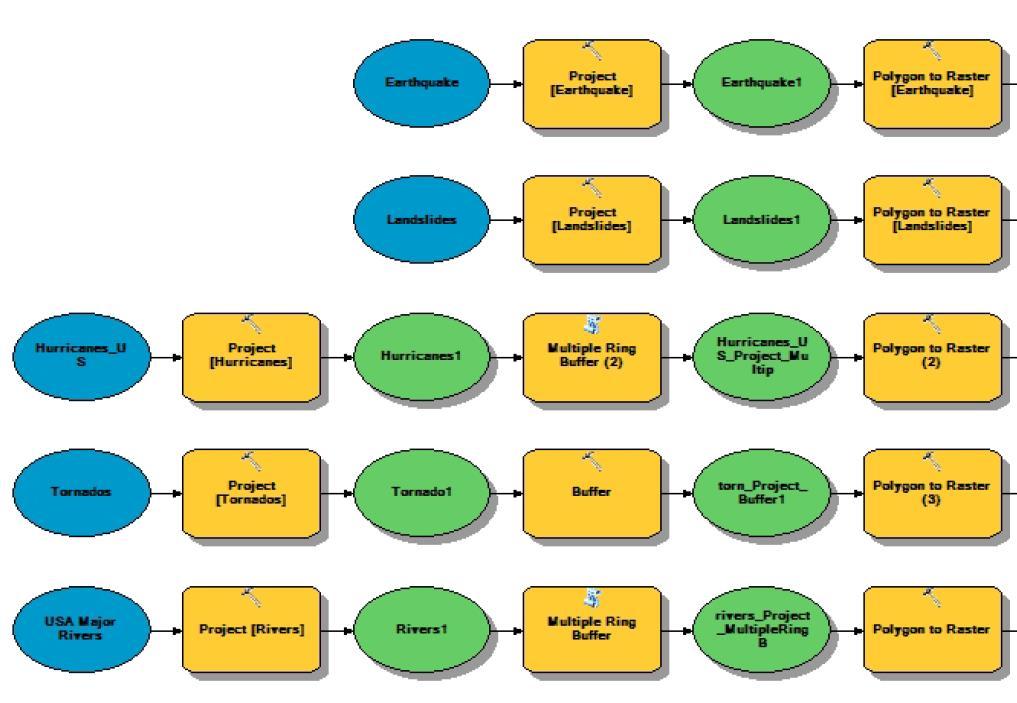
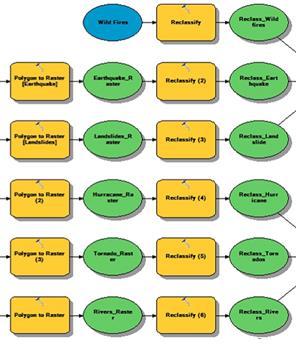
5 Example Model
6
7
8

9 Step by Step Solution For an advanced GIS student, the information up to this point is all you need to complete the assignment and create an output map from the results. Feel free to try conducting the analysis using only the information provided above. If you need specific steps, follow the instructions. Step 1 The first thing that needs to be done outside of the ModelBuilder functions is the intersect tool needs to be used on the United States shapefile and the hurricane data. If these are not in the same projections they both need to be projected so that they are in the same projections in order to increase accuracy. This will greatly reduce the amount of hurricane data that will be used in the computational process. This is important because it will not only reduce the amount of time spent by the program processing the data, but we only care about the hurricane data that impacts the United States. Step 2
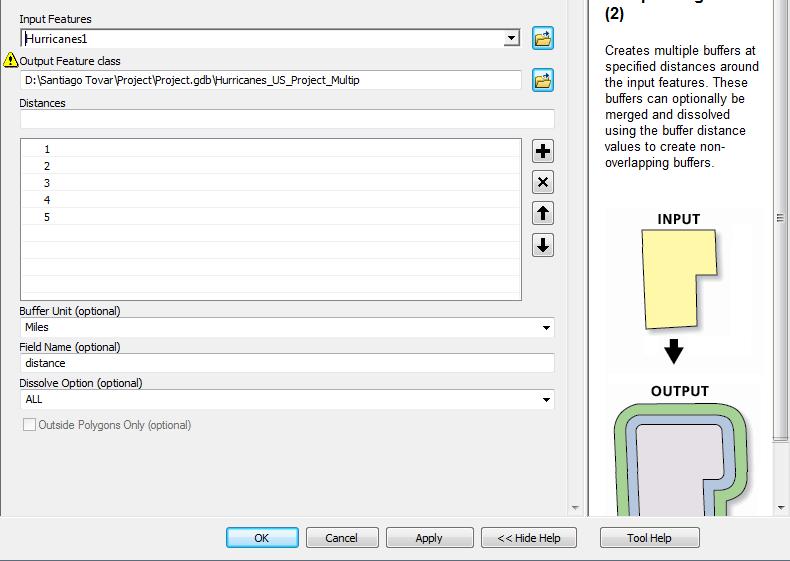
10 The second step of this assignment is to use ModelBuilder to project all of the shapefiles into the correct datum. The creators of this laboratory assignment used the WGS 1964 World Mercator projection, but the user may choose a different projection if they feel it is better. Remember, that all of the input shapefiles and rasters must be in the same projection in order to work accurately. Step 3 The next step would be to buffer the various shapefiles in order to realistically see where each of the natural disasters are going to impact. A normal buffer will be used for the tornadoes data. For this laboratory exercise due to the amount of tornado data that we have a buffer of only one mile will be used. Step 4 Step 4 of this process includes using two multiple ring buffers on the hurricane data and the USA major rivers data. This was done because the threat level for each of those natural disasters is higher the closer they are to the center of those shapefiles. Images of the tools are included below for your convenience. The rivers should be buffered at five increments including 0.25, 0.5, 0.75, 1, and 2. The units that should be used are miles.

11 Generally speaking, hurricanes affect a larger area so a multiple ring buffer tool should be used as well but as increments of 1, 2, 3, 4, and 5 miles. A picture of the tool is included below.
12 Step 5

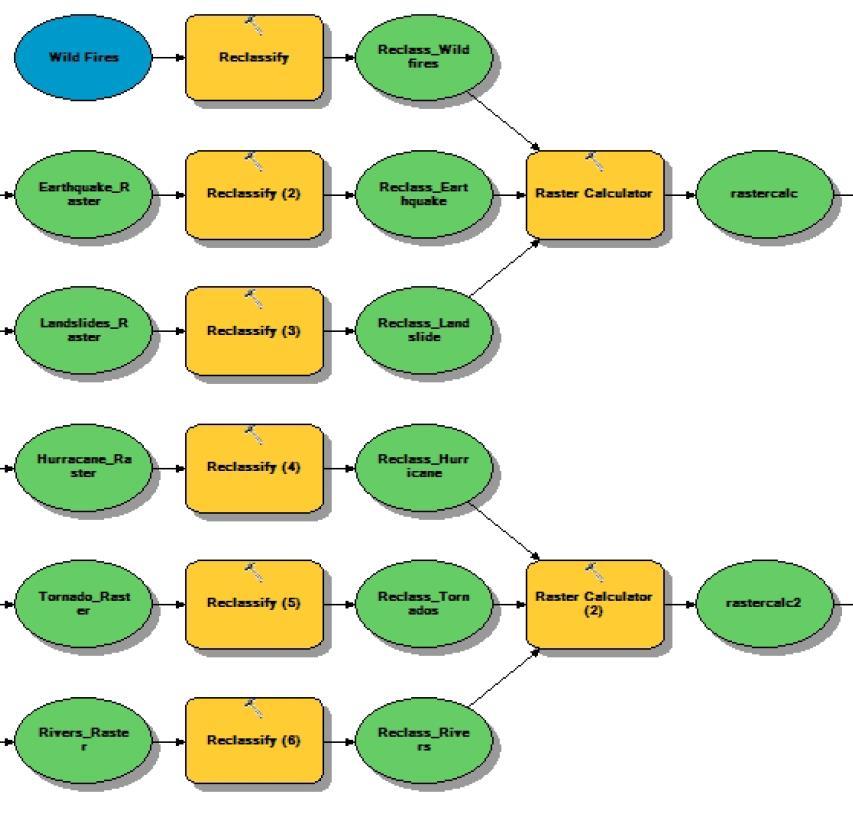
13 The next step in the process is to change all of the polygon files to rasters. All of the input files, with the exception of wildfires, are polygon files and will need to be changed into raster format. It is important that all of the rasters have the same cell size. The creators used a larger cell size of 1000 in order to make the processing time faster. You may choose to have a larger cell size if you wish to further decrease the computational time. Just remember, that if the cell size is increased that the accuracy and definition of the overall model will be decreased. An example of the tool can be seen below. Step 6 See the picture from ModelBuilder above for extra reference. Each of the data sets needs to be reclassified. The reclassify tool will be used to rate the danger level of the natural disasters on a scale of one to five with five being the highest threat level. Remember that the closer the value is to the center the higher the threat level will be. Each of the rasters have a range of values. The values should be divided into five categories. This can be done by selecting classify, then by the number of divisions to 5. Due to outliers in the data, the best way to get more representative results is to change the type of distribution to quantile. This will break up the values into equal quantiles, based on average and standard deviation, and better represent the data. Each of these sections will be given a threat value between one and five with five being the highest threat level. An example of the reclassify tool can be seen below. It is also important to note that landslide hazard data only has one value. This value should be reclassified to 5, so that it has an impact when combined with the other hazard data.

14 Due to the highest risk being closest to the rivers the value of 0.25 miles is given the new value of a threat level of 5 while 2 miles away is given the lowest value of 1. The user needs to make sure that all of the data sets have the NoData section labeled as a value of 1 otherwise when these rasters are multiplied together only areas that have a threat from each of the categories will have any data. The default value for the least amount of threat needs to be a 1.

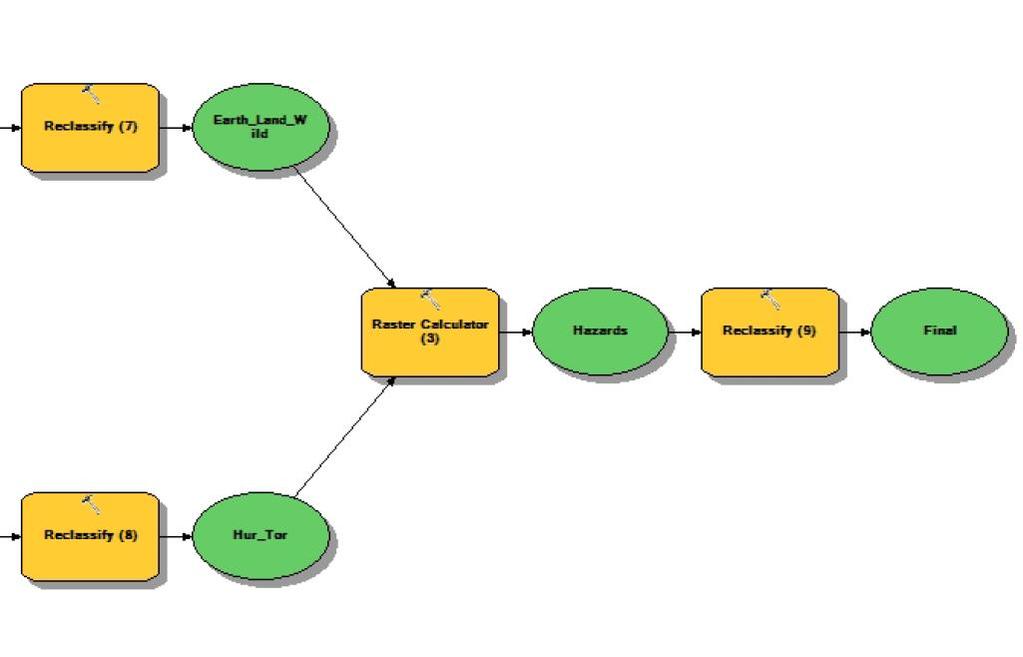
15 Step 7 Deliverables Using the data described above, construct a single ModelBuilder model that will prepare all of the input data for the US Historical Natural Disasters; and then conduct the analysis. As noted previously, this analysis is to be done for the United States and all other results outside of the United States should be clipped off. Only consider the six inputs included in this assignment. Prepare a report in the form of a word document that contains a screenshot of your model that clearly shows all elements of the model, a list of the steps that were taken in the model building process, and a final map of your results. Make sure to review the rubric at the end of this chapter for the full requirements of the laboratory exercise. References

16 Example Map
17 Rubric for Most Dangerous Places to Live Item Points Assignment Title, Author Name, Date, Course Name /5 Brief summary of the requirements of the project and why this projec is useful /5 Describe your model -List each of the tools used: (2 pts) -List tool settings applied for the analysis (could someone repeat the assignment using your lab report?): (2 pts) -List all input, intermediate, and output datasets: (2 pts) /10 -Describe each input dataset including type (point, line, polygon, raster) and the source of the data: (2 pts) -Describe each output dataset (point, line, polygon, raster): (2 pts) -One full page(8.5x11) showing your model (5pts) -All text is readable (at least 10 point font) (3 pts) -All tools and data sets are shown (2 pts) -Describe the areas that are most hazardous for people living in that area. (3 pts) -Describe any indescressions you may detect in the logic of the data, and describe what can be done to fix it? (4pts) Make a full page (8.5x11) map showing the results of your hazard analysis. -Map title: (1 pt) -Neat line: (1 pt) -North Arrow: (1 pt) -Scale Bar: (1 pt) -Text box with author name, date, map projection: (1 pt) -The most obvious hazard areas are clear: (3 pts) -All datasets clearly symbolized: (1 pt) -Visible basemap: (1 pt) -Data points showing existing cell phone towers: (1 pt) -Zoomed to an appropriate scale for viewing analysis results: (1 pt) -All text is legible on printed map: (1 pt) Bonus Task: Repeat the lab exercise with a different set of data. Include in your report what data you used, how you aquired it, what, if anything, you changed to complete the exercise work. Also include an additional full page map showing your results. /10 /7 /13 Instructors Discretion
Laboratory Exercise Possible Zara Locations in Utah
 Brigham Young University BYU ScholarsArchive Engineering Applications of GIS - Laboratory Exercises Civil and Environmental Engineering 2017 Laboratory Exercise Possible Zara Locations in Utah Garlick
Laboratory Exercise - Temple-View Least- Cost Mountain Bike Trail
 Brigham Young University BYU ScholarsArchive Engineering Applications of GIS - Laboratory Exercises Civil and Environmental Engineering 2017 Laboratory Exercise - Temple-View Least- Cost Mountain Bike
Tutorial 8 Raster Data Analysis
 Objectives Tutorial 8 Raster Data Analysis This tutorial is designed to introduce you to a basic set of raster-based analyses including: 1. Displaying Digital Elevation Model (DEM) 2. Slope calculations
How to Create Stream Networks using DEM and TauDEM
 How to Create Stream Networks using DEM and TauDEM Take note: These procedures do not describe all steps. Knowledge of ArcGIS, DEMs, and TauDEM is required. TauDEM software ( http://hydrology.neng.usu.edu/taudem/
In this exercise we will learn how to use the analysis tools in ArcGIS with vector and raster data to further examine potential building sites.
 GIS Level 2 In the Introduction to GIS workshop we filtered data and visually examined it to determine where to potentially build a new mixed use facility. In order to get a low interest loan, the building
GIS CONCEPTS ARCGIS METHODS AND. 2 nd Edition, July David M. Theobald, Ph.D. Natural Resource Ecology Laboratory Colorado State University
 GIS CONCEPTS AND ARCGIS METHODS 2 nd Edition, July 2005 David M. Theobald, Ph.D. Natural Resource Ecology Laboratory Colorado State University Copyright Copyright 2005 by David M. Theobald. All rights
GIS CONCEPTS ARCGIS METHODS AND. 3 rd Edition, July David M. Theobald, Ph.D. Warner College of Natural Resources Colorado State University
 GIS CONCEPTS AND ARCGIS METHODS 3 rd Edition, July 2007 David M. Theobald, Ph.D. Warner College of Natural Resources Colorado State University Copyright Copyright 2007 by David M. Theobald. All rights
Outcrop suitability analysis of blueschists within the Dry Lakes region of the Condrey Mountain Window, North-central Klamaths, Northern California
 Outcrop suitability analysis of blueschists within the Dry Lakes region of the Condrey Mountain Window, North-central Klamaths, Northern California (1) Introduction: This project proposes to assess the
Exercise 2: Working with Vector Data in ArcGIS 9.3
 Exercise 2: Working with Vector Data in ArcGIS 9.3 There are several tools in ArcGIS 9.3 used for GIS operations on vector data. In this exercise we will use: Analysis Tools in ArcToolbox Overlay Analysis
Compilation of GIS data for the Lower Brazos River basin
 Compilation of GIS data for the Lower Brazos River basin Francisco Olivera, Ph.D., P.E. Srikanth Koka Lauren Walker Aishwarya Vijaykumar Department of Civil Engineering December 5, 2011 Contents Brief
Delineation of Watersheds
 Delineation of Watersheds Adirondack Park, New York by Introduction Problem Watershed boundaries are increasingly being used in land and water management, separating the direction of water flow such that
Vector Analysis: Farm Land Suitability Analysis in Groton, MA
 Vector Analysis: Farm Land Suitability Analysis in Groton, MA Written by Adrienne Goldsberry, revised by Carolyn Talmadge 10/9/2018 Introduction In this assignment, you will help to identify potentially
Hazard Assessment of Lava Flows, Wildfires, and Tsunamis on the Big Island of Hawaii s population. By: Thomas Ditges
 Hazard Assessment of Lava Flows, Wildfires, and Tsunamis on the Big Island of Hawaii s population By: Thomas Ditges The Problem: The Big Island of Hawaii is the largest and most dangerous of the Hawaiian
Exercise 2: Working with Vector Data in ArcGIS 9.3
 Exercise 2: Working with Vector Data in ArcGIS 9.3 There are several tools in ArcGIS 9.3 used for GIS operations on vector data. In this exercise we will use: Analysis Tools in ArcToolbox Overlay Analysis
Geo 327G Semester Project. Landslide Suitability Assessment of Olympic National Park, WA. Fall Shane Lewis
 Geo 327G Semester Project Landslide Suitability Assessment of Olympic National Park, WA Fall 2011 Shane Lewis 1 I. Problem Landslides cause millions of dollars of damage nationally every year, and are
SIE 509 Principles of GIS Exercise 5 An Introduction to Spatial Analysis
 SIE 509 Principles of GIS Exercise 5 An Introduction to Spatial Analysis Due: Oct. 31, 2017 Total Points: 50 Introduction: The Governor of Maine is asking communities to look at regionalization for major
Delineation of high landslide risk areas as a result of land cover, slope, and geology in San Mateo County, California
 Delineation of high landslide risk areas as a result of land cover, slope, and geology in San Mateo County, California Introduction Problem Overview This project attempts to delineate the high-risk areas
ArcGIS Pro: Essential Workflows STUDENT EDITION
 ArcGIS Pro: Essential Workflows STUDENT EDITION Copyright 2018 Esri All rights reserved. Course version 6.0. Version release date August 2018. Printed in the United States of America. The information contained
Using the Stock Hydrology Tools in ArcGIS
 Using the Stock Hydrology Tools in ArcGIS This lab exercise contains a homework assignment, detailed at the bottom, which is due Wednesday, October 6th. Several hydrology tools are part of the basic ArcGIS
GIS Workshop UCLS_Fall Forum 2014 Sowmya Selvarajan, PhD TABLE OF CONTENTS
 TABLE OF CONTENTS TITLE PAGE NO. 1. ArcGIS Basics I 2 a. Open and Save a Map Document 2 b. Work with Map Layers 2 c. Navigate in a Map Document 4 d. Measure Distances 4 2. ArcGIS Basics II 5 a. Work with
Data Structures & Database Queries in GIS
 Data Structures & Database Queries in GIS Objective In this lab we will show you how to use ArcGIS for analysis of digital elevation models (DEM s), in relationship to Rocky Mountain bighorn sheep (Ovis
Handling Raster Data for Hydrologic Applications
 Handling Raster Data for Hydrologic Applications Prepared by Venkatesh Merwade Lyles School of Civil Engineering, Purdue University vmerwade@purdue.edu January 2018 Objective The objective of this exercise
INTRODUCTION TO GIS. Practicals Guide. Chinhoyi University of Technology
 INTRODUCTION TO GIS Practicals Guide Chinhoyi University of Technology Lab 1: Basic Visualisation You have been requested to make a map of Zimbabwe showing the international boundary and provinces. The
GEOG 487 Lesson 7: Step-by-Step Activity
 GEOG 487 Lesson 7: Step-by-Step Activity Part I: Review the Relevant Data Layers and Organize the Map Document In Part I, we will review the data and organize the map document for analysis. 1. Unzip the
Exercise 4 Estimating the effects of sea level rise on coastlines by reclassification
 Exercise 4 Estimating the effects of sea level rise on coastlines by reclassification Due: Thursday February 1; at the start of class Goal: Get familiar with symbolizing and making time-series maps of
Lecture 2. A Review: Geographic Information Systems & ArcGIS Basics
 Lecture 2 A Review: Geographic Information Systems & ArcGIS Basics GIS Overview Types of Maps Symbolization & Classification Map Elements GIS Data Models Coordinate Systems and Projections Scale Geodatabases
This lab exercise will try to answer these questions using spatial statistics in a geographic information system (GIS) context.
 context.") by Introduction Problem Do the patterns of forest fires change over time? Do forest fires occur in clusters, and do the clusters change over time? Is this information useful in fighting forest fires? This
by Introduction Problem Do the patterns of forest fires change over time? Do forest fires occur in clusters, and do the clusters change over time? Is this information useful in fighting forest fires? This
Acknowledgments xiii Preface xv. GIS Tutorial 1 Introducing GIS and health applications 1. What is GIS? 2
 Acknowledgments xiii Preface xv GIS Tutorial 1 Introducing GIS and health applications 1 What is GIS? 2 Spatial data 2 Digital map infrastructure 4 Unique capabilities of GIS 5 Installing ArcView and the
LANDSLIDE RISK ASSESSMENT IN YOSEMITE NATIONAL PARK. Edna Rodriguez December 1 st, 2016 Final Project
 LANDSLIDE RISK ASSESSMENT IN YOSEMITE NATIONAL PARK Edna Rodriguez December 1 st, 2016 Final Project Table of Contents Introduction... 2 Data Collection... 2 Data Preprocessing... 3 ArcGIS Processing...
Gridded Ambient Air Pollutant Concentrations for Southern California, User Notes authored by Beau MacDonald, 11/28/2017
 Gridded Ambient Air Pollutant Concentrations for Southern California, 1995-2014 User Notes authored by Beau, 11/28/2017 METADATA: Each raster file contains data for one pollutant (NO2, O3, PM2.5, and PM10)
(THIS IS AN OPTIONAL BUT WORTHWHILE EXERCISE)
") PART 2: Analysis in ArcGIS (THIS IS AN OPTIONAL BUT WORTHWHILE EXERCISE) Step 1: Start ArcCatalog and open a geodatabase If you have a shortcut icon for ArcCatalog on your desktop, double-click it to start
PART 2: Analysis in ArcGIS (THIS IS AN OPTIONAL BUT WORTHWHILE EXERCISE) Step 1: Start ArcCatalog and open a geodatabase If you have a shortcut icon for ArcCatalog on your desktop, double-click it to start
Task 1: Start ArcMap and add the county boundary data from your downloaded dataset to the data frame.
 Exercise 6 Coordinate Systems and Map Projections The following steps describe the general process that you will follow to complete the exercise. Specific steps will be provided later in the step-by-step
Lauren Jacob May 6, Tectonics of the Northern Menderes Massif: The Simav Detachment and its relationship to three granite plutons
 Lauren Jacob May 6, 2010 Tectonics of the Northern Menderes Massif: The Simav Detachment and its relationship to three granite plutons I. Introduction: Purpose: While reading through the literature regarding
Working with Digital Elevation Models in ArcGIS 8.3
 Working with Digital Elevation Models in ArcGIS 8.3 The homework that you need to turn in is found at the end of this document. This lab continues your introduction to using the Spatial Analyst Extension
CE 365K Exercise 1: GIS Basemap for Design Project Spring 2014 Hydraulic Engineering Design
 CE 365K Exercise 1: GIS Basemap for Design Project Spring 2014 Hydraulic Engineering Design The purpose of this exercise is for you to construct a basemap in ArcGIS for your design project. You may execute
The Looming Threat of Rising Sea Levels to the Florida Keys
 The Looming Threat of Rising Sea Levels to the Florida Keys 1. Introduction Sea levels are rising, and possibly faster than we thought before. In a recent report in 2017 by the National Oceanic and Atmospheric
Land Cover Data Processing Land cover data source Description and documentation Download Use Use
 Land Cover Data Processing This document provides a step by step procedure on how to build the land cover data required by EnSim. The steps provided here my be long and there may be short cuts (like using
Geographical Information Systems
 Geographical Information Systems Geographical Information Systems (GIS) is a relatively new technology that is now prominent in the ecological sciences. This tool allows users to map geographic features
How might you use visibility to map an ancient civilization's political landscape?
 Analyzing Ancient Political Power and Urbanization Patterns by Introduction Problem How might you use visibility to map an ancient civilization's political landscape? The Yoruba civilization, one of the
The Geodatabase Working with Spatial Analyst. Calculating Elevation and Slope Values for Forested Roads, Streams, and Stands.
 GIS LAB 7 The Geodatabase Working with Spatial Analyst. Calculating Elevation and Slope Values for Forested Roads, Streams, and Stands. This lab will ask you to work with the Spatial Analyst extension.
How do I do that in Quantum GIS: illustrating classic GIS tasks Edited by: Arthur J. Lembo, Jr.; Salisbury University
 How do I do that in Quantum GIS: illustrating classic GIS tasks Edited by: Arthur J. Lembo, Jr.; Salisbury University How do I do that in Quantum GIS Page 1 Introduction from the editor:... 4 Database
Tutorial using the 2011 Statistics Canada boundary files and the Householder survey
 Tutorial using the 2011 Statistics Canada boundary files and the Householder survey In this tutorial, we ll try to determine the wards that contain the highest income groups. To do this, we will have to
Erosion Susceptibility in the area Around the Okanogan Fire Complex, Washington, US
 Erosion Susceptibility in the area Around the Okanogan Fire Complex, Washington, US 1. Problem Construct a raster that represents susceptibility to erosion based on lithology, slope, cover type, burned
Creating Watersheds from a DEM
 Creating Watersheds from a DEM These instructions enable you to create watersheds of specified area using a good quality Digital Elevation Model (DEM) in ArcGIS 8.1. The modeling is performed in ArcMap
Different Displays of Thematic Maps:
 Different Displays of Thematic Maps: There are a number of different ways to display or classify thematic maps, including: Natural Breaks Equal Interval Quantile Standard Deviation What s important to
Geography 281 Map Making with GIS Project Four: Comparing Classification Methods
 Geography 281 Map Making with GIS Project Four: Comparing Classification Methods Thematic maps commonly deal with either of two kinds of data: Qualitative Data showing differences in kind or type (e.g.,
A More Comprehensive Vulnerability Assessment: Flood Damage in Virginia Beach
 A More Comprehensive Vulnerability Assessment: Flood Damage in Virginia Beach By Raj Shah GIS in Water Resources Fall 2017 Introduction One of the most obvious effects of flooding events is death. Humans
A Street Named for a King
 A Street Named for a King Dr. Jerry Mitchell University of South Carolina OVERVIEW This lesson adapts the work of Dr. Derek Alderman, a geographer who has used the Martin Luther King, Jr. street-naming
Determining the Location of the Simav Fault
 Lindsey German May 3, 2012 Determining the Location of the Simav Fault 1. Introduction and Problem Formulation: The issue I will be focusing on involves interpreting the location of the Simav fault in
Exercise 6: Working with Raster Data in ArcGIS 9.3
 Exercise 6: Working with Raster Data in ArcGIS 9.3 Why Spatial Analyst? Grid query Grid algebra Grid statistics Summary by zone Proximity mapping Reclassification Histograms Surface analysis Slope, aspect,
Geodatabase Management Pathway
 Geodatabase Management Pathway Table of Contents ArcGIS Desktop II: Tools and Functionality 3 ArcGIS Desktop III: GIS Workflows and Analysis 6 Building Geodatabases 8 Data Management in the Multiuser Geodatabase
Task 1: Open ArcMap and activate the Spatial Analyst extension.
 Exercise 10 Spatial Analyst The following steps describe the general process that you will follow to complete the exercise. Specific steps will be provided later in the step-by-step instructions component
ArcGIS 9 ArcGIS StreetMap Tutorial
 ArcGIS 9 ArcGIS StreetMap Tutorial Copyright 2001 2008 ESRI All Rights Reserved. Printed in the United States of America. The information contained in this document is the exclusive property of ESRI. This
Key Questions: Where are Alaska s volcanoes? How many volcanoes are found in Alaska?
 Key Questions: Where are Alaska s volcanoes? How many volcanoes are found in Alaska? Unit 1 Grade levels: At a basic level, these activities are appropriate for grades 3-6; with suggested extensions for
Version 1.1 GIS Syllabus
 GEOGRAPHIC INFORMATION SYSTEMS CERTIFICATION Version 1.1 GIS Syllabus Endorsed 1 Version 1 January 2007 GIS Certification Programme 1. Target The GIS certification is aimed at: Those who wish to demonstrate
Presenting Tree Inventory. Tomislav Sapic GIS Technologist Faculty of Natural Resources Management Lakehead University
 Presenting Tree Inventory Tomislav Sapic GIS Technologist Faculty of Natural Resources Management Lakehead University Suggested Options 1. Print out a Google Maps satellite image of the inventoried block
OneStop Map Viewer Navigation
 OneStop Map Viewer Navigation» Intended User: Industry Map Viewer users Overview The OneStop Map Viewer is an interactive map tool that helps you find and view information associated with energy development,
GIS in Management Planning. Lab 2 Coordinate Systems and Map Projections
 GIS in Management Planning Lab 2 Coordinate Systems and Map Projections Tomislav Sapic GIS Technologist Faculty of Natural Resources Management Lakehead University ArcGIS ArcToolbox Projections Functions
Using Web GIS to Build Consensus and Combat Wildland Fire Threats
 Using Web GIS to Build Consensus and Combat Wildland Fire Threats By Mike Price, Entrada/San Juan, Inc. What You Will Need ArcGIS 10.3 for Desktop (any license level) An ArcGIS Online account (one comes
Diamonds on the soles of scholarship?
 Educational Performance and Family Income Diamonds on the soles of scholarship? by Introduction Problem Two young girls entering elementary school in Boston aspire to be doctors. Both come from twoparent,
Map image from the Atlas of Oregon (2nd. Ed.), Copyright 2001 University of Oregon Press
, Copyright 2001 University of Oregon Press") Map Layout and Cartographic Design with ArcGIS Desktop Matthew Baker ESRI Educational Services Redlands, CA Education UC 2008 1 Seminar overview General map design principles Working with map elements
Map Layout and Cartographic Design with ArcGIS Desktop Matthew Baker ESRI Educational Services Redlands, CA Education UC 2008 1 Seminar overview General map design principles Working with map elements
Volcanic Hazard Assessment of Southern Iceland Helper, GIS 327G
 Raeann Garcia 05/03/2018 Volcanic Hazard Assessment of Southern Iceland Helper, GIS 327G Introduction: Iceland is an island nation far in the northern hemisphere, with a portion of the country included
caused displacement of ocean water resulting in a massive tsunami. II. Purpose
 I. Introduction The Great Sumatra Earthquake event took place on December 26, 2004, and was one of the most notable and devastating natural disasters of the decade. The event consisted of a major initial
The data for this lab comes from McDonald Forest. We will be working with spatial data representing the forest boundary, streams, roads, and stands.
 GIS LAB 6 Using the Projection Utility. Converting Data to Oregon s Approved Lambert Projection. Determining Stand Size, Stand Types, Road Length, and Stream Length. This lab will ask you to work with
A GEOGRAPHIC ASSESSMENT OF MAJOR DISASTER DECLARATIONS ACROSS THE LOWER 48 STATES
 A GEOGRAPHIC ASSESSMENT OF MAJOR DISASTER DECLARATIONS ACROSS THE LOWER 48 STATES A summary report produced by the Southern Climate Impacts Planning Program (SCIPP) Author: James Hocker Southern Climate
Lab 4 -Vector data and Attributes
 Lab 4 -Vector data and Attributes ERSC/BIOL 4421/5421 Name In this lab you will learn how to create your own vector data by collecting point data from GPS coordinates and by digitizing lines using an Aerial
GEOREFERENCING, PROJECTIONS Part I. PRESENTING DATA Part II
 Week 7 GEOREFERENCING, PROJECTIONS Part I PRESENTING DATA Part II topics of the week Georeferencing Coordinate systems Map Projections ArcMap and Projections Geo-referencing Geo-referencing is the process
Natalie Cabrera GSP 370 Assignment 5.5 March 1, 2018
 Network Analysis: Modeling Overland Paths Using a Least-cost Path Model to Track Migrations of the Wolpertinger of Bavarian Folklore in Redwood National Park, Northern California Natalie Cabrera GSP 370
Global Atmospheric Circulation Patterns Analyzing TRMM data Background Objectives: Overview of Tasks must read Turn in Step 1.
 Global Atmospheric Circulation Patterns Analyzing TRMM data Eugenio Arima arima@hws.edu Hobart and William Smith Colleges Department of Environmental Studies Background: Have you ever wondered why rainforests
Core Curriculum Supplement
 Core Curriculum Supplement Academic Unit / Office EAS Catalog Year of Implementation 2018-2019 Course (Prefix / Number) GEOL / 1370 Core Proposal Request Add to Core Curriculum Course Title Natural Disasters
Midterm Exam : Answer
 Midterm Exam : Answer Create a double-spaced document with answers to the questions below. File Name: LASTNAME_Midterm.pdf Make sure to include your Name, UWNetID, course number, quarter and year, and
Raster Analysis; A Yellowstone Example 3/29/2018
 Fires (1 or 4) Typical Raster Model Types: Raster Analysis: An Example Suitability Modeling: Where is optimum location? Distance Modeling: What is the most efficient path from A to B? + Slope (1-4) Geology
In order to follow this exercise you need to have completed exercise 1.
 In order to follow this exercise you need to have completed exercise 1. Contents of Exercise 2: Derive new datasets from inputs and carry out Multicriteria analysis in order to Part 1: Use Spatial Analysis
Raster Analysis; A Yellowstone Example 10/24/2013. M. Helper GEO327G/386G, UT Austin 2. M. Helper GEO327G/386G, UT Austin 4
 + Fires (1 or 4) Slope (1-4) Geology (1-4) Erosion Ranking (3-12) Raster Analysis: An Example Typical Raster Model Types: Suitability Modeling: Where is optimum location? Distance Modeling: What is the
Effects of Rising Sea Levels on Coral Reef and Mangrove Distributions along the Great Barrier Reef in Australia
 Effects of Rising Sea Levels on Coral Reef and Mangrove Distributions along the Great Barrier Reef in Australia Sarah Barfield Graduate Student Department of Integrative Biology University of Texas, Austin
Map My Property User Guide
 Map My Property User Guide Map My Property Table of Contents About Map My Property... 2 Accessing Map My Property... 2 Links... 3 Navigating the Map... 3 Navigating to a Specific Location... 3 Zooming
Visual Studies Exercise, Assignment 07 (Architectural Paleontology) Geographic Information Systems (GIS), Part II
 Geographic Information Systems (GIS), Part II") ARCH1291 Visual Studies II Week 8, Spring 2013 Assignment 7 GIS I Prof. Alihan Polat Visual Studies Exercise, Assignment 07 (Architectural Paleontology) Geographic Information Systems (GIS), Part II Medium:
ARCH1291 Visual Studies II Week 8, Spring 2013 Assignment 7 GIS I Prof. Alihan Polat Visual Studies Exercise, Assignment 07 (Architectural Paleontology) Geographic Information Systems (GIS), Part II Medium:
SCHOOL OF ENGINEERING AND TECHNOLOGY COMPUTER LAB
 PHASE 1_6 TH SESSION ARCGIS TRAINING AT KU GIS LABS: INTRODUCTION TO GIS: EXPLORING ARCCATALOG AND ARCGIS TOOLS 6 TH SESSION REPORT: 3 RD -5 TH SEPTEMBER 2014 SCHOOL OF ENGINEERING AND TECHNOLOGY COMPUTER
Lab 7: Cell, Neighborhood, and Zonal Statistics
 Lab 7: Cell, Neighborhood, and Zonal Statistics Exercise 1: Use the Cell Statistics function to detect change In this exercise, you will use the Spatial Analyst Cell Statistics function to compare the
Exercise on Using Census Data UCSB, July 2006
 Exercise on Using Census Data UCSB, July 2006 Purpose The purpose of this lab is to become familiar with Census Bureau data. Second, we will learn how to join tables which allows you to add data to the
Raster Analysis: An Example
 Raster Analysis: An Example Fires (1 or 4) Slope (1-4) + Geology (1-4) Erosion Ranking (3-12) 11/8/2016 GEO327G/386G, UT Austin 1 Typical Raster Model Types: Suitability Modeling: Where is optimum location?
MERGING (MERGE / MOSAIC) GEOSPATIAL DATA
 GEOSPATIAL DATA") This help guide describes how to merge two or more feature classes (vector) or rasters into one single feature class or raster dataset. The Merge Tool The Merge Tool combines input features from input
This help guide describes how to merge two or more feature classes (vector) or rasters into one single feature class or raster dataset. The Merge Tool The Merge Tool combines input features from input
v WMS Tutorials GIS Module Importing, displaying, and converting shapefiles Required Components Time minutes
 v. 11.0 WMS 11.0 Tutorial Importing, displaying, and converting shapefiles Objectives This tutorial demonstrates how to import GIS data, visualize it, and convert it into WMS coverage data that could be
Within this document, the term NHDPlus is used when referring to NHDPlus Version 2.1 (unless otherwise noted).
.") Exercise 7 Watershed Delineation Using ArcGIS Spatial Analyst Last Updated 4/6/2017 Within this document, the term NHDPlus is used when referring to NHDPlus Version 2.1 (unless otherwise noted). There
Exercise 7 Watershed Delineation Using ArcGIS Spatial Analyst Last Updated 4/6/2017 Within this document, the term NHDPlus is used when referring to NHDPlus Version 2.1 (unless otherwise noted). There
Working with Census 2000 Data from MassGIS
 Tufts University GIS Tutorial Working with Census 2000 Data from MassGIS Revised September 26, 2007 Overview In this tutorial, you will use pre-processed census data from Massachusetts to create maps of
Using a GIS to Calculate Area of Occupancy. Part 1: Creating a Shapefile Grid
 Using a GIS to Calculate Area of Occupancy Part 1: Creating a Shapefile Grid By Ryan Elliott California Natural Diversity Database, A NatureServe network program December 2008 This document describes the
Displaying and Rotating WindNinja-Derived Wind Vectors in ArcMap 10.5
 Displaying and Rotating WindNinja-Derived Wind Vectors in ArcMap 10.5 Chuck McHugh RMRS, Fire Sciences Lab, Missoula, MT, 406-829-6953, cmchugh@fs.fed.us 08/01/2018 Displaying WindNinja-generated gridded
Classification of Erosion Susceptibility
 GEO327G: GIS & GPS Applications in Earth Sciences Classification of Erosion Susceptibility Denali National Park, Alaska Zehao Xue 12 3 2015 2 TABLE OF CONTENTS 1 Abstract... 3 2 Introduction... 3 2.1 Universal
Spatial Data Analysis with ArcGIS Desktop: From Basic to Advance
 Spatial Data Analysis with ArcGIS Desktop: From Basic to Advance 1. Course overview Modern environmental, energy as well as resource modeling and planning require huge amount of geographically located
Using Microsoft Excel
 Using Microsoft Excel Objective: Students will gain familiarity with using Excel to record data, display data properly, use built-in formulae to do calculations, and plot and fit data with linear functions.
SPATIAL MODELING GIS Analysis Winter 2016
 SPATIAL MODELING GIS Analysis Winter 2016 Spatial Models Spatial Modeling attempts to represent how the world works All models are wrong, but some are useful (G.E. Box, quoted in course textbook pg. 379)
Fundamentals of ArcGIS Desktop Pathway
 Fundamentals of ArcGIS Desktop Pathway Table of Contents ArcGIS Desktop I: Getting Started with GIS 3 ArcGIS Desktop II: Tools and Functionality 5 Understanding Geographic Data 8 Understanding Map Projections
Coastal Flooding in Brevard County, Florida
 Helen Gerlach CE 394K.3 December 4, 2015 Coastal Flooding in Brevard County, Florida Introduction My project was to create a model of the coastal flooding that occurred in Brevard County, Florida in August
HFCC Math Lab Beginning Algebra 2 MULTIPLICATION AND DIVISION OF SIGNED NUMBERS
 HFCC Math Lab Beginning Algebra 2 MULTIPLICATION AND DIVISION OF SIGNED NUMBERS PART I: Multiplication of Signed Numbers Rules for Multiplication of Signed Numbers: (These Rules must be memorized.) Rule
Raster Analysis: An Example
 Raster Analysis: An Example Fires (1 or 4) Slope (1-4) + Geology (1-4) Erosion Ranking (3-12) 1 Typical Raster Model Types: Suitability Modeling: Where is optimum location? Distance Modeling: What is the
GED 554 IT & GIS. Lecture 6 Exercise 5. May 10, 2013
 GED 554 IT & GIS Lecture 6 Exercise 5 May 10, 2013 Free GIS data sources ******************* Mapping numerical data & Symbolization ******************* Exercise: Making maps for presentation GIS DATA SOFTWARE
Date: Summer Stem Section:
 Page 1 of 7 Name: Date: Summer Stem Section: Summer assignment: Build a Molecule Computer Simulation Learning Goals: 1. Students can describe the difference between a molecule name and chemical formula.
Outline Anatomy of ArcGIS Metadata Data Types Vector Raster Conversion Adding Data Navigation Symbolization Methods Layer Files Editing Help Files
 UPlan Training Lab Exercise: Introduction to ArcGIS Outline Anatomy of ArcGIS Metadata Data Types Vector Raster Conversion Adding Data Navigation Symbolization Methods Layer Files Editing Help Files Anatomy
Geographic Systems and Analysis
 Geographic Systems and Analysis New York University Robert F. Wagner Graduate School of Public Service Instructor Stephanie Rosoff Contact: stephanie.rosoff@nyu.edu Office hours: Mondays by appointment
Data Set Projection Checklist
 1 of 6 12/20/2012 12:38 PM Data Set Projection Checklist There are two projections/coordinate systems you must worry about: 1. 2. That of your map. You can pick this to be whatever you want, and your GIS