Hazard Assessment of Lava Flows, Wildfires, and Tsunamis on the Big Island of Hawaii s population. By: Thomas Ditges
|
|
|
- Sandra Riley
- 5 years ago
- Views:
Transcription
1 Hazard Assessment of Lava Flows, Wildfires, and Tsunamis on the Big Island of Hawaii s population By: Thomas Ditges
2 The Problem: The Big Island of Hawaii is the largest and most dangerous of the Hawaiian Islands. The Hawaiian hotspot has triggered 3 active volcanoes: Hualalai, Mauna Loa, and Kilauea. In addition, the Big Island of Hawaii is highly susceptible to tsunamis and wildfires. These can pose a dangerous threat to the surrounding population. The purpose of this project is to assess what regions of the Big Island are the most dangerous and what percentage of the population are affected by these hazards. Question: What regions and populations of the Big Island are the most susceptible to hazards? Data Collection: Downloaded Transportation shapefile from the Big Island from the USGS National Map Viewer. Downloaded **Census Tracks from the 016 Cultural and Demographic tab on the Hawaiian government website from Home<Hawaii Statewide GIS Program<Download GIS Data. Downloaded Lava Flow Hazard Zones from the 009-Human Health and Safety tab on the Hawaiian government website from Home<Hawaii Statewide GIS Program<Download GIS Data. The source of this data is the U.S. Department of the Interior/ Geological Survey and the data is digitized by the Office of Planning for the USGS, Hawaii Volcano Observatory, Downloaded Wildfire Risk Ratings from the 009-Human Health and Safety tab on the Hawaiian government website from Home<Hawaii Statewide GIS Program<Download GIS Data. The source of this data is the Department of Land and Natural Resources, Division of Forestry and Wildlife, Fire Management Program, Data was collected by state wildland fire-fighting agencies in 2006 and Downloaded Tsunami Wave Heights Ratings from the 009-Human Health and Safety tab on the Hawaiian government website from Home<Hawaii Statewide GIS Program<Download GIS Data. The source of the data is Tsunami Wave Runup Heights in Hawaii, Harold G. Loomis, May, The data was digitized by the Office of Planning Staff in October,1999. Downloaded Boundaries, Names, and Transportation datasets from the USGS national map viewer from data download. These datasets are more accurate because they are regularly updated in the years 2017 and Downloaded United States Board on Geographic names
3 Data Preprocessing: 1) Converting GIS Data into ArcGIS-readable format I downloaded shapefiles from the Office of Planning Hawaiian Government website online and from the USGS national map viewer. I had to extract the files in order to import them into ArcMap using ArcCatalog. I saved these extracted files into my flash drive (USB Drive(G:). ArcGIS Processing: Figure 1: Extraction of the Shapefiles 1) Changing all the shapefiles into the same projection I changed all the projections to 1983 UTM Zone 4N by going to Properties<XY Coordinate System. I also used the Project tool to change the Hawaii State shapefile from GCS_North_American_1983 to NAD_1983_UTM_Zone_4N projection. 2) Clip Analysis Tool I clipped the new Hawaiistate shapefile to the fire risk shapefile with a XY Tolerance of 5 meters to get rid of the ocean and just have the island. The input feature was Hawaiistate and the output feature was fire risk. I clipped the tract15 shapfile to the fire risk shapefile with a XY tolerance of 5 meters. The input feature is tract15 and the output feature is fire risk. I created a new layer by right clicking in ArcCatalog, and then I right clicked on the layer and went to Edit Features<Start Editing<Create Features Tool in Editor toolbar<hawaiiclip<polygon. Then, I selected points to create a polygon around the Big Island in order to get tsunami wave heights just for the big island. I edited the vertices, so that the polygon lines did not touch the tsunami points. Then, I clipped the tsunhts shapefile input feature to the HawaiiClip output feature to create a new tsunamiclip shapefile.


 and then inputting appropriate population values at intervals of 2000.")
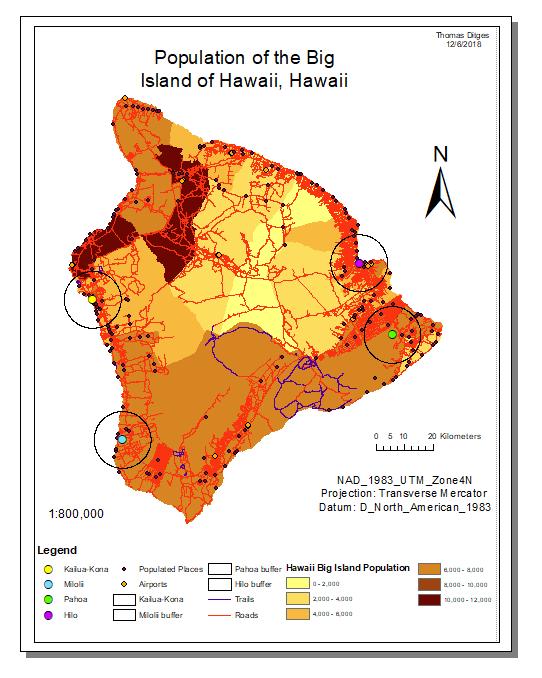
4 Figure 1A: HawaiiClip polygon with the tsunhts shapefile clipped 3) Feature to Raster Tool Converted all the shapefiles into rasters using the Feature to Raster tool in ArcToolbox. For the tracts15 shapefile, the input features is tract15<field is Pop15<Output Features is HawaiiBigpop which is saved to my flash drive under Kilauea Final Project. I set the output cell size to 80. I renamed the new raster Hawaii Island population and classified it by going to Layer Properties<Symbology<Classify<Classes(6) and then inputting appropriate population values at intervals of Figure 1B: Hawaii Big Island Raster Figure 2B: Symbology tab displaying symbols, range Figure 3A: Classified intervals of 2000


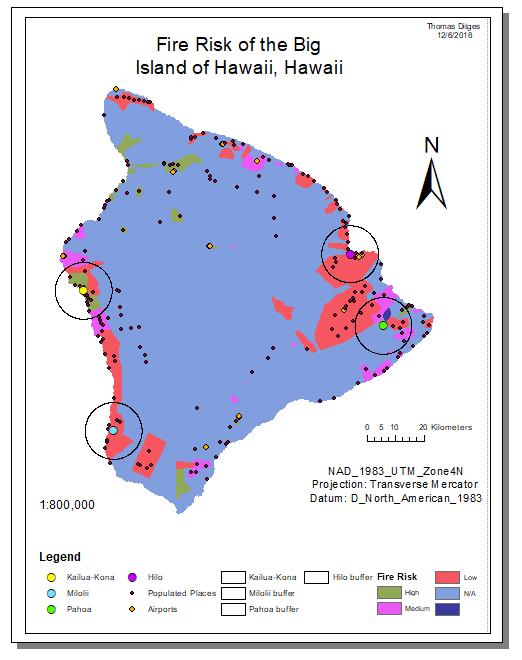
5 Figure 3B: Lava Flow Raster of the vhzones_83 shapefile I converted the shapefile, vhzones_n83, into a raster using the Feature to Raster tool in ArcToolbox. Input Features is vhzones_n83<field is HZONE<Output raster is Lavaflow which is saved to my flash drive under the Kilauea Final Project folder. I converted the shapefile, fire risk, into a raster using the Feature to Raster tool. The input features is firerisk<field is Risk_Ratin<Output raster is FireRisk which is saved to my flash drive under Kilauea Final Project folder. Figure 4: Fire Risk Raster 4) Editor Toolbar In addition to creating the polygon around the outside of the tsunami points in step 2, I created another polygon around the inside of the points to get a get an area where I can

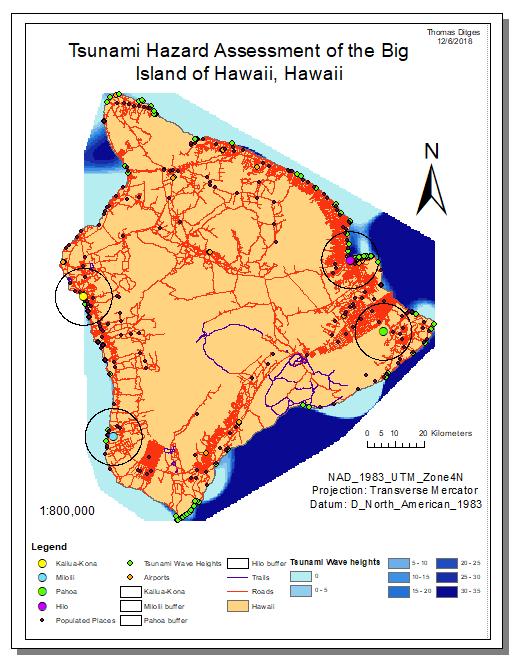
6 get a mask. The steps I did to get this polygon are: HawaiiClip layer<edit Features<Start Editing<Create Features in Editor toolbar<hawaiiclip<polygon. Then, I selected vertices around the inside of the tsunami points by inserting vertices and saving my edits. Figure 4A: Edited polygons of the HawaiiClip shapefile 5) Spline In order to get a raster from the tsunami wave height points, I used the spline tool to interpolate a raster surface from the points using a minimum curvature with the surface passing exactly through the points. The input point feature was tsunamiclip<z Value Field is WAVE1960_F<Output raster=spline3<output cell size=80<spline Type=Regularized<Weight=0.1<Number of points=12. Figure 4B: New splined raster surface 6) Extract by Mask I wanted to create an area within my new splined raster that would give me ranges for my tsunami wave heights. So, I used the Extract by Mask Tool with an input raster of spline3

7 and the feature mask data as HawaiiClip with an output raster name of extractmask. This new mask will give me classified ranges for my tsunami wave heights. I classified the ranges by going to Properties<Symbology<Classes=8<Classify<Broken values of 5 from 0-35 feet. Figure 5: Mask with the Hawaii State shapefile and the tsunami wave height points. 7) Editor Toolbar I wanted to show two population centers which are the most at risk for hazards on the Big Island of Hawaii, so I created two point shapefiles for the city of Hilo and the censusdesignated place of Pahoa. I did this by right clicking on my Kilauea Final Project folder<new<shapefile<hilo and Pahoa as the name<feature Type is Point. Then, I go to the Editor toolbar and start editing the two new shapefiles. I created the feature by clicking on the Create Features tab and clicking on the shapefile and the construction tool point. I located the position of Hilo and Pahoa and clicked on those points on the map and saved my edits. 8) Buffer Tool In order to display the amount of area affected in urban areas where populations were the greatest and the risk was the highest, I used the buffer tool. I used input feature as


8 Hilo<Output as hilobuffer<linearunit=10000 kilometers<method=planar. I used Planar method because it automatically determines which buffer or method to use based on the coordinate system. I did the same thing for Pahoa, Milolii, and Kilauea-Kona with the Linear Unit being kilometers. Figure 5A: Buffer tool for Hilo shapefile Figure 5B: Buffers of Hilo and Pahoa Figure 6: Buffer of Milolii 9) Selection by Location Tool In order to figure out which populations are inside each buffer, I used the Selection by Location tool.


9 Figure 6A: Selection by Location tool of Figure 6B: Attribute table with Selection Statistics population intersecting the Hilo buffer. giving the sum of the Field, Pop15. Area of Interest Populations Census Tracts Affected by the Hazards intersecting the buffer Milolii 14, , 213, and 9900 Hilo 57, , , , 209,205,210.3, 208.1, 201,207.01, 204,203,202.02,9907,9908, and Pahoa 40, , ,211.06, , , Kailua-Kona 41, ,216.01,216.04,215.09,215.04,215.02,9915,9914, and 9916 Table 1: Populations and census tracts intersecting the area of interest s buffers. This approach is not an accurate way to display populations within the buffers because the census tract polygons are outside of the buffers. My data for the populations within the census tracts just calculates populations within the tracts intersecting the buffers. In order to get more accurate data, I got data from the United States Board on Geographic Names to show populated areas on the Big Island. Conclusion: ArcMap is a very effective software for assessing hazards in a given area, especially for the Big Island of Hawaii. The main hazards that I have assessed in this study are wildfires, lava flows, and tsunamis. These studies are very important for Hawaii especially since there are 3 active volcanoes. I marked the census-designated places of Hilo, Milolii, and Pahoa as places

10 of the higher risk with Milolii being the place of the highest risk from lava flows. The northeast part of the Big Island, however, is the place of the lowest risk for hazards like wildfires, tsunamis, and lava flows. The city of Kailua-Kona is the highest risk towards wildfires which I included. The roads near Mauna Loa and Kilauea on the south side of the island are susceptible to large lava flows, so it would be advisable to take an alternative route to evacuate to a safe location. The populated areas within the buffers are also at risk to hazards. Frequent eruptions occur on the Big Island every tens of years and with this data the people can better prepare and know where places of lower risk are on the island. Maps:
11
12
13
Calhoun County, Texas Under 5 Meter Sea Level Rise
 Kyle Kacal GEO 327G Calhoun County, Texas Under 5 Meter Sea Level Rise PROBLEM AND PURPOSE: Sea level rise is threat to all coastal areas. Although natural sea level rise happens at a very slow rate, hurricanes
In this exercise we will learn how to use the analysis tools in ArcGIS with vector and raster data to further examine potential building sites.
 GIS Level 2 In the Introduction to GIS workshop we filtered data and visually examined it to determine where to potentially build a new mixed use facility. In order to get a low interest loan, the building
Delineation of high landslide risk areas as a result of land cover, slope, and geology in San Mateo County, California
 Delineation of high landslide risk areas as a result of land cover, slope, and geology in San Mateo County, California Introduction Problem Overview This project attempts to delineate the high-risk areas
How to Create Stream Networks using DEM and TauDEM
 How to Create Stream Networks using DEM and TauDEM Take note: These procedures do not describe all steps. Knowledge of ArcGIS, DEMs, and TauDEM is required. TauDEM software ( http://hydrology.neng.usu.edu/taudem/
Delineation of Watersheds
 Delineation of Watersheds Adirondack Park, New York by Introduction Problem Watershed boundaries are increasingly being used in land and water management, separating the direction of water flow such that
Geo 327G Semester Project. Landslide Suitability Assessment of Olympic National Park, WA. Fall Shane Lewis
 Geo 327G Semester Project Landslide Suitability Assessment of Olympic National Park, WA Fall 2011 Shane Lewis 1 I. Problem Landslides cause millions of dollars of damage nationally every year, and are
GIS Final Project Determining Regions of Anthropogenic Recharge
 Michael Passarello 04/06/10 GIS Final Project Determining Regions of Anthropogenic Recharge Objective A grid for the recharge zone of the Barton Springs segment of the Edwards Aquifer within the city limits
Volcanic Hazards of Mt Shasta
 Volcanic Hazards of Mt Shasta Introduction Mt Shasta is a volcano in the northern part of California. Although it has been recently inactive for over 10,000 years. However, its eruption would cause damage
Exercise 2: Working with Vector Data in ArcGIS 9.3
 Exercise 2: Working with Vector Data in ArcGIS 9.3 There are several tools in ArcGIS 9.3 used for GIS operations on vector data. In this exercise we will use: Analysis Tools in ArcToolbox Overlay Analysis
Exercise 2: Working with Vector Data in ArcGIS 9.3
 Exercise 2: Working with Vector Data in ArcGIS 9.3 There are several tools in ArcGIS 9.3 used for GIS operations on vector data. In this exercise we will use: Analysis Tools in ArcToolbox Overlay Analysis
(THIS IS AN OPTIONAL BUT WORTHWHILE EXERCISE)
") PART 2: Analysis in ArcGIS (THIS IS AN OPTIONAL BUT WORTHWHILE EXERCISE) Step 1: Start ArcCatalog and open a geodatabase If you have a shortcut icon for ArcCatalog on your desktop, double-click it to start
PART 2: Analysis in ArcGIS (THIS IS AN OPTIONAL BUT WORTHWHILE EXERCISE) Step 1: Start ArcCatalog and open a geodatabase If you have a shortcut icon for ArcCatalog on your desktop, double-click it to start
Laboratory Exercise X Most Dangerous Places to Live in the United States Based on Natural Disasters
 Brigham Young University BYU ScholarsArchive Engineering Applications of GIS - Laboratory Exercises Civil and Environmental Engineering 2016 Laboratory Exercise X Most Dangerous Places to Live in the United
Outline. Chapter 1. A history of products. What is ArcGIS? What is GIS? Some GIS applications Introducing the ArcGIS products How does GIS work?
 Outline Chapter 1 Introducing ArcGIS What is GIS? Some GIS applications Introducing the ArcGIS products How does GIS work? Basic data formats The ArcCatalog interface 1-1 1-2 A history of products Arc/Info
GIS Level 2. MIT GIS Services
 GIS Level 2 MIT GIS Services http://libraries.mit.edu/gis Email: gishelp@mit.edu TOOLS IN THIS WORKSHOP - Definition Queries - Create a new field in the attribute table - Field Calculator - Add XY Data
Determining the Location of the Simav Fault
 Lindsey German May 3, 2012 Determining the Location of the Simav Fault 1. Introduction and Problem Formulation: The issue I will be focusing on involves interpreting the location of the Simav fault in
Lauren Jacob May 6, Tectonics of the Northern Menderes Massif: The Simav Detachment and its relationship to three granite plutons
 Lauren Jacob May 6, 2010 Tectonics of the Northern Menderes Massif: The Simav Detachment and its relationship to three granite plutons I. Introduction: Purpose: While reading through the literature regarding
caused displacement of ocean water resulting in a massive tsunami. II. Purpose
 I. Introduction The Great Sumatra Earthquake event took place on December 26, 2004, and was one of the most notable and devastating natural disasters of the decade. The event consisted of a major initial
Effects of Rising Sea Levels on Coral Reef and Mangrove Distributions along the Great Barrier Reef in Australia
 Effects of Rising Sea Levels on Coral Reef and Mangrove Distributions along the Great Barrier Reef in Australia Sarah Barfield Graduate Student Department of Integrative Biology University of Texas, Austin
Watershed Analysis of the Blue Ridge Mountains in Northwestern Virginia
 Watershed Analysis of the Blue Ridge Mountains in Northwestern Virginia Mason Fredericks December 6, 2018 Purpose The Blue Ridge Mountain range is one of the most popular mountain ranges in the United
Creating Watersheds from a DEM
 Creating Watersheds from a DEM These instructions enable you to create watersheds of specified area using a good quality Digital Elevation Model (DEM) in ArcGIS 8.1. The modeling is performed in ArcMap
Volcanic Hazard Assessment of Southern Iceland Helper, GIS 327G
 Raeann Garcia 05/03/2018 Volcanic Hazard Assessment of Southern Iceland Helper, GIS 327G Introduction: Iceland is an island nation far in the northern hemisphere, with a portion of the country included
Acknowledgments xiii Preface xv. GIS Tutorial 1 Introducing GIS and health applications 1. What is GIS? 2
 Acknowledgments xiii Preface xv GIS Tutorial 1 Introducing GIS and health applications 1 What is GIS? 2 Spatial data 2 Digital map infrastructure 4 Unique capabilities of GIS 5 Installing ArcView and the
Exercise 3: GIS data on the World Wide Web
 Exercise 3: GIS data on the World Wide Web These web sites are a few examples of sites that are serving free GIS data. Many other sites exist. Search in Google or other search engine to find GIS data for
Within this document, the term NHDPlus is used when referring to NHDPlus Version 2.1 (unless otherwise noted).
.") Exercise 7 Watershed Delineation Using ArcGIS Spatial Analyst Last Updated 4/6/2017 Within this document, the term NHDPlus is used when referring to NHDPlus Version 2.1 (unless otherwise noted). There
Exercise 7 Watershed Delineation Using ArcGIS Spatial Analyst Last Updated 4/6/2017 Within this document, the term NHDPlus is used when referring to NHDPlus Version 2.1 (unless otherwise noted). There
GIS in Management Planning. Lab 2 Coordinate Systems and Map Projections
 GIS in Management Planning Lab 2 Coordinate Systems and Map Projections Tomislav Sapic GIS Technologist Faculty of Natural Resources Management Lakehead University ArcGIS ArcToolbox Projections Functions
INTRODUCTION TO GIS. Practicals Guide. Chinhoyi University of Technology
 INTRODUCTION TO GIS Practicals Guide Chinhoyi University of Technology Lab 1: Basic Visualisation You have been requested to make a map of Zimbabwe showing the international boundary and provinces. The
Task 1: Start ArcMap and add the county boundary data from your downloaded dataset to the data frame.
 Exercise 6 Coordinate Systems and Map Projections The following steps describe the general process that you will follow to complete the exercise. Specific steps will be provided later in the step-by-step
The Geodatabase Working with Spatial Analyst. Calculating Elevation and Slope Values for Forested Roads, Streams, and Stands.
 GIS LAB 7 The Geodatabase Working with Spatial Analyst. Calculating Elevation and Slope Values for Forested Roads, Streams, and Stands. This lab will ask you to work with the Spatial Analyst extension.
SIE 509 Principles of GIS Exercise 5 An Introduction to Spatial Analysis
 SIE 509 Principles of GIS Exercise 5 An Introduction to Spatial Analysis Due: Oct. 31, 2017 Total Points: 50 Introduction: The Governor of Maine is asking communities to look at regionalization for major
Using the Stock Hydrology Tools in ArcGIS
 Using the Stock Hydrology Tools in ArcGIS This lab exercise contains a homework assignment, detailed at the bottom, which is due Wednesday, October 6th. Several hydrology tools are part of the basic ArcGIS
Effects of sea level rise on shallow atolls in the South Pacific
 Tuvalu 2100 Effects of sea level rise on shallow atolls in the South Pacific Kristin Vollmann GEO 327GG December 3, 20100 INTRODUCTION Residents of the tiny island nation of Tuvalu, withh a maximumm elevation
WORKING WITH DMTI DIGITAL ELEVATION MODELS (DEM)
") WORKING WITH DMTI DIGITAL ELEVATION MODELS (DEM) Contents (Ctrl-Click to jump to a specific page) Manipulating the DEM Step 1: Finding the DEM Tiles You Need... 2 Step 2: Importing the DEM Tiles into ArcMap...
WORKING WITH DMTI DIGITAL ELEVATION MODELS (DEM) Contents (Ctrl-Click to jump to a specific page) Manipulating the DEM Step 1: Finding the DEM Tiles You Need... 2 Step 2: Importing the DEM Tiles into ArcMap...
Exercise 6: Working with Raster Data in ArcGIS 9.3
 Exercise 6: Working with Raster Data in ArcGIS 9.3 Why Spatial Analyst? Grid query Grid algebra Grid statistics Summary by zone Proximity mapping Reclassification Histograms Surface analysis Slope, aspect,
Watershed Delineation
 Watershed Delineation Jessica L. Watkins, University of Georgia 2 April 2009 Updated by KC Love February 25, 2011 PURPOSE For this project, I delineated watersheds for the Coweeta synoptic sampling area
Outline Anatomy of ArcGIS Metadata Data Types Vector Raster Conversion Adding Data Navigation Symbolization Methods Layer Files Editing Help Files
 UPlan Training Lab Exercise: Introduction to ArcGIS Outline Anatomy of ArcGIS Metadata Data Types Vector Raster Conversion Adding Data Navigation Symbolization Methods Layer Files Editing Help Files Anatomy
Fire Susceptibility Analysis Carson National Forest New Mexico. Can a geographic information system (GIS) be used to analyze the susceptibility of
 be used to analyze the susceptibility of") 1 David Werth Fire Susceptibility Analysis Carson National Forest New Mexico Can a geographic information system (GIS) be used to analyze the susceptibility of Carson National Forest, New Mexico to forest
1 David Werth Fire Susceptibility Analysis Carson National Forest New Mexico Can a geographic information system (GIS) be used to analyze the susceptibility of Carson National Forest, New Mexico to forest
Compilation of GIS data for the Lower Brazos River basin
 Compilation of GIS data for the Lower Brazos River basin Francisco Olivera, Ph.D., P.E. Srikanth Koka Lauren Walker Aishwarya Vijaykumar Department of Civil Engineering December 5, 2011 Contents Brief
Data Creation and Editing
 11.520:A Workshop on Geographical Information Systems 1.188: Urban Planning and Social Science Laboratory Data Creation and Editing Based in part on notes by Prof. Joseph Ferreira and Michael Flaxman Lulu
ISU GIS CENTER S ARCSDE USER'S GUIDE AND DATA CATALOG
 ISU GIS CENTER S ARCSDE USER'S GUIDE AND DATA CATALOG 2 TABLE OF CONTENTS 1) INTRODUCTION TO ARCSDE............. 3 2) CONNECTING TO ARCSDE.............. 5 3) ARCSDE LAYERS...................... 9 4) LAYER
GIS Semester Project Working With Water Well Data in Irion County, Texas
 GIS Semester Project Working With Water Well Data in Irion County, Texas Grant Hawkins Question for the Project Upon picking a random point in Irion county, Texas, to what depth would I have to drill a
Water Volume Calculation of Hill Country Trinity Aquifer Blanco, Hays, and Travis Counties, Central Texas
 Water Volume Calculation of Hill Country Trinity Aquifer Blanco, Hays, and Travis Counties, Central Texas GIS and GPS Applications in Earth Science Saya Ahmed December, 2010 1 Introduction: Trinity Aquifer
Sea Level Scare in South Carolina. by William Witmer GEO 327G 5 December 2016
 Sea Level Scare in South Carolina by William Witmer GEO 327G 5 December 2016 Problem Hilton Head Island in South Carolina attracts 2.5 million tourists every year. This popular locale features endangered
Esri EADA10. ArcGIS Desktop Associate. Download Full Version :
 Esri EADA10 ArcGIS Desktop Associate Download Full Version : http://killexams.com/pass4sure/exam-detail/eada10 Question: 85 Which format is appropriate for exporting map documents that require vector layers
Tutorial 8 Raster Data Analysis
 Objectives Tutorial 8 Raster Data Analysis This tutorial is designed to introduce you to a basic set of raster-based analyses including: 1. Displaying Digital Elevation Model (DEM) 2. Slope calculations
Data Structures & Database Queries in GIS
 Data Structures & Database Queries in GIS Objective In this lab we will show you how to use ArcGIS for analysis of digital elevation models (DEM s), in relationship to Rocky Mountain bighorn sheep (Ovis
LANDSLIDE HAZARD ANALYSIS AND ITS EFFECT ON ENDANGERED SPECIES HABITATS, GRAND COUNTY, UTAH
 12/5/2016 LANDSLIDE HAZARD ANALYSIS AND ITS EFFECT ON ENDANGERED SPECIES HABITATS, GRAND COUNTY, UTAH GIS Final Project Ashlyn Murphy Fall 2016 1. Introduction and Problem A well-known geologic hazard
The Looming Threat of Rising Sea Levels to the Florida Keys
 The Looming Threat of Rising Sea Levels to the Florida Keys 1. Introduction Sea levels are rising, and possibly faster than we thought before. In a recent report in 2017 by the National Oceanic and Atmospheric
Presenting Tree Inventory. Tomislav Sapic GIS Technologist Faculty of Natural Resources Management Lakehead University
 Presenting Tree Inventory Tomislav Sapic GIS Technologist Faculty of Natural Resources Management Lakehead University Suggested Options 1. Print out a Google Maps satellite image of the inventoried block
Visual Studies Exercise, Assignment 07 (Architectural Paleontology) Geographic Information Systems (GIS), Part II
 Geographic Information Systems (GIS), Part II") ARCH1291 Visual Studies II Week 8, Spring 2013 Assignment 7 GIS I Prof. Alihan Polat Visual Studies Exercise, Assignment 07 (Architectural Paleontology) Geographic Information Systems (GIS), Part II Medium:
ARCH1291 Visual Studies II Week 8, Spring 2013 Assignment 7 GIS I Prof. Alihan Polat Visual Studies Exercise, Assignment 07 (Architectural Paleontology) Geographic Information Systems (GIS), Part II Medium:
Midterm Exam : Answer
 Midterm Exam : Answer Create a double-spaced document with answers to the questions below. File Name: LASTNAME_Midterm.pdf Make sure to include your Name, UWNetID, course number, quarter and year, and
Chapter 6. Fundamentals of GIS-Based Data Analysis for Decision Support. Table 6.1. Spatial Data Transformations by Geospatial Data Types
 Chapter 6 Fundamentals of GIS-Based Data Analysis for Decision Support FROM: Points Lines Polygons Fields Table 6.1. Spatial Data Transformations by Geospatial Data Types TO: Points Lines Polygons Fields
GIS CONCEPTS ARCGIS METHODS AND. 2 nd Edition, July David M. Theobald, Ph.D. Natural Resource Ecology Laboratory Colorado State University
 GIS CONCEPTS AND ARCGIS METHODS 2 nd Edition, July 2005 David M. Theobald, Ph.D. Natural Resource Ecology Laboratory Colorado State University Copyright Copyright 2005 by David M. Theobald. All rights
Erosion Susceptibility in the area Around the Okanogan Fire Complex, Washington, US
 Erosion Susceptibility in the area Around the Okanogan Fire Complex, Washington, US 1. Problem Construct a raster that represents susceptibility to erosion based on lithology, slope, cover type, burned
Raster Analysis: An Example
 Raster Analysis: An Example Fires (1 or 4) Slope (1-4) + Geology (1-4) Erosion Ranking (3-12) 1 Typical Raster Model Types: Suitability Modeling: Where is optimum location? Distance Modeling: What is the
Handling Raster Data for Hydrologic Applications
 Handling Raster Data for Hydrologic Applications Prepared by Venkatesh Merwade Lyles School of Civil Engineering, Purdue University vmerwade@purdue.edu January 2018 Objective The objective of this exercise
Goodbye Galveston. The Effects of Rising Sea Level on the. Coast of Galveston, TX. Maria Reistroffer GEO 327G
 Goodbye The Effects of Rising Sea Level on the Coast of, TX Maria Reistroffer GEO 327G 12/3/2015 Problem: Greenhouse gases contribute to global sea level rise and threaten human life, property, wildlife
Analysis of Change in Land Use around Future Core Transit Corridors: Austin, TX, Eric Porter May 3, 2012
 Analysis of Change in Land Use around Future Core Transit Corridors: Austin, TX, 1990-2006 PROBLEM DEFINITION Eric Porter May 3, 2012 This study examines the change in land use from 1990 to 2006 in the
Land Cover Data Processing Land cover data source Description and documentation Download Use Use
 Land Cover Data Processing This document provides a step by step procedure on how to build the land cover data required by EnSim. The steps provided here my be long and there may be short cuts (like using
Learning ArcGIS: Introduction to ArcCatalog 10.1
 Learning ArcGIS: Introduction to ArcCatalog 10.1 Estimated Time: 1 Hour Information systems help us to manage what we know by making it easier to organize, access, manipulate, and apply knowledge to the
Raster Analysis; A Yellowstone Example 3/29/2018
 Fires (1 or 4) Typical Raster Model Types: Raster Analysis: An Example Suitability Modeling: Where is optimum location? Distance Modeling: What is the most efficient path from A to B? + Slope (1-4) Geology
Raster Analysis; A Yellowstone Example 10/24/2013. M. Helper GEO327G/386G, UT Austin 2. M. Helper GEO327G/386G, UT Austin 4
 + Fires (1 or 4) Slope (1-4) Geology (1-4) Erosion Ranking (3-12) Raster Analysis: An Example Typical Raster Model Types: Suitability Modeling: Where is optimum location? Distance Modeling: What is the
Office of Geographic Information Systems
 Office of Geographic Information Systems Print this Page Winter 2009 - Desktop GIS: The National Grid Wants You! By Todd Lusk In case of a disaster would you want emergency responders to be able to easily
Using Ice Thickness and Bed Topography to Pick Field Sites Near Swiss Camp, Greenland
 Lauren Andrews 6 May 2010 GEO 386G: GIS final project Using Ice Thickness and Bed Topography to Pick Field Sites Near Swiss Camp, Greenland Problem Formulation My primary goal for this project is to map
Using a GIS to Calculate Area of Occupancy. Part 1: Creating a Shapefile Grid
 Using a GIS to Calculate Area of Occupancy Part 1: Creating a Shapefile Grid By Ryan Elliott California Natural Diversity Database, A NatureServe network program December 2008 This document describes the
Part 1: GIS Data from the Web: Downloading and Projecting Digital Elevation Models (DEM) and BTS Road data
 and BTS Road data") Field Geology I Hometown GIS, Part 1 October 03, 2005 Lab Exercise 2.1 Part 1: GIS Data from the Web: Downloading and Projecting Digital Elevation Models (DEM) and BTS Road data 1. Introduction a. GIS
Field Geology I Hometown GIS, Part 1 October 03, 2005 Lab Exercise 2.1 Part 1: GIS Data from the Web: Downloading and Projecting Digital Elevation Models (DEM) and BTS Road data 1. Introduction a. GIS
Lecture 2. A Review: Geographic Information Systems & ArcGIS Basics
 Lecture 2 A Review: Geographic Information Systems & ArcGIS Basics GIS Overview Types of Maps Symbolization & Classification Map Elements GIS Data Models Coordinate Systems and Projections Scale Geodatabases
GIS CONCEPTS ARCGIS METHODS AND. 3 rd Edition, July David M. Theobald, Ph.D. Warner College of Natural Resources Colorado State University
 GIS CONCEPTS AND ARCGIS METHODS 3 rd Edition, July 2007 David M. Theobald, Ph.D. Warner College of Natural Resources Colorado State University Copyright Copyright 2007 by David M. Theobald. All rights
i-tree Eco Random Plots Workbook: Pre - Stratification Tips red green
 i-tree Eco Random Plots Workbook: Pre - Stratification These instructions help users of all skill levels create random, pre-stratified UFORE sample points and their associated UFORE-required data within
Spatial Analysis using Vector GIS THE GOAL: PREPARATION:
 PLAN 512 GIS FOR PLANNERS Department of Urban and Environmental Planning University of Virginia Fall 2006 Prof. David L. Phillips Spatial Analysis using Vector GIS THE GOAL: This tutorial explores some
Getting Started. Start ArcMap by opening up a new map.
 Start ArcMap by opening up a new map. Getting Started We now need to set up ArcMap to do some analysis using the Spatial Analyst extension. You will need to activate the Spatial Analyst extension by selecting
2G1/3G4 GIS TUTORIAL >>>>>>>>>>>>>>>>>>>>>>>>>>>>>>>>>>>>>>>>>>>>>>>>>>>>>>>>>>>>>>>>>>>>>>>>>>>>>>>>
 > University of Michigan >Taubman College of Architecture > ARCH 552, Perimeter @ Work Out [T]here, Fall 2009 >September 24, 2009 2G1/3G4 GIS TUTORIAL >>>>>>>>>>>>>>>>>>>>>>>>>>>>>>>>>>>>>>>>>>>>>>>>>>>>>>>>>>>>>>>>>>>>>>>>>>>>>>>>
Exercise 5e: Estimating the impact of sea level rise in coastal areas of the United States and comparing to the impact in coastal Asia
 Exercise 5e: Estimating the impact of sea level rise in coastal areas of the United States and comparing to the impact in coastal Asia Data sets (downloaded in previous homework from the National Geophysical
Display data in a map-like format so that geographic patterns and interrelationships are visible
 Vilmaliz Rodríguez Guzmán M.S. Student, Department of Geology University of Puerto Rico at Mayagüez Remote Sensing and Geographic Information Systems (GIS) Reference: James B. Campbell. Introduction to
Task 1: Open ArcMap and activate the Spatial Analyst extension.
 Exercise 10 Spatial Analyst The following steps describe the general process that you will follow to complete the exercise. Specific steps will be provided later in the step-by-step instructions component
Raster Analysis: An Example
 Raster Analysis: An Example Fires (1 or 4) Slope (1-4) + Geology (1-4) Erosion Ranking (3-12) 11/8/2016 GEO327G/386G, UT Austin 1 Typical Raster Model Types: Suitability Modeling: Where is optimum location?
Week 01 Lecture Notes Antelope Valley College Geography 205
 I. Introduction to GIS a. Tonight we ll discuss i. What GIS is and isn t ii. Software iii. Data iv. Documents v. File Structure II. GIS a. What it is i. Geographic Information Systems ii. A way of storing,
This lab exercise will try to answer these questions using spatial statistics in a geographic information system (GIS) context.
 context.") by Introduction Problem Do the patterns of forest fires change over time? Do forest fires occur in clusters, and do the clusters change over time? Is this information useful in fighting forest fires? This
by Introduction Problem Do the patterns of forest fires change over time? Do forest fires occur in clusters, and do the clusters change over time? Is this information useful in fighting forest fires? This
Outline. ArcGIS? ArcMap? I Understanding ArcMap. ArcMap GIS & GWR GEOGRAPHICALLY WEIGHTED REGRESSION. (Brief) Overview of ArcMap
 Overview of ArcMap") GEOGRAPHICALLY WEIGHTED REGRESSION Outline GWR 3.0 Software for GWR (Brief) Overview of ArcMap Displaying GWR results in ArcMap stewart.fotheringham@nuim.ie http://ncg.nuim.ie ncg.nuim.ie/gwr/ ArcGIS?
GEOGRAPHICALLY WEIGHTED REGRESSION Outline GWR 3.0 Software for GWR (Brief) Overview of ArcMap Displaying GWR results in ArcMap stewart.fotheringham@nuim.ie http://ncg.nuim.ie ncg.nuim.ie/gwr/ ArcGIS?
Lab#3: GIS Projections and Coordinate Systems. Start Arcmap and create a data frame for each of the above coordinate systems.
 NRM338 Fall 2017 Lab#3 Page#1 of 18 In this lab, you will Lab#3: GIS Projections and Coordinate Systems 1) Define the geographic coordinate system of two GIS themes. 2) Determine the geographic coordinates
Exercise 6: Using Burn Severity Data to Model Erosion Risk
 Exercise 6: Using Burn Severity Data to Model Erosion Risk Document Updated: November 2009 Software Versions: ERDAS Imagine 9.3 and ArcGIS 9.3, Microsoft Office 2007 Introduction A common use of burn severity
Spatial Analysis in Your Browser
 Spatial Analysis in Your Browser Joseph Kerski Education Manager Esri jkerski@esri.com http://www.youtube.com/geographyuberalles Twitter http://twitter.com/josephkerski 303-449-7779 x 18237 Joseph Kerski
Classification of Erosion Susceptibility
 GEO327G: GIS & GPS Applications in Earth Sciences Classification of Erosion Susceptibility Denali National Park, Alaska Zehao Xue 12 3 2015 2 TABLE OF CONTENTS 1 Abstract... 3 2 Introduction... 3 2.1 Universal
GEOGRAPHIC INFORMATION SYSTEMS
 GEOGRAPHIC INFORMATION SYSTEMS 4-H Round-Up Community Transitions Workshop Daniel Hanselka June 14, 2011 Goals of the Workshop Answer the question: What is GIS? Uses of GIS. Some of the Common Terminology
BSEN 6220 GIS LAB #5
 BSEN 6220 GIS LAB #5 Dustin Till 10/29/2014 INTRODUCTION: ArcGIS is a geographic information system for working with maps and geographic information. It is used for creating and using maps, compiling geographic
Alaska, USA. Sam Robbins
 Using ArcGIS to determine erosion susceptibility within Denali National Park, Alaska, USA Sam Robbins Introduction Denali National Park is six million acres of wild land with only one road and one road
GIS Workshop UCLS_Fall Forum 2014 Sowmya Selvarajan, PhD TABLE OF CONTENTS
 TABLE OF CONTENTS TITLE PAGE NO. 1. ArcGIS Basics I 2 a. Open and Save a Map Document 2 b. Work with Map Layers 2 c. Navigate in a Map Document 4 d. Measure Distances 4 2. ArcGIS Basics II 5 a. Work with
Working with ArcGIS: Classification
 Working with ArcGIS: Classification 2 Abbreviations D-click R-click TOC Double Click Right Click Table of Content Introduction The benefit from the use of geographic information system (GIS) software is
Course overview. Grading and Evaluation. Final project. Where and When? Welcome to REM402 Applied Spatial Analysis in Natural Resources.
 Welcome to REM402 Applied Spatial Analysis in Natural Resources Eva Strand, University of Idaho Map of the Pacific Northwest from http://www.or.blm.gov/gis/ Where and When? Lectures Monday & Wednesday
GEOREFERENCING, PROJECTIONS Part I. PRESENTING DATA Part II
 Week 7 GEOREFERENCING, PROJECTIONS Part I PRESENTING DATA Part II topics of the week Georeferencing Coordinate systems Map Projections ArcMap and Projections Geo-referencing Geo-referencing is the process
Displaying Latitude & Longitude Data (XY Data) in ArcGIS
 in ArcGIS") Displaying Latitude & Longitude Data (XY Data) in ArcGIS Created by Barbara Parmenter and updated on 2/15/2018 If you have a table of data that has longitude and latitude, or XY coordinates, you can view
Displaying Latitude & Longitude Data (XY Data) in ArcGIS Created by Barbara Parmenter and updated on 2/15/2018 If you have a table of data that has longitude and latitude, or XY coordinates, you can view
Working with Digital Elevation Models in ArcGIS 8.3
 Working with Digital Elevation Models in ArcGIS 8.3 The homework that you need to turn in is found at the end of this document. This lab continues your introduction to using the Spatial Analyst Extension
Lecture 5. GIS Data Capture & Editing. Tomislav Sapic GIS Technologist Faculty of Natural Resources Management Lakehead University
 Lecture 5 GIS Data Capture & Editing Tomislav Sapic GIS Technologist Faculty of Natural Resources Management Lakehead University GIS Data Input Surveying/GPS Data capture Facilitate data capture Final
Spatial Data Analysis in Archaeology Anthropology 589b. Kriging Artifact Density Surfaces in ArcGIS
 Spatial Data Analysis in Archaeology Anthropology 589b Fraser D. Neiman University of Virginia 2.19.07 Spring 2007 Kriging Artifact Density Surfaces in ArcGIS 1. The ingredients. -A data file -- in.dbf
Outcrop suitability analysis of blueschists within the Dry Lakes region of the Condrey Mountain Window, North-central Klamaths, Northern California
 Outcrop suitability analysis of blueschists within the Dry Lakes region of the Condrey Mountain Window, North-central Klamaths, Northern California (1) Introduction: This project proposes to assess the
Identifying Wildfire Risk Areas in Western Washington State
 Identifying Wildfire Risk Areas in Western Washington State Matthew Seto University of Washington Tacoma GIS Certification Program URISA 2015 Undergraduate Geospatial Skills Competition Introduction 2014
GEO 327G Semester Project. Urbanization in the Onion Creek Watershed
 GEO 327G Semester Project Urbanization in the Onion Creek Watershed Hanes, Ian M 12-4-2014 Hanes 1 Problem Formulation The Onion Creek Watershed is located southeast of Austin where population and urbanization
Lab 5 - Introduction to the Geodatabase
 Lab 5 - Introduction to the Geodatabase 1. Design Process GIS is becoming an increasingly accessible and important tool for land managers. In this exercise you will begin creating a Personal Geodatabase
GIS Lecture 5: Spatial Data
 GIS Lecture 5: Spatial Data GIS 1 Outline Vector Data Formats Raster Data Formats Map Projections Coordinate Systems US Census geographic files US Census data files GIS Data Sources GIS 2 Vector Data Formats
Final Group Project Paper. Where Should I Move: The Big Apple or The Lone Star State
 Final Group Project Paper Where Should I Move: The Big Apple or The Lone Star State By: Nathan Binder, Shannon Scolforo, Kristina Conste, Madison Quinones Main Goal: Determine whether New York or Texas
WlLPEN L. GORR KRISTEN S. KURLAND. Universitats- und Landesbibliothek. Bibliothek Architektur und Stadtebau ESRI
 hj WlLPEN L. GORR KRISTEN S. KURLAND Universitats- und Landesbibliothek Darmstadt Bibliothek Architektur und Stadtebau ESRI Contents Acknowledgments Preface xvii XV GIS Tutorial 1 Introduction Launch ArcMap