GIS Final Project Determining Regions of Anthropogenic Recharge
|
|
|
- Hugh Anderson
- 5 years ago
- Views:
Transcription
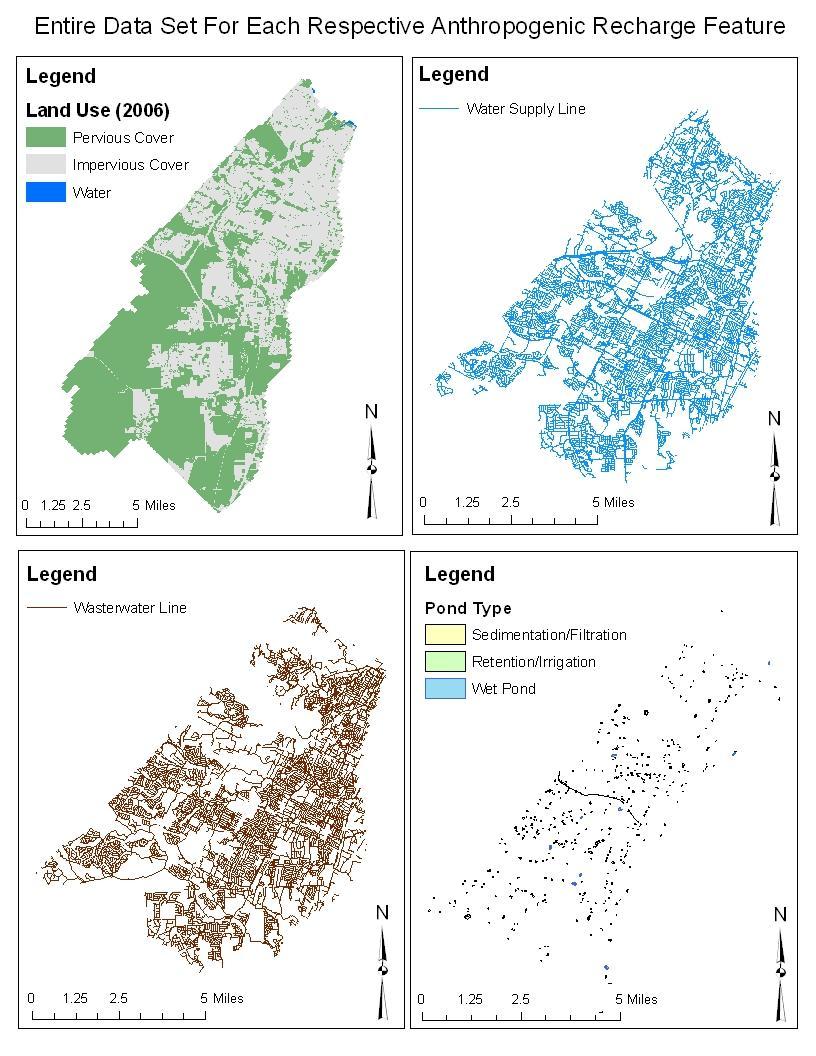
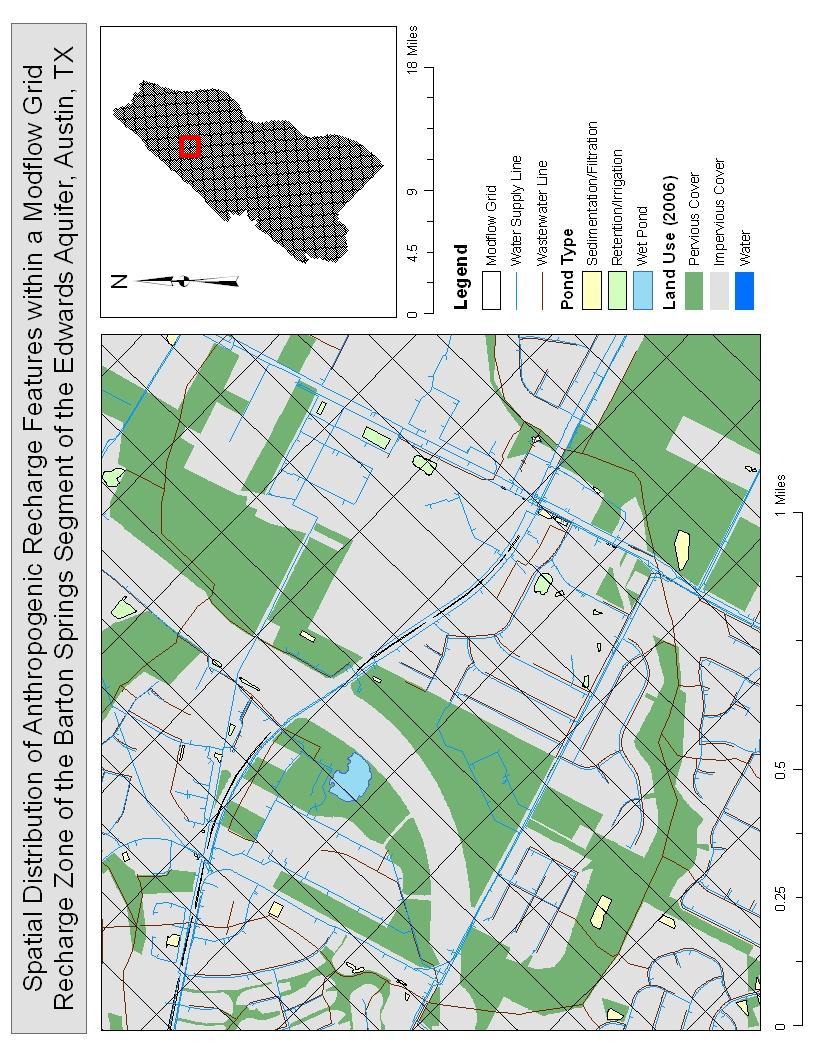
1 Michael Passarello 04/06/10 GIS Final Project Determining Regions of Anthropogenic Recharge Objective A grid for the recharge zone of the Barton Springs segment of the Edwards Aquifer within the city limits of Austin, TX was generated by Pierce (2006). This grid was utilized in Modflow to model recharge in both natural and human-influenced conditions. Pierce (2006) originally determined the amounts of impervious cover within each cell of the grid in order to correct recharge values by designating these zones as regions of no recharge. Since this study, Wiles (2007) has determined that areas with impervious cover contribute recharge from secondary permeability. Additionally, a previous study, (Garcia-Fresca, 2004), has identified other sources of recharge within urbanized areas that have not been traditionally considered. These sources include leakage from water utility lines, waste water lines, and stormwater ponds. The objective of this study is to determine the area covered by impervious cover, stormwater ponds, water supply lines, and waste water lines within each cell of the grid produced in Pierce (2006). Each feature has an associated recharge rate that will be utilized in Modflow to determine the overall recharge rate of each cell. A GIS will be utilized to divide each anthropogenic recharge feature into its corresponding cell based on its geographic location. After features are divided into separate cells, the total area covered by each feature within any cell can be calculated. Data Collection The grid shapefile was supplied by Dr. Suzanne Pierce from the Center for International Energy and Environmental Policy, Jackson School of Geosciences, The University of Texas at Austin. The shapefiles for stormwater ponds, land uses for Austin (2006), water utility lines, and waste water lines were supplied by the City of Austin. The files supplied by the City of Austin can be downloaded online at:
2 ftp://ftp.ci.austin.tx.us/gis-data/regional/coa_gis.html. The following is a table summarizing the data obtained for this study. Name Shapefile Type Projected Coordinate System Source Land Use (2006) Polygon NAD_1983_StatePlane_Texas_Central_FIPS_4203_Feet City of Austin ommercial Ponds Polygon NAD_1983_StatePlane_Texas_Central_FIPS_4203_Feet City of Austin Residential Ponds Polygon NAD_1983_StatePlane_Texas_Central_FIPS_4203_Feet City of Austin Modflow Grid Polygon NAD_1983_Albers Pierce (2006) Water Lines Line NAD_1983_StatePlane_Texas_Central_FIPS_4203_Feet City of Austin aste Water Lines Line NAD_1983_StatePlane_Texas_Central_FIPS_4203_Feet City of Austin Data Preprocessing No preprocessing was required. Data Processing 1. Defining Projections: converted the Modflow Grid to NAD 1983, StatePlane Texas Central FIPS 4203 Feet. ArcToolbox Data Management Tools Projections and Transformation Define Projection 2. Create Personal Geodatabase: imported multiple feature classes into a Personal Geodatabase in order to more easily manage files Open ArcCatalog Right Click on desired folder New Personal Geodatabase Right Click on newly created Personal Geodatabase Import Feature Class (multiple) Select desired shapefiles 3. Clip Files to Modflow Grid: clip all shapefiles to the Modflow grid in order to get rid of data outside of the region of interest. Also helps reduce the size of the files which allows greater ease of processing ArcToolbox Analysis Tools Extract Clip (Input Features = shapefiles to be clipped, Clip Features = grid) 4. Edit Pond Files: delete Flood Detention ponds from both the Commercial and Residential pond clipped shapefiles. These ponds are not considered for this study and do not need to be included. After the

3 Flood Detention ponds are removed, the remaining ponds are grouped into three categories: Wet Ponds, Retention/Irrigation, Sedimentation/Filtration Editor drop down arrow Start Editing Target: Commercial or Residential pond shapefile Open Attribute Table Options drop down arrow Select by Attributes Input Formula: [POND_TYPE] = Flood Detention Right Click on selected Delete Selected Save Edits Stop Editing 5. Join Clipped Land Use Shapefile and Table: the land use file was not originally joined to its look up table that identified what land use types corresponded to land use codes. After the file was joined to the lookup table, land use types could be defined. Right Click on the land use shapefile in the TOC Joins and Relates Join Select appropriate fields the join will be based on and the table the join will be based upon 6. Divide clipped shapefiles based on corresponding grid cells utilizing the Identity tool: This step will make new shapefiles from the clipped shapefiles; their new shapes will be based upon their original outlines and where they intersect the Modflow grids. The main goal of this step was to create new shapefiles that contained information about which Modflow grid cell it was within. Computes a geometric intersection of the Input Features and Identity Features. The Input Features or portions thereof that overlap Identity Features will get the attributes of those Identity Features (ArcGIS help).

4 ArcToolbox Analysis Tools Identity Input Features: Desired Shapefile to be divided, Identity Features: Modflow Grid, XY Tolerance: 1 foot 7. Combine similar recharge features from the Identity analysis into a single shapefile utilizing the Dissolve tool: The attributes used to combine recharge features were Type (pond type or land use type) and Grid Cell ID. Once this was done, new shapfiles were created by combining previous shapefiles together based on these two attributes. Aggregates features based on specified attributes.(arcgis Help). ArcToolbox Data Management Tools Generalization Dissolve Input Features: Shapefiles from the Identity Analysis, Dissolve Fields: Pond/Land Use Type and Modflow Grid Cell ID 8. Symobolize dissolved shapefiles accordingly and generate map
5 Results The end product of this project allows for easy calculation of area and length of each recharge feature within each Modflow grid cell. There are over 3000 grid cells; thus, no manageable table was created to summarize the data for all cells. Instead, a map was created for a random region within the grid to represent what the map would look like zoomed in to an area of interest. There is also a map displaying the full extent of each data set (recharge features) within the grid. Lastly, one cell was selected to highlight the new shapes files generated through the above processes. Five screen shots were taken to highlight these different recharge features being highlighted with its corresponding attribute table.
6
7
8 Screen Shot 1

9 Screen Shot 4 Screen Shot 2
10 Screen Shot 3
11 Screen Shot 4

12 Screen Shot 5
Analysis of Change in Land Use around Future Core Transit Corridors: Austin, TX, Eric Porter May 3, 2012
 Analysis of Change in Land Use around Future Core Transit Corridors: Austin, TX, 1990-2006 PROBLEM DEFINITION Eric Porter May 3, 2012 This study examines the change in land use from 1990 to 2006 in the
Introduction. Purpose
 Introduction The Edwards Aquifer is a karst aquifer in Central Texas whose hydrogeological properties are not fully understood. This is due to exaggerated heterogeneity of properties, high anisotropy due
Urbanization factors in the Gilleland Creek watershed, Travis County, Texas. Michael Kanarek GEO386G Final Project Dec. 2, 2011
 Urbanization factors in the Gilleland Creek watershed, Travis County, Texas Michael Kanarek GEO386G Final Project Dec. 2, 2011 1 Introduction The watershed of Gilleland Creek, which flows through eastern
GEO 327G Semester Project. Urbanization in the Onion Creek Watershed
 GEO 327G Semester Project Urbanization in the Onion Creek Watershed Hanes, Ian M 12-4-2014 Hanes 1 Problem Formulation The Onion Creek Watershed is located southeast of Austin where population and urbanization
In this exercise we will learn how to use the analysis tools in ArcGIS with vector and raster data to further examine potential building sites.
 GIS Level 2 In the Introduction to GIS workshop we filtered data and visually examined it to determine where to potentially build a new mixed use facility. In order to get a low interest loan, the building
Hazard Assessment of Lava Flows, Wildfires, and Tsunamis on the Big Island of Hawaii s population. By: Thomas Ditges
 Hazard Assessment of Lava Flows, Wildfires, and Tsunamis on the Big Island of Hawaii s population By: Thomas Ditges The Problem: The Big Island of Hawaii is the largest and most dangerous of the Hawaiian
Watershed Delineation
 Watershed Delineation Jessica L. Watkins, University of Georgia 2 April 2009 Updated by KC Love February 25, 2011 PURPOSE For this project, I delineated watersheds for the Coweeta synoptic sampling area
How to Create Stream Networks using DEM and TauDEM
 How to Create Stream Networks using DEM and TauDEM Take note: These procedures do not describe all steps. Knowledge of ArcGIS, DEMs, and TauDEM is required. TauDEM software ( http://hydrology.neng.usu.edu/taudem/
Determining the Location of the Simav Fault
 Lindsey German May 3, 2012 Determining the Location of the Simav Fault 1. Introduction and Problem Formulation: The issue I will be focusing on involves interpreting the location of the Simav fault in
Outline Anatomy of ArcGIS Metadata Data Types Vector Raster Conversion Adding Data Navigation Symbolization Methods Layer Files Editing Help Files
 UPlan Training Lab Exercise: Introduction to ArcGIS Outline Anatomy of ArcGIS Metadata Data Types Vector Raster Conversion Adding Data Navigation Symbolization Methods Layer Files Editing Help Files Anatomy
SIE 509 Principles of GIS Exercise 5 An Introduction to Spatial Analysis
 SIE 509 Principles of GIS Exercise 5 An Introduction to Spatial Analysis Due: Oct. 31, 2017 Total Points: 50 Introduction: The Governor of Maine is asking communities to look at regionalization for major
(THIS IS AN OPTIONAL BUT WORTHWHILE EXERCISE)
") PART 2: Analysis in ArcGIS (THIS IS AN OPTIONAL BUT WORTHWHILE EXERCISE) Step 1: Start ArcCatalog and open a geodatabase If you have a shortcut icon for ArcCatalog on your desktop, double-click it to start
PART 2: Analysis in ArcGIS (THIS IS AN OPTIONAL BUT WORTHWHILE EXERCISE) Step 1: Start ArcCatalog and open a geodatabase If you have a shortcut icon for ArcCatalog on your desktop, double-click it to start
CE 365K Exercise 1: GIS Basemap for Design Project Spring 2014 Hydraulic Engineering Design
 CE 365K Exercise 1: GIS Basemap for Design Project Spring 2014 Hydraulic Engineering Design The purpose of this exercise is for you to construct a basemap in ArcGIS for your design project. You may execute
Compilation of GIS data for the Lower Brazos River basin
 Compilation of GIS data for the Lower Brazos River basin Francisco Olivera, Ph.D., P.E. Srikanth Koka Lauren Walker Aishwarya Vijaykumar Department of Civil Engineering December 5, 2011 Contents Brief
GIS Level 2. MIT GIS Services
 GIS Level 2 MIT GIS Services http://libraries.mit.edu/gis Email: gishelp@mit.edu TOOLS IN THIS WORKSHOP - Definition Queries - Create a new field in the attribute table - Field Calculator - Add XY Data
Preparing a NFIE-Geo Database for Travis County
 Preparing a NFIE-Geo Database for Travis County By David R. Maidment Center for Research in Water Resources University of Texas at Austin 2 February 2015 Contents Introduction... 1 Step 1. Download and
Lauren Jacob May 6, Tectonics of the Northern Menderes Massif: The Simav Detachment and its relationship to three granite plutons
 Lauren Jacob May 6, 2010 Tectonics of the Northern Menderes Massif: The Simav Detachment and its relationship to three granite plutons I. Introduction: Purpose: While reading through the literature regarding
GIS CONCEPTS ARCGIS METHODS AND. 3 rd Edition, July David M. Theobald, Ph.D. Warner College of Natural Resources Colorado State University
 GIS CONCEPTS AND ARCGIS METHODS 3 rd Edition, July 2007 David M. Theobald, Ph.D. Warner College of Natural Resources Colorado State University Copyright Copyright 2007 by David M. Theobald. All rights
Geographical Information Systems
 Geographical Information Systems Geographical Information Systems (GIS) is a relatively new technology that is now prominent in the ecological sciences. This tool allows users to map geographic features
The data for this lab comes from McDonald Forest. We will be working with spatial data representing the forest boundary, streams, roads, and stands.
 GIS LAB 6 Using the Projection Utility. Converting Data to Oregon s Approved Lambert Projection. Determining Stand Size, Stand Types, Road Length, and Stream Length. This lab will ask you to work with
Handling Raster Data for Hydrologic Applications
 Handling Raster Data for Hydrologic Applications Prepared by Venkatesh Merwade Lyles School of Civil Engineering, Purdue University vmerwade@purdue.edu January 2018 Objective The objective of this exercise
v Prerequisite Tutorials GSSHA WMS Basics Watershed Delineation using DEMs and 2D Grid Generation Time minutes
 v. 10.1 WMS 10.1 Tutorial GSSHA WMS Basics Creating Feature Objects and Mapping Attributes to the 2D Grid Populate hydrologic parameters in a GSSHA model using land use and soil data Objectives This tutorial
An ArcIMS based interactive map for SeaWorld San Antonio
 An ArcIMS based interactive map for SeaWorld San Antonio Morgan K. Dean Advanced GIS, Earth and Environmental Science Department University of Texas at San Antonio One UTSA Circle, San Antonio, TX. 78249,
Within this document, the term NHDPlus is used when referring to NHDPlus Version 2.1 (unless otherwise noted).
.") Exercise 7 Watershed Delineation Using ArcGIS Spatial Analyst Last Updated 4/6/2017 Within this document, the term NHDPlus is used when referring to NHDPlus Version 2.1 (unless otherwise noted). There
Exercise 7 Watershed Delineation Using ArcGIS Spatial Analyst Last Updated 4/6/2017 Within this document, the term NHDPlus is used when referring to NHDPlus Version 2.1 (unless otherwise noted). There
Esri EADA10. ArcGIS Desktop Associate. Download Full Version :
 Esri EADA10 ArcGIS Desktop Associate Download Full Version : http://killexams.com/pass4sure/exam-detail/eada10 Question: 85 Which format is appropriate for exporting map documents that require vector layers
INTRODUCTION TO ARCGIS Version 10.*
 Week 3 INTRODUCTION TO ARCGIS Version 10.* topics of the week Overview of ArcGIS Using ArcCatalog Overview of ArcGIS Desktop ArcGIS Overview Scalable desktop applications ArcView ArcEditor ArcInfo ArcGIS
GEOREFERENCING, PROJECTIONS Part I. PRESENTING DATA Part II
 Week 7 GEOREFERENCING, PROJECTIONS Part I PRESENTING DATA Part II topics of the week Georeferencing Coordinate systems Map Projections ArcMap and Projections Geo-referencing Geo-referencing is the process
Vector Analysis: Farm Land Suitability Analysis in Groton, MA
 Vector Analysis: Farm Land Suitability Analysis in Groton, MA Written by Adrienne Goldsberry, revised by Carolyn Talmadge 10/9/2018 Introduction In this assignment, you will help to identify potentially
GIS Workshop UCLS_Fall Forum 2014 Sowmya Selvarajan, PhD TABLE OF CONTENTS
 TABLE OF CONTENTS TITLE PAGE NO. 1. ArcGIS Basics I 2 a. Open and Save a Map Document 2 b. Work with Map Layers 2 c. Navigate in a Map Document 4 d. Measure Distances 4 2. ArcGIS Basics II 5 a. Work with
Effects of sea level rise on shallow atolls in the South Pacific
 Tuvalu 2100 Effects of sea level rise on shallow atolls in the South Pacific Kristin Vollmann GEO 327GG December 3, 20100 INTRODUCTION Residents of the tiny island nation of Tuvalu, withh a maximumm elevation
Watershed Analysis of the Blue Ridge Mountains in Northwestern Virginia
 Watershed Analysis of the Blue Ridge Mountains in Northwestern Virginia Mason Fredericks December 6, 2018 Purpose The Blue Ridge Mountain range is one of the most popular mountain ranges in the United
Land Cover Data Processing Land cover data source Description and documentation Download Use Use
 Land Cover Data Processing This document provides a step by step procedure on how to build the land cover data required by EnSim. The steps provided here my be long and there may be short cuts (like using
Midterm Exam : Answer
 Midterm Exam : Answer Create a double-spaced document with answers to the questions below. File Name: LASTNAME_Midterm.pdf Make sure to include your Name, UWNetID, course number, quarter and year, and
Acknowledgments xiii Preface xv. GIS Tutorial 1 Introducing GIS and health applications 1. What is GIS? 2
 Acknowledgments xiii Preface xv GIS Tutorial 1 Introducing GIS and health applications 1 What is GIS? 2 Spatial data 2 Digital map infrastructure 4 Unique capabilities of GIS 5 Installing ArcView and the
GIS CONCEPTS ARCGIS METHODS AND. 2 nd Edition, July David M. Theobald, Ph.D. Natural Resource Ecology Laboratory Colorado State University
 GIS CONCEPTS AND ARCGIS METHODS 2 nd Edition, July 2005 David M. Theobald, Ph.D. Natural Resource Ecology Laboratory Colorado State University Copyright Copyright 2005 by David M. Theobald. All rights
Lab 5 - Introduction to the Geodatabase
 Lab 5 - Introduction to the Geodatabase 1. Design Process GIS is becoming an increasingly accessible and important tool for land managers. In this exercise you will begin creating a Personal Geodatabase
MERGING (MERGE / MOSAIC) GEOSPATIAL DATA
 GEOSPATIAL DATA") This help guide describes how to merge two or more feature classes (vector) or rasters into one single feature class or raster dataset. The Merge Tool The Merge Tool combines input features from input
This help guide describes how to merge two or more feature classes (vector) or rasters into one single feature class or raster dataset. The Merge Tool The Merge Tool combines input features from input
The Geodatabase Working with Spatial Analyst. Calculating Elevation and Slope Values for Forested Roads, Streams, and Stands.
 GIS LAB 7 The Geodatabase Working with Spatial Analyst. Calculating Elevation and Slope Values for Forested Roads, Streams, and Stands. This lab will ask you to work with the Spatial Analyst extension.
WlLPEN L. GORR KRISTEN S. KURLAND. Universitats- und Landesbibliothek. Bibliothek Architektur und Stadtebau ESRI
 hj WlLPEN L. GORR KRISTEN S. KURLAND Universitats- und Landesbibliothek Darmstadt Bibliothek Architektur und Stadtebau ESRI Contents Acknowledgments Preface xvii XV GIS Tutorial 1 Introduction Launch ArcMap
Data Structures & Database Queries in GIS
 Data Structures & Database Queries in GIS Objective In this lab we will show you how to use ArcGIS for analysis of digital elevation models (DEM s), in relationship to Rocky Mountain bighorn sheep (Ovis
Welcome to NR502 GIS Applications in Natural Resources. You can take this course for 1 or 2 credits. There is also an option for 3 credits.
 Welcome to NR502 GIS Applications in Natural Resources. You can take this course for 1 or 2 credits. There is also an option for 3 credits. The 1st credit consists of a series of readings, demonstration,
Spatial Analysis using Vector GIS THE GOAL: PREPARATION:
 PLAN 512 GIS FOR PLANNERS Department of Urban and Environmental Planning University of Virginia Fall 2006 Prof. David L. Phillips Spatial Analysis using Vector GIS THE GOAL: This tutorial explores some
Exercise 3: GIS data on the World Wide Web
 Exercise 3: GIS data on the World Wide Web These web sites are a few examples of sites that are serving free GIS data. Many other sites exist. Search in Google or other search engine to find GIS data for
Outline. Chapter 1. A history of products. What is ArcGIS? What is GIS? Some GIS applications Introducing the ArcGIS products How does GIS work?
 Outline Chapter 1 Introducing ArcGIS What is GIS? Some GIS applications Introducing the ArcGIS products How does GIS work? Basic data formats The ArcCatalog interface 1-1 1-2 A history of products Arc/Info
Watershed Modeling Orange County Hydrology Using GIS Data
 v. 10.0 WMS 10.0 Tutorial Watershed Modeling Orange County Hydrology Using GIS Data Learn how to delineate sub-basins and compute soil losses for Orange County (California) hydrologic modeling Objectives
Lecture 2. Introduction to ESRI s ArcGIS Desktop and ArcMap
 Lecture 2 Introduction to ESRI s ArcGIS Desktop and ArcMap Outline ESRI What is ArcGIS? ArcGIS Desktop ArcMap Overview Views Layers Attribute Tables Help! Scale Tips and Tricks ESRI Environmental Systems
Introduction to the 176A labs and ArcGIS
 Introduction to the 176A labs and ArcGIS Acknowledgement: Slides by David Maidment, U Texas-Austin and Francisco Olivera (TAMU) Purpose of the labs Hands-on experience with one software pakage Introduction
Map My Property User Guide
 Map My Property User Guide Map My Property Table of Contents About Map My Property... 2 Accessing Map My Property... 2 Links... 3 Navigating the Map... 3 Navigating to a Specific Location... 3 Zooming
Introduction to ArcGIS 10.2
 Introduction to ArcGIS 10.2 Francisco Olivera, Ph.D., P.E. Srikanth Koka Lauren Walker Aishwarya Vijaykumar Keri Clary Department of Civil Engineering April 21, 2014 Contents Brief Overview of ArcGIS 10.2...
v WMS Tutorials GIS Module Importing, displaying, and converting shapefiles Required Components Time minutes
 v. 11.0 WMS 11.0 Tutorial Importing, displaying, and converting shapefiles Objectives This tutorial demonstrates how to import GIS data, visualize it, and convert it into WMS coverage data that could be
Geodatabases and ArcCatalog
 Geodatabases and ArcCatalog Francisco Olivera, Ph.D., P.E. Srikanth Koka Lauren Walker Aishwarya Vijaykumar Keri Clary Department of Civil Engineering April 21, 2014 Contents Geodatabases and ArcCatalog...
Task 1: Start ArcMap and add the county boundary data from your downloaded dataset to the data frame.
 Exercise 6 Coordinate Systems and Map Projections The following steps describe the general process that you will follow to complete the exercise. Specific steps will be provided later in the step-by-step
Lecture 2. A Review: Geographic Information Systems & ArcGIS Basics
 Lecture 2 A Review: Geographic Information Systems & ArcGIS Basics GIS Overview Types of Maps Symbolization & Classification Map Elements GIS Data Models Coordinate Systems and Projections Scale Geodatabases
Geodatabases and ArcCatalog
 Geodatabases and ArcCatalog Prepared by Francisco Olivera, Ph.D. and Srikanth Koka Department of Civil Engineering Texas A&M University February 2004 Contents Brief Overview of Geodatabases Goals of the
Calhoun County, Texas Under 5 Meter Sea Level Rise
 Kyle Kacal GEO 327G Calhoun County, Texas Under 5 Meter Sea Level Rise PROBLEM AND PURPOSE: Sea level rise is threat to all coastal areas. Although natural sea level rise happens at a very slow rate, hurricanes
ArcMap - EXPLORING THE DATABASE Part I. SPATIAL DATA FORMATS Part II
 Week 5 ArcMap - EXPLORING THE DATABASE Part I SPATIAL DATA FORMATS Part II topics of the week Exploring the Database More on the Table of Contents Exploration tools Identify, Find, Measure, Map tips, Hyperlink,
Data Creation and Editing
 11.520:A Workshop on Geographical Information Systems 1.188: Urban Planning and Social Science Laboratory Data Creation and Editing Based in part on notes by Prof. Joseph Ferreira and Michael Flaxman Lulu
Huron Creek Watershed 2005 Land Use Map
 Huron Creek Watershed 2005 Land Use Map Created By: Linda Kersten, 12/20/06 Created For: MTU Introduction to GIS Class (FW 5550) The Huron Creek Watershed Advisory Committee Michigan Technological University,
EEOS 381 -Spatial Databases and GIS Applications
 EEOS 381 -Spatial Databases and GIS Applications Lecture 5 Geodatabases What is a Geodatabase? Geographic Database ESRI-coined term A standard RDBMS that stores and manages geographic data A modern object-relational
Session 2: Exploring GIS
 EMB/RTC-GIS/Event 2/Session 2/1 Session 2: Exploring GIS Map Production - Exploring various GIS functions Objectives: 1. To create a map layer Air Pollution Index (API) and its attribute table 2. To symbolize
COMMON GIS TECHNIQUES FOR VECTOR AND RASTER DATA PROCESSING. Ophelia Wang, Department of Geography and the Environment, University of Texas
 COMMON GIS TECHNIQUES FOR VECTOR AND RASTER DATA PROCESSING Ophelia Wang, Department of Geography and the Environment, University of Texas PART I: BASIC VECTOR TOOLS CLIP A FEATURE BASED ON THE EXTENT
WMS 9.0 Tutorial GSSHA Modeling Basics Infiltration Learn how to add infiltration to your GSSHA model
 v. 9.0 WMS 9.0 Tutorial GSSHA Modeling Basics Infiltration Learn how to add infiltration to your GSSHA model Objectives This workshop builds on the model developed in the previous workshop and shows you
GEOG 3830 Geographic Information Systems
 1 GEOG 3830 Geographic Information Systems Lab 08: Spatial Relationships The objective of this lab exercise is to introduce students to a technique commonly used to evaluate the most basic types of spatial
THE CONSERVATION LANDSCAPE CONTEXT TOOLBOX: A Custom ESRI ArcToolbox for the Stewardship of Conservation Lands in Rhode Island
 THE CONSERVATION LANDSCAPE CONTEXT TOOLBOX: A Custom ESRI ArcToolbox for the Stewardship of Conservation Lands in Rhode Island Ann Borowik M.E.S.M. Research Project University of Rhode Island May 2008
Using a GIS to Calculate Area of Occupancy. Part 1: Creating a Shapefile Grid
 Using a GIS to Calculate Area of Occupancy Part 1: Creating a Shapefile Grid By Ryan Elliott California Natural Diversity Database, A NatureServe network program December 2008 This document describes the
Final Group Project Paper. Where Should I Move: The Big Apple or The Lone Star State
 Final Group Project Paper Where Should I Move: The Big Apple or The Lone Star State By: Nathan Binder, Shannon Scolforo, Kristina Conste, Madison Quinones Main Goal: Determine whether New York or Texas
Brief Overview of Geodatabases. Procedure IT GEOGRAPHIC INFORMATION SYSTEMS LAB 9 GEODATABASE AND DIGITIZING SHAPEFILED
 Developing entirely new maps using on-screen digitizing to create spatial features (such as points, lines, and polygons) is a vital GIS capability. ArcGIS provides a useful, but proprietary, spatial data
Outcrop suitability analysis of blueschists within the Dry Lakes region of the Condrey Mountain Window, North-central Klamaths, Northern California
 Outcrop suitability analysis of blueschists within the Dry Lakes region of the Condrey Mountain Window, North-central Klamaths, Northern California (1) Introduction: This project proposes to assess the
Lab 4 -Vector data and Attributes
 Lab 4 -Vector data and Attributes ERSC/BIOL 4421/5421 Name In this lab you will learn how to create your own vector data by collecting point data from GPS coordinates and by digitizing lines using an Aerial
Leon Creek Watershed October 17-18, 1998 Rainfall Analysis Examination of USGS Gauge Helotes Creek at Helotes, Texas
 Leon Creek Watershed October 17-18, 1998 Rainfall Analysis Examination of USGS Gauge 8181400 Helotes Creek at Helotes, Texas Terrance Jackson MSCE Candidate University of Texas San Antonio Abstract The
IDENTIFYING THE TYPE OF COORDINATE SYSTEM FOR DATA USING ARCMAP
 CHAPTER 1 IDENTIFYING THE TYPE OF COORDINATE SYSTEM FOR DATA USING ARCMAP I got a parcel shapefile from the county, but it doesn t line up with my other data in ArcMap. My boss told me to make a map using
GIS in Management Planning. Lab 2 Coordinate Systems and Map Projections
 GIS in Management Planning Lab 2 Coordinate Systems and Map Projections Tomislav Sapic GIS Technologist Faculty of Natural Resources Management Lakehead University ArcGIS ArcToolbox Projections Functions
Using the Stock Hydrology Tools in ArcGIS
 Using the Stock Hydrology Tools in ArcGIS This lab exercise contains a homework assignment, detailed at the bottom, which is due Wednesday, October 6th. Several hydrology tools are part of the basic ArcGIS
i-tree Eco Random Plots Workbook: Pre - Stratification Tips red green
 i-tree Eco Random Plots Workbook: Pre - Stratification These instructions help users of all skill levels create random, pre-stratified UFORE sample points and their associated UFORE-required data within
Geodatabase An Overview
 Federal GIS Conference February 9 10, 2015 Washington, DC Geodatabase An Overview Ralph Denkenberger - esri Session Path The Geodatabase - What is it? - Why use it? - What types are there? Inside the Geodatabase
Environmental Systems Research Institute
 Introduction to ArcGIS ESRI Environmental Systems Research Institute Redlands, California 2 ESRI GIS Development Arc/Info (coverage model) Versions 1-7 from 1980 1999 Arc Macro Language (AML) ArcView (shapefile
Effects of Rising Sea Levels on Coral Reef and Mangrove Distributions along the Great Barrier Reef in Australia
 Effects of Rising Sea Levels on Coral Reef and Mangrove Distributions along the Great Barrier Reef in Australia Sarah Barfield Graduate Student Department of Integrative Biology University of Texas, Austin
Assessing Point Groundwater Contamination Potential
 Assessing Point Groundwater Contamination Potential Florida caves by Introduction Problem Where might caves in Florida be susceptible to potential point contamination sources such as hazardous material
GIS Semester Project Working With Water Well Data in Irion County, Texas
 GIS Semester Project Working With Water Well Data in Irion County, Texas Grant Hawkins Question for the Project Upon picking a random point in Irion county, Texas, to what depth would I have to drill a
Introduction. Project Summary In 2014 multiple local Otsego county agencies, Otsego County Soil and Water
 Introduction Project Summary In 2014 multiple local Otsego county agencies, Otsego County Soil and Water Conservation District (SWCD), the Otsego County Planning Department (OPD), and the Otsego County
Today: GEOL 452/552 - GIS for Geoscientists I. Lecture 3 - Chapter 1. GIS vector Data (review) Let s annotate this layer (draw on paper)
 Let s annotate this layer (draw on paper)") Today: GEOL 452/552 - GIS for Geoscientists I Lecture 3 - Chapter 1 GIS vector data - review raster data history: ArcView/ArcINFO - ArcGIS types of GIS data files Lab: finish Ch. 1 tutorial and HW1 Please
Today: GEOL 452/552 - GIS for Geoscientists I Lecture 3 - Chapter 1 GIS vector data - review raster data history: ArcView/ArcINFO - ArcGIS types of GIS data files Lab: finish Ch. 1 tutorial and HW1 Please
A GIS-based Approach to Watershed Analysis in Texas Author: Allison Guettner
 Texas A&M University Zachry Department of Civil Engineering CVEN 658 Civil Engineering Applications of GIS Instructor: Dr. Francisco Olivera A GIS-based Approach to Watershed Analysis in Texas Author:
Lecture 5. GIS Data Capture & Editing. Tomislav Sapic GIS Technologist Faculty of Natural Resources Management Lakehead University
 Lecture 5 GIS Data Capture & Editing Tomislav Sapic GIS Technologist Faculty of Natural Resources Management Lakehead University GIS Data Input Surveying/GPS Data capture Facilitate data capture Final
Working with the Geodatabase
 Working with the Geodatabase Agenda What is the geodatabase? Benefits of the geodatabase Inside the geodatabase Geodatabase rules Demos Additional resources and training Q & A The Geodatabase is the foundation
Identifying coordinate systems for data using ArcMap
 Chapter 1 Identifying coordinate systems for data using ArcMap I got a parcel shapefile from the county but it doesn t line up with my other data in ArcMap. My boss told me to make a map using ArcMap,
Working with ArcGIS: Classification
 Working with ArcGIS: Classification 2 Abbreviations D-click R-click TOC Double Click Right Click Table of Content Introduction The benefit from the use of geographic information system (GIS) software is
These modules are covered with a brief information and practical in ArcGIS Software and open source software also like QGIS, ILWIS.
 Online GIS Training and training modules covered are: 1. ArcGIS, Analysis, Fundamentals and Implementation 2. ArcGIS Web Data Sharing 3. ArcGIS for Desktop 4. ArcGIS for Server These modules are covered
Automatic Watershed Delineation using ArcSWAT/Arc GIS
 Automatic Watershed Delineation using ArcSWAT/Arc GIS By: - Endager G. and Yalelet.F 1. Watershed Delineation This tool allows the user to delineate sub watersheds based on an automatic procedure using
Linear Referencing in Boulder County, CO. Getting Started
 Linear Referencing in Boulder County, CO Getting Started 1 Authors Janie Pierre GIS Technician, Boulder County Road centerline and storm sewer geodatabases & maps John Mosher GIS Specialist, Boulder County
Tutorial using the 2011 Statistics Canada boundary files and the Householder survey
 Tutorial using the 2011 Statistics Canada boundary files and the Householder survey In this tutorial, we ll try to determine the wards that contain the highest income groups. To do this, we will have to
Presenting Tree Inventory. Tomislav Sapic GIS Technologist Faculty of Natural Resources Management Lakehead University
 Presenting Tree Inventory Tomislav Sapic GIS Technologist Faculty of Natural Resources Management Lakehead University Suggested Options 1. Print out a Google Maps satellite image of the inventoried block
This lab exercise will try to answer these questions using spatial statistics in a geographic information system (GIS) context.
 context.") by Introduction Problem Do the patterns of forest fires change over time? Do forest fires occur in clusters, and do the clusters change over time? Is this information useful in fighting forest fires? This
by Introduction Problem Do the patterns of forest fires change over time? Do forest fires occur in clusters, and do the clusters change over time? Is this information useful in fighting forest fires? This
Spatial Effects on Current and Future Climate of Ipomopsis aggregata Populations in Colorado Patterns of Precipitation and Maximum Temperature
 A. Kenney GIS Project Spring 2010 Amanda Kenney GEO 386 Spring 2010 Spatial Effects on Current and Future Climate of Ipomopsis aggregata Populations in Colorado Patterns of Precipitation and Maximum Temperature
Abstract: Contents. Literature review. 2 Methodology.. 2 Applications, results and discussion.. 2 Conclusions 12. Introduction
 Abstract: Landfill is one of the primary methods for municipal solid waste disposal. In order to reduce the environmental damage and to protect the public health and welfare, choosing the site for landfill
Geoprocessing Tools at ArcGIS 9.2 Desktop
 Geoprocessing Tools at ArcGIS 9.2 Desktop Analysis Tools Analysis Tools \ Extract Clip Analysis Tools \ Extract Select Analysis Tools \ Extract Split Analysis Tools \ Extract Table Select Analysis Tools
ESRI Object Models and Data Capture 2/1/2018
 Number 123 124 125 ESRI* Object Models; Data Capture Feature Class (spatial table) Age_Ma 142 136 1_sigma 1.5 2.0 Rx_Type B_schist G_schist Object Class (nonspatial table) Size_kg 3.4 1.3 Y Control Point
2G1/3G4 GIS TUTORIAL >>>>>>>>>>>>>>>>>>>>>>>>>>>>>>>>>>>>>>>>>>>>>>>>>>>>>>>>>>>>>>>>>>>>>>>>>>>>>>>>
 > University of Michigan >Taubman College of Architecture > ARCH 552, Perimeter @ Work Out [T]here, Fall 2009 >September 24, 2009 2G1/3G4 GIS TUTORIAL >>>>>>>>>>>>>>>>>>>>>>>>>>>>>>>>>>>>>>>>>>>>>>>>>>>>>>>>>>>>>>>>>>>>>>>>>>>>>>>>
ArcGIS Tools for Professional Cartography
 ArcGIS Tools for Professional Cartography By Makram Murad-al-shaikh M.S. Cartography Senior instructor ESRI Educational Services ICC - A Coruña - Spain, 9-16 July, 2005 Overview Overview of the ArcGIS
Geodatabase An Introduction
 2013 Esri International User Conference July 8 12, 2013 San Diego, California Technical Workshop Geodatabase An Introduction David Crawford and Jonathan Murphy Session Path The Geodatabase What is it?
Exercise 2: Working with Vector Data in ArcGIS 9.3
 Exercise 2: Working with Vector Data in ArcGIS 9.3 There are several tools in ArcGIS 9.3 used for GIS operations on vector data. In this exercise we will use: Analysis Tools in ArcToolbox Overlay Analysis