COMMON GIS TECHNIQUES FOR VECTOR AND RASTER DATA PROCESSING. Ophelia Wang, Department of Geography and the Environment, University of Texas
|
|
|
- Agnes Lamb
- 6 years ago
- Views:
Transcription
1 COMMON GIS TECHNIQUES FOR VECTOR AND RASTER DATA PROCESSING Ophelia Wang, Department of Geography and the Environment, University of Texas

2 PART I: BASIC VECTOR TOOLS

3 CLIP A FEATURE BASED ON THE EXTENT OF ANOTHER FEATURE

4 USE THE UNIQUE VALUES OF A ZONING FEATURE TO SPLIT ANOTHER FEATURE
5 CREATE A HOLLOW FEATURE

6 SELECT PORTIONS OF A FEATURE THAT INTERSECTS WITH ANOTHER FEATURE

7 SELECT PORTIONS OF A FEATURE THAT DOES NOT OVERLAP WITH ANOTHER ONE


8 SELECT FEATURES BASED ON ATTRIBUTES OR SPATIAL RELATIONSHIP WITH OTHER FEATURES

9 COMBINE MULTIPLE FEATURES INTO ONE

10 CREATE BUFFER ZONES OF VARIOUS SIZES AND TYPES AROUND FEATURES

11 CREATE NOT JUST ONE BUFFER, BUT MULTIPLE BUFFERS.

12 COMPUTE THE DISTANCE FROM ONE FEATURE TO THE NEAREST FEATURE

13 COMPUTE THE DISTANCES TO ALL FEATURES
14

15 AGGREGATE AND DISSOLVE FEATURES

16 PART II: COMMON RASTER PROCESSING; MOSAIC MULTIPLE RASTERS TOGETHER

17 CLIP RASTER BY EXTENT OF A RECTANGLE OR CIRCLE

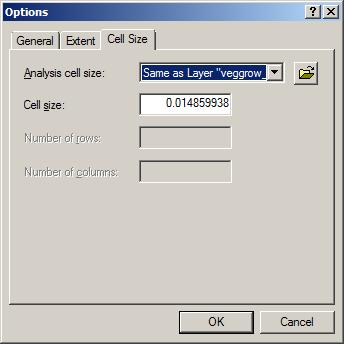
18 CHANGE RASTER CELL SIZE AND RESAMPLE THE CELLS

19 GET CELL VALUES OF PARTICULAR CELLS
20

21 A VERY HANDY TOOL TO USE

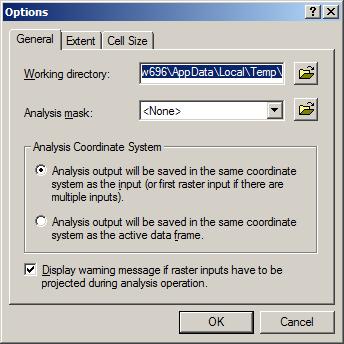
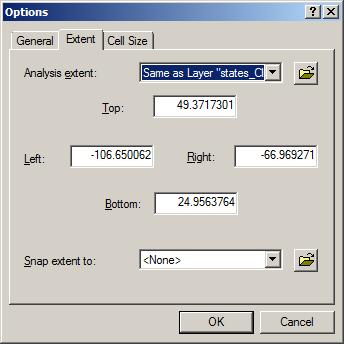
22 OR SET THE MASK IN SPATIAL ANALYST S OPTIONS AND THEN CLICK EVALUATE IN RASTER CALCULATOR TO CLIP THE RASTER

23 EXTRACT THE CELL VALUE OF A RASTER AT WHICH A POINT IS LOCATED

24 GET THE CELL VALUES OF A RASTER AT THE LOCATIONS OF ANOTHER RASTER/FEATURE

25 REDUCE CELL SIZE BY AGGREGATING PIXELS

26 REPLACE THE CELL (AND VALUE) BASED ON THE CONDITION OF NEIGHBORING CELLS

27 ASSIGN NEW RASTER VALUES USING RECLASSIFICATION

28 CALCULATE STATISTICS OF MULTIPLE RASTERS

29 GET THE FREQUENCY OF WHEN A RASTER IS LESS, EQUAL, OR GREATER THAN ANOTHER RASTER S CELL VALUES

30 CALCULATE THE AREA OF A ASTER/FEATURE WHEN IT FALLS INTO EACH ZONE OF ANOTHER RASTER/FEATURE

31 CALCULATE THE GEOMETRY OF A RASTER IN EACH ZONE
32 DATA PREPROCESSING FOR THE MERAUKE PROJECT Ophelia Wang, Department of Geography and the Environment, University of Texas
33 DATA REQUIREMENTS 1. All data layers must share the same spatial extent, total number of cells, cell size, and cell ID 2. Within the oil concession zone--- Cell size = 100 m 166,028 cells

34 GENERATING AN ANALYSIS MASK Mask: a habitat layer derived from classifications of land cover and flooded areas, and maps of geology groups and topographic position index
35 In ArcGIS: Convert the habitat raster to point shapefile each point has an ID convert the points back to raster using the IDs the raster value of each cell represents cell ID use as mask
")
36 LIST OF OTHER LAYERS Production suitability 2-km buffers around each village 500-m buffers around each sacred site or cultural site Rarity Hydrological-wetland connectivity Community-assigned habitat usage scores (six community layers)


37 PRODUCTION SUITABILITY (5 OR 10 CLASSES) Suitability map on a gradient of across the broader Merauke landscape Regrouped to 5 suitability classes for areas within the concession boundary; 5= high, 1=low (Map source: Conservation International)
38 VILLAGES WITH 2-KM BUFFERS Village point shapefile create a 2-km buffer around each point convert buffers to raster use the cell ID mask raster calculator: con(isnull[buffer], 0, [buffer]) (same process to create sacred + cultural 500-m buffer layer)
39 SACRED + CULTURAL SITE BUFFERS NOT OVERLAPPING WITH VILLAGE BUFFERS Overlapped area between village buffers and sacred + cultural buffers: [village] & [sac+cul] calulation con([calculation]==1, 0, [sac+cul]) sacred + cultural site buffers not overlapping with village buffers
40 RARITY AND HYDROLOGICAL CONNECTIVITY LAYERS (MASKED USING SPATIAL ANALYST )
41 COMMUNITY-ASSIGNED SCORES FOR HABITAT TYPES BASED ON USAGE Four important habitat types to use for ConsNet: Flooded savannas, savannas, dry forest, and open land/grassland Reclassify in ArcGIS: remain the codes for the above four habitats and assign other habitats to 0 (done for six community layers)
42 COMMUNITY BOUNDARY LAYERS Use the community score layers for habitats con([score]>0, 1, [score]) Six community boundary layers Four scores remained
43 OTHER POTENTIAL LAYERS Sago (a type of resource use) site buffers not overlapping with village buffers Community boundary Distance between the centroid of each cell to the nearest village, sacred, or cultural site (Convert the cell ID points to raster using the distance as value, each cell value = distance
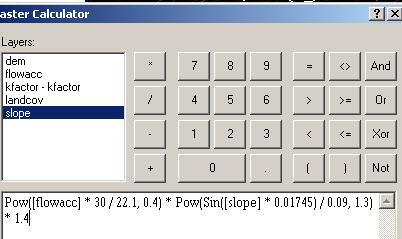
44 Estimating soil erosion rate based on soil, slope, hydrology, and land cover A = R * K * LS * C * P A = estimated average soil loss in tons per acre per year R = rainfall-runoff erosivity factor K = soil erodibility factor L = slope length factor S = slope steepness factor C = cover-management factor P = support practice factor


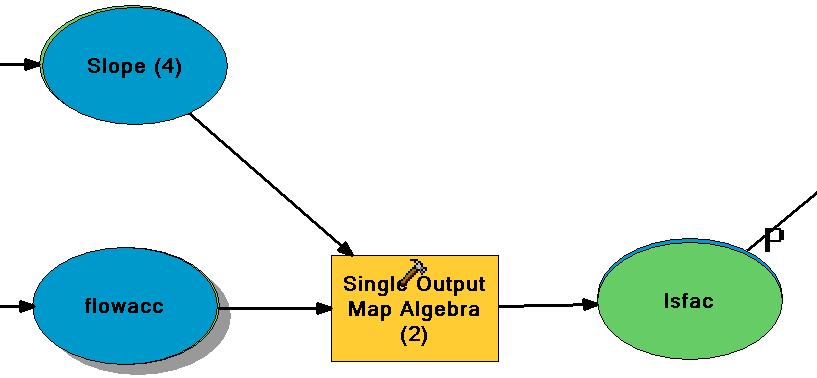
45 MODEL BUILDER EXAMPLE: SOIL EROSION
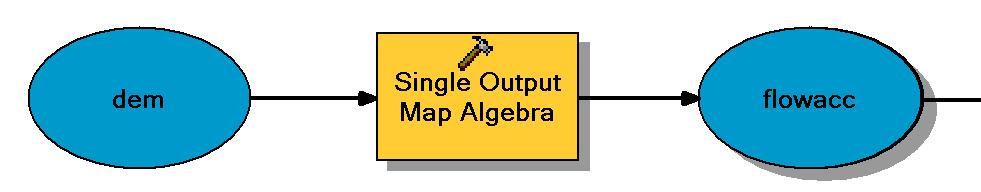
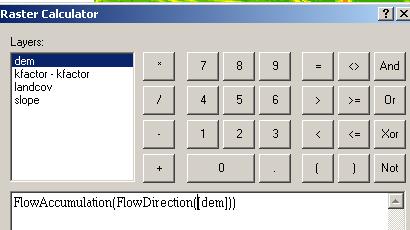
46 FLOW ACCUMULATION LAYER DERIVED FROM FLOW DIRECTION LAYER


47 MAKING SLOPE LAYER FROM SURFACE ANALYSIS TOOL
48
49
50
 are most likely to suffer from")
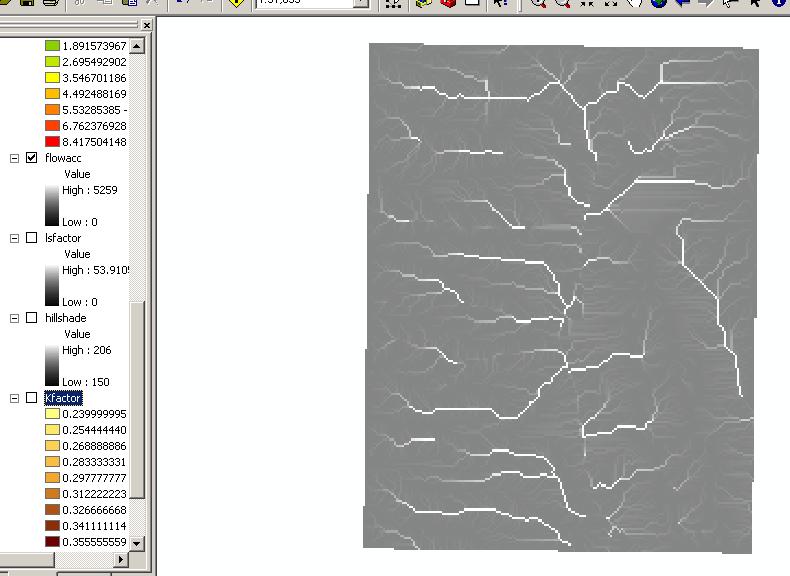
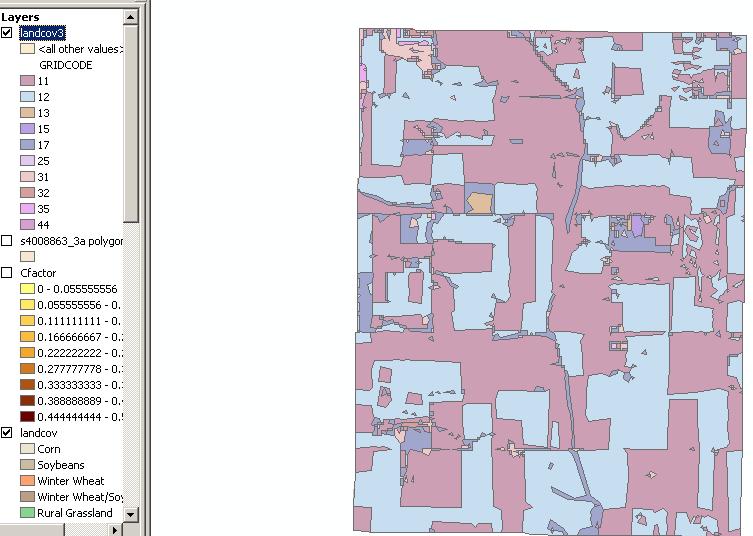
51 The results indicates the areas prone to soil erosion based on the calculations. On the layer erosion, the darker areas (areas of higher values) are most likely to suffer from future soil erosion.
Raster Analysis: An Example
 Raster Analysis: An Example Fires (1 or 4) Slope (1-4) + Geology (1-4) Erosion Ranking (3-12) 1 Typical Raster Model Types: Suitability Modeling: Where is optimum location? Distance Modeling: What is the
Raster Analysis: An Example
 Raster Analysis: An Example Fires (1 or 4) Slope (1-4) + Geology (1-4) Erosion Ranking (3-12) 11/8/2016 GEO327G/386G, UT Austin 1 Typical Raster Model Types: Suitability Modeling: Where is optimum location?
Classification of Erosion Susceptibility
 GEO327G: GIS & GPS Applications in Earth Sciences Classification of Erosion Susceptibility Denali National Park, Alaska Zehao Xue 12 3 2015 2 TABLE OF CONTENTS 1 Abstract... 3 2 Introduction... 3 2.1 Universal
Delineation of high landslide risk areas as a result of land cover, slope, and geology in San Mateo County, California
 Delineation of high landslide risk areas as a result of land cover, slope, and geology in San Mateo County, California Introduction Problem Overview This project attempts to delineate the high-risk areas
Raster Analysis; A Yellowstone Example 3/29/2018
 Fires (1 or 4) Typical Raster Model Types: Raster Analysis: An Example Suitability Modeling: Where is optimum location? Distance Modeling: What is the most efficient path from A to B? + Slope (1-4) Geology
Raster Analysis; A Yellowstone Example 10/24/2013. M. Helper GEO327G/386G, UT Austin 2. M. Helper GEO327G/386G, UT Austin 4
 + Fires (1 or 4) Slope (1-4) Geology (1-4) Erosion Ranking (3-12) Raster Analysis: An Example Typical Raster Model Types: Suitability Modeling: Where is optimum location? Distance Modeling: What is the
Raster Spatial Analysis Specific Theory
 RSATheory.doc 1 Raster Spatial Analysis Specific Theory... 1 Spatial resampling... 1 Mosaic... 3 Reclassification... 4 Slicing... 4 Zonal Operations... 5 References... 5 Raster Spatial Analysis Specific
Geo 327G Semester Project. Landslide Suitability Assessment of Olympic National Park, WA. Fall Shane Lewis
 Geo 327G Semester Project Landslide Suitability Assessment of Olympic National Park, WA Fall 2011 Shane Lewis 1 I. Problem Landslides cause millions of dollars of damage nationally every year, and are
Outcrop suitability analysis of blueschists within the Dry Lakes region of the Condrey Mountain Window, North-central Klamaths, Northern California
 Outcrop suitability analysis of blueschists within the Dry Lakes region of the Condrey Mountain Window, North-central Klamaths, Northern California (1) Introduction: This project proposes to assess the
Land Cover Data Processing Land cover data source Description and documentation Download Use Use
 Land Cover Data Processing This document provides a step by step procedure on how to build the land cover data required by EnSim. The steps provided here my be long and there may be short cuts (like using
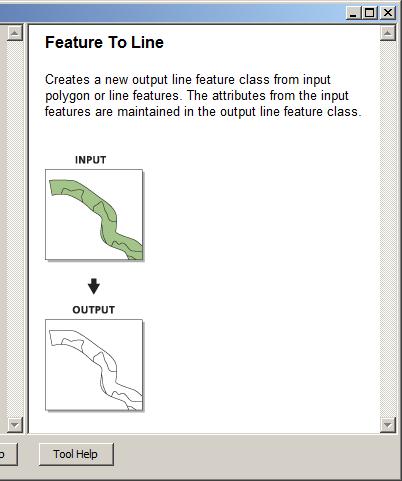
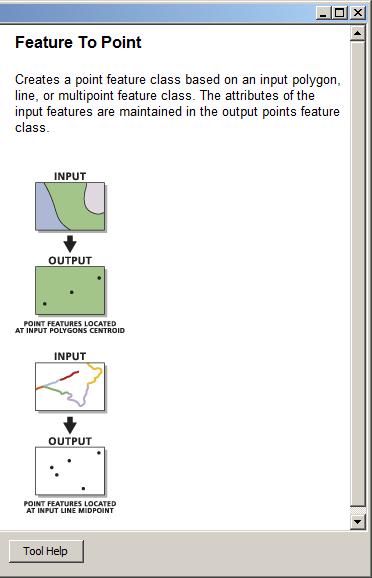
Chapter 6. Fundamentals of GIS-Based Data Analysis for Decision Support. Table 6.1. Spatial Data Transformations by Geospatial Data Types
 Chapter 6 Fundamentals of GIS-Based Data Analysis for Decision Support FROM: Points Lines Polygons Fields Table 6.1. Spatial Data Transformations by Geospatial Data Types TO: Points Lines Polygons Fields
Exercise 6: Using Burn Severity Data to Model Erosion Risk
 Exercise 6: Using Burn Severity Data to Model Erosion Risk Document Updated: November 2009 Software Versions: ERDAS Imagine 9.3 and ArcGIS 9.3, Microsoft Office 2007 Introduction A common use of burn severity
used to transport sediments throughout the lands. In this regard, understanding erosion is
 David Rounce GIS in Water Resources 11/23/2010 Erosion Potential in Travis County INTRODUCTION Erosion has played a vital role in the morphology of the Earth as its processes have been used to transport
Protocol for Prioritizing Conservation Opportunity Areas in Centre County and Clinton County
 Protocol for Prioritizing Conservation Opportunity Areas in Centre County and Clinton County Chesapeake Conservancy has developed this methodology to prioritize conservation opportunity areas in Centre
Alaska, USA. Sam Robbins
 Using ArcGIS to determine erosion susceptibility within Denali National Park, Alaska, USA Sam Robbins Introduction Denali National Park is six million acres of wild land with only one road and one road
Creating Watersheds from a DEM
 Creating Watersheds from a DEM These instructions enable you to create watersheds of specified area using a good quality Digital Elevation Model (DEM) in ArcGIS 8.1. The modeling is performed in ArcMap
Geog 469 GIS Workshop. Data Analysis
 Geog 469 GIS Workshop Data Analysis Outline 1. What kinds of need-to-know questions can be addressed using GIS data analysis? 2. What is a typology of GIS operations? 3. What kinds of operations are useful
GEO 327G Semester Project. Urbanization in the Onion Creek Watershed
 GEO 327G Semester Project Urbanization in the Onion Creek Watershed Hanes, Ian M 12-4-2014 Hanes 1 Problem Formulation The Onion Creek Watershed is located southeast of Austin where population and urbanization
Introduction. Project Summary In 2014 multiple local Otsego county agencies, Otsego County Soil and Water
 Introduction Project Summary In 2014 multiple local Otsego county agencies, Otsego County Soil and Water Conservation District (SWCD), the Otsego County Planning Department (OPD), and the Otsego County
GRAPEVINE LAKE MODELING & WATERSHED CHARACTERISTICS
 GRAPEVINE LAKE MODELING & WATERSHED CHARACTERISTICS Photo Credit: Lake Grapevine Boat Ramps Nash Mock GIS in Water Resources Fall 2016 Table of Contents Figures and Tables... 2 Introduction... 3 Objectives...
Creating Watersheds from a DEM in ArcGIS 9.x
 Creating Watersheds from a DEM in ArcGIS 9.x These instructions enable you to create watersheds (a.k.a. catchments or basins) using a good quality Digital Elevation Model (DEM) in ArcGIS 9.1. The modeling
AN ASSESSMENT OF THE IMPACT OF RETENTION PONDS
 AN ASSESSMENT OF THE IMPACT OF RETENTION PONDS FOR SEDIMENT TRAPPING IN THE ADA CREEK AND LONGWOOD COVE USING REMOTELY SENSED DATA AND GIS ANALYSIS Sudhanshu Sekhar Panda Associate Professor, GIS/Env.
LANDSLIDE HAZARD ANALYSIS AND ITS EFFECT ON ENDANGERED SPECIES HABITATS, GRAND COUNTY, UTAH
 12/5/2016 LANDSLIDE HAZARD ANALYSIS AND ITS EFFECT ON ENDANGERED SPECIES HABITATS, GRAND COUNTY, UTAH GIS Final Project Ashlyn Murphy Fall 2016 1. Introduction and Problem A well-known geologic hazard
Data Collection and GIS Applications
 Data Collection and GIS Applications Governor s s Conference on the Management of the Illinois River System Jeff Jack of all Trades Boeckler, IDNR Introduction Collecting available GIS data sets Creating
How to Create Stream Networks using DEM and TauDEM
 How to Create Stream Networks using DEM and TauDEM Take note: These procedures do not describe all steps. Knowledge of ArcGIS, DEMs, and TauDEM is required. TauDEM software ( http://hydrology.neng.usu.edu/taudem/
Evaluation of gvsig and SEXTANTE Tools for Hydrological Analysis
 Evaluation of gvsig and SEXTANTE Tools for Hydrological Analysis 6th gvsig Conference, Valencia, SPAIN Prof. Dr-Ing Dietrich Schrödera Mudogah Hildahb and Franz Davidb Stuttgart University of Applied Sciences
GIS Final Project Determining Regions of Anthropogenic Recharge
 Michael Passarello 04/06/10 GIS Final Project Determining Regions of Anthropogenic Recharge Objective A grid for the recharge zone of the Barton Springs segment of the Edwards Aquifer within the city limits
ENGRG Introduction to GIS
 ENGRG 59910 Introduction to GIS Michael Piasecki May 1, 2014 Lecture 13: GIS Modeling and Programming Spatial Modeling and Programming The slides about GIS modeling in this lecture are prepared by Dr.
Natalie Cabrera GSP 370 Assignment 5.5 March 1, 2018
 Network Analysis: Modeling Overland Paths Using a Least-cost Path Model to Track Migrations of the Wolpertinger of Bavarian Folklore in Redwood National Park, Northern California Natalie Cabrera GSP 370
Exercise 6: Working with Raster Data in ArcGIS 9.3
 Exercise 6: Working with Raster Data in ArcGIS 9.3 Why Spatial Analyst? Grid query Grid algebra Grid statistics Summary by zone Proximity mapping Reclassification Histograms Surface analysis Slope, aspect,
INTRODUCTION TO ARCGIS 10
 Department of Irrigation, Drainage and Landscape Engineering, Faculty of Civil Engineering, CTU Prague Institute of Hydraulics and Rural Water Management BOKU Vienna INTRODUCTION TO ARCGIS 10 MAIN WINDOW
Overview key concepts and terms (based on the textbook Chang 2006 and the practical manual)
") Introduction Geo-information Science (GRS-10306) Overview key concepts and terms (based on the textbook 2006 and the practical manual) Introduction Chapter 1 Geographic information system (GIS) Geographically
Introduction Geo-information Science (GRS-10306) Overview key concepts and terms (based on the textbook 2006 and the practical manual) Introduction Chapter 1 Geographic information system (GIS) Geographically
Spatio-temporal models
 Spatio-temporal models Involve a least a three dimensional representation of one or more key attribute variation in planar (X-Y) space and through time. (a 4 th dimension could also be use, like Z for
GIS based high speed railway between Calgary-Red Deer-Edmonton
 Capstone Project BGIS Bachel o r of A p p l i ed Technology in G eographic I n f o r m a tion S y s tems GIS based high speed railway between Calgary-Red Deer-Edmonton Sisay Bayafers Arshdeep Virk Jordan
A Basic Introduction to Geographic Information Systems (GIS) ~~~~~~~~~~
 ~~~~~~~~~~") A Basic Introduction to Geographic Information Systems (GIS) ~~~~~~~~~~ Rev. Ronald J. Wasowski, C.S.C. Associate Professor of Environmental Science University of Portland Portland, Oregon 3 September
A Basic Introduction to Geographic Information Systems (GIS) ~~~~~~~~~~ Rev. Ronald J. Wasowski, C.S.C. Associate Professor of Environmental Science University of Portland Portland, Oregon 3 September
June 2018 WORKSHOP SECTION 2 MANUAL: RUNNING PTMAPP-DESKTOP AN INNOVATIVE SOLUTION BY:
 June 2018 WORKSHOP SECTION 2 MANUAL: RUNNING PTMAPP-DESKTOP AN INNOVATIVE SOLUTION BY: TABLE OF CONTENTS 1 PURPOSE... 3 2 SET UP DATA PATHS... 4 2.1 BASE DATA SETUP... 4 3 INGEST DATA... 6 3.1 CLIP WATERSHED...
Abstract: Contents. Literature review. 2 Methodology.. 2 Applications, results and discussion.. 2 Conclusions 12. Introduction
 Abstract: Landfill is one of the primary methods for municipal solid waste disposal. In order to reduce the environmental damage and to protect the public health and welfare, choosing the site for landfill
GIS CONCEPTS ARCGIS METHODS AND. 2 nd Edition, July David M. Theobald, Ph.D. Natural Resource Ecology Laboratory Colorado State University
 GIS CONCEPTS AND ARCGIS METHODS 2 nd Edition, July 2005 David M. Theobald, Ph.D. Natural Resource Ecology Laboratory Colorado State University Copyright Copyright 2005 by David M. Theobald. All rights
Spatial Data Analysis with ArcGIS Desktop: From Basic to Advance
 Spatial Data Analysis with ArcGIS Desktop: From Basic to Advance 1. Course overview Modern environmental, energy as well as resource modeling and planning require huge amount of geographically located
LANDSLIDE RISK ASSESSMENT IN YOSEMITE NATIONAL PARK. Edna Rodriguez December 1 st, 2016 Final Project
 LANDSLIDE RISK ASSESSMENT IN YOSEMITE NATIONAL PARK Edna Rodriguez December 1 st, 2016 Final Project Table of Contents Introduction... 2 Data Collection... 2 Data Preprocessing... 3 ArcGIS Processing...
SuperGIS Server 3.3 Functionality Matrix
 Functionality Matrix Apr 2017 Functionality Matrix SuperGIS Server, a comprehensive and server-based GIS, is designed for the organizations to create, manage, integrate and distribute a variety of GIS
Midterm Exam : Answer
 Midterm Exam : Answer Create a double-spaced document with answers to the questions below. File Name: LASTNAME_Midterm.pdf Make sure to include your Name, UWNetID, course number, quarter and year, and
Presented at the FIG Working Week 2017, May 29 - June 2, 2017 in Helsinki, Finland. Denny LUMBAN RAJA Adang SAPUTRA Johannes ANHORN
 Presented at the FIG Working Week 2017, May 29 - June 2, 2017 in Helsinki, Finland Denny LUMBAN RAJA Adang SAPUTRA Johannes ANHORN MAIN RESULTS Most of the surroundings of Cipongkor is dominated by very
Fire Susceptibility Analysis Carson National Forest New Mexico. Can a geographic information system (GIS) be used to analyze the susceptibility of
 be used to analyze the susceptibility of") 1 David Werth Fire Susceptibility Analysis Carson National Forest New Mexico Can a geographic information system (GIS) be used to analyze the susceptibility of Carson National Forest, New Mexico to forest
1 David Werth Fire Susceptibility Analysis Carson National Forest New Mexico Can a geographic information system (GIS) be used to analyze the susceptibility of Carson National Forest, New Mexico to forest
GIS model & modeling
 GIS model & modeling Model : a simplified representation of a phenomenon or a system. GIS modeling : the use of GIS in the process of building models with spatial data. Basic requirement in modeling :
Tutorial 8 Raster Data Analysis
 Objectives Tutorial 8 Raster Data Analysis This tutorial is designed to introduce you to a basic set of raster-based analyses including: 1. Displaying Digital Elevation Model (DEM) 2. Slope calculations
MAPPING POTENTIAL LAND DEGRADATION IN BHUTAN
 MAPPING POTENTIAL LAND DEGRADATION IN BHUTAN Moe Myint, Geoinformatics Consultant Rue du Midi-8, CH-1196, Gland, Switzerland moemyint@bluewin.ch Pema Thinley, GIS Analyst Renewable Natural Resources Research
SF House Site Suitability
 SF House Site Suitability Rick Waterman Geog621-13 12/9/04 For my final project I chose to create a site suitability model for a house in San Francisco. Being a new resident to San Francisco, I was interested
Working with Digital Elevation Models in ArcGIS 8.3
 Working with Digital Elevation Models in ArcGIS 8.3 The homework that you need to turn in is found at the end of this document. This lab continues your introduction to using the Spatial Analyst Extension
Using ArcGIS for Hydrology and Watershed Analysis:
 Using ArcGIS 10.2.2 for Hydrology and Watershed Analysis: A guide for running hydrologic analysis using elevation and a suite of ArcGIS tools Anna Nakae Feb. 10, 2015 Introduction Hydrology and watershed
WHAT MAKES A GOOD GIS LAB EXERCISE? Robert N. Martin
 WHAT MAKES A GOOD GIS LAB EXERCISE? Robert N. Martin ABSTRACT Having taught GIS for over fifteen years in a lecture/laboratory format, I have developed a series of laboratory exercise that provide a good
Development of statewide 30 meter winter sage grouse habitat models for Utah
 Development of statewide 30 meter winter sage grouse habitat models for Utah Ben Crabb, Remote Sensing and Geographic Information System Laboratory, Department of Wildland Resources, Utah State University
Erosion Susceptibility in the area Around the Okanogan Fire Complex, Washington, US
 Erosion Susceptibility in the area Around the Okanogan Fire Complex, Washington, US 1. Problem Construct a raster that represents susceptibility to erosion based on lithology, slope, cover type, burned
GIS APPLICATIONS IN SOIL SURVEY UPDATES
 GIS APPLICATIONS IN SOIL SURVEY UPDATES ABSTRACT Recent computer hardware and GIS software developments provide new methods that can be used to update existing digital soil surveys. Multi-perspective visualization
A GIS-based Approach to Watershed Analysis in Texas Author: Allison Guettner
 Texas A&M University Zachry Department of Civil Engineering CVEN 658 Civil Engineering Applications of GIS Instructor: Dr. Francisco Olivera A GIS-based Approach to Watershed Analysis in Texas Author:
Mapping Sinkhole Susceptibility of Northwestern Arkansas
 Riley Winebarger May 1, 2018 Problem Statement Mapping Sinkhole Susceptibility of Northwestern Arkansas How accurate is digitally mapping sinkhole susceptibility, and how do different methods compare?
Effects of Rising Sea Levels on Coral Reef and Mangrove Distributions along the Great Barrier Reef in Australia
 Effects of Rising Sea Levels on Coral Reef and Mangrove Distributions along the Great Barrier Reef in Australia Sarah Barfield Graduate Student Department of Integrative Biology University of Texas, Austin
SPATIAL MODELING GIS Analysis Winter 2016
 SPATIAL MODELING GIS Analysis Winter 2016 Spatial Models Spatial Modeling attempts to represent how the world works All models are wrong, but some are useful (G.E. Box, quoted in course textbook pg. 379)
Midterm Exam. 2) What are three important things to keep in mind when selecting colors for a map? (5)
 What are three important things to keep in mind when selecting colors for a map? (5)") Midterm Exam File Name: LASTNAME_Midterm.pdf Make sure to include your Name, UWNetID, course number, and quarter and year, on the document (points will be deducted if you have not identified your work).
Midterm Exam File Name: LASTNAME_Midterm.pdf Make sure to include your Name, UWNetID, course number, and quarter and year, on the document (points will be deducted if you have not identified your work).
INTERNATIONAL JOURNAL OF GEOMATICS AND GEOSCIENCES Volume 6, No 1, 2015
 INTERNATIONAL JOURNAL OF GEOMATICS AND GEOSCIENCES Volume 6, No 1, 2015 Copyright by the authors - Licensee IPA- Under Creative Commons license 3.0 Research article ISSN 0976 4380 Sustainable watershed
LAB EXERCISE #2 Quantifying Patch Mosaics
 LAB EXERCISE #2 Quantifying Patch Mosaics Instructors: K. McGarigal Overview: In this exercise, you will learn to appreciate the challenges of quantifying patch mosaics and gain practical hands-on experience
Summary Description Municipality of Anchorage. Anchorage Coastal Resource Atlas Project
 Summary Description Municipality of Anchorage Anchorage Coastal Resource Atlas Project By: Thede Tobish, MOA Planner; and Charlie Barnwell, MOA GIS Manager Introduction Local governments often struggle
![)UDQFR54XHQWLQ(DQG'tD]'HOJDGR&](/thumbs/95/125846872.jpg ")UDQFR54XHQWLQ(DQG'tD]'HOJDGR&") &21&(37,21$1',03/(0(17$7,212)$1+
&21&(37,21$1',03/(0(17$7,212)$1+ Spatial Analyst. By Sumita Rai
 ArcGIS Extentions Spatial Analyst By Sumita Rai Overview What does GIS do? How does GIS work data models Extension to GIS Spatial Analyst Spatial Analyst Tasks & Tools Surface Analysis Surface Creation
Potential Restorable Wetlands (PRWs):
:") ASWM Webinar Sept. 17, 2014 Potential Restorable Wetlands (PRWs): Working definition: wetland hydrology and soils minus presently mapped wetlands for the re-establishment of wetlands Hydric Soil Query
ASWM Webinar Sept. 17, 2014 Potential Restorable Wetlands (PRWs): Working definition: wetland hydrology and soils minus presently mapped wetlands for the re-establishment of wetlands Hydric Soil Query
Monitoring Headwater Streams for Landscape Response to
 Monitoring Headwater Streams for Landscape Response to Climate Change Matthew Connor, PhD Connor nvironmental, nc. www.oe-i.com icom Healdsburg, California verview Headwater stream geomorphology Response
GIS CONCEPTS ARCGIS METHODS AND. 3 rd Edition, July David M. Theobald, Ph.D. Warner College of Natural Resources Colorado State University
 GIS CONCEPTS AND ARCGIS METHODS 3 rd Edition, July 2007 David M. Theobald, Ph.D. Warner College of Natural Resources Colorado State University Copyright Copyright 2007 by David M. Theobald. All rights
Native species (Forbes and Graminoids) Less than 5% woody plant species. Inclusions of vernal pools. High plant diversity
 Less than 5% woody plant species. Inclusions of vernal pools. High plant diversity") WILLAMETTE VALLEY WET-PRAIRIE RESTORATION MODEL WHAT IS A WILLAMETTE VALLEY WET-PRAIRIE Hot Spot s Native species (Forbes and Graminoids) Rare plant species Less than 5% woody plant species Often dominated
WILLAMETTE VALLEY WET-PRAIRIE RESTORATION MODEL WHAT IS A WILLAMETTE VALLEY WET-PRAIRIE Hot Spot s Native species (Forbes and Graminoids) Rare plant species Less than 5% woody plant species Often dominated
Automatic Watershed Delineation using ArcSWAT/Arc GIS
 Automatic Watershed Delineation using ArcSWAT/Arc GIS By: - Endager G. and Yalelet.F 1. Watershed Delineation This tool allows the user to delineate sub watersheds based on an automatic procedure using
13 Watershed Delineation & Modeling
 Module 4 (L12 - L18): Watershed Modeling Standard modeling approaches and classifications, system concept for watershed modeling, overall description of different hydrologic processes, modeling of rainfall,
Evaluation of gvsig and SEXTANTE Tools for Hydrological Analysis Schröder Dietrich a, Mudogah Hildah b and Franz David b
 Evaluation of gvsig and SEXTANTE Tools for Hydrological Analysis Schröder Dietrich a, Mudogah Hildah b and Franz David b ab Photogrammetry and Geo-informatics Masters Programme, Stuttgart University of
Welcome to NetMap Portal Tutorial
 Welcome to NetMap Portal Tutorial Potential Applications What Can you do with the Portal? At least 25 things! 1) Locate the best potential fish habitats. 2) Identify biological hotspots. 3) Map floodplain
Using Morphometric models and Open Source Software to locate Flood prone areas A guide to pilot Implementation
 SciNetNatHaz Project Progress Meeting - 23-26 Oct 2014, Burgas, Bulgaria SciNetNatHaz Project Progress Meeting - 7-9 May 2015, Thessaloniki, Hellas Using Morphometric models and Open Source Software to
Watershed Analysis of the Blue Ridge Mountains in Northwestern Virginia
 Watershed Analysis of the Blue Ridge Mountains in Northwestern Virginia Mason Fredericks December 6, 2018 Purpose The Blue Ridge Mountain range is one of the most popular mountain ranges in the United
Review Using the Geographical Information System and Remote Sensing Techniques for Soil Erosion Assessment
 Polish J. of Environ. Stud. Vol. 19, No. 5 (2010), 881-886 Review Using the Geographical Information System and Remote Sensing Techniques for Soil Erosion Assessment Nuket Benzer* Landscape Architecture
Leon Creek Watershed October 17-18, 1998 Rainfall Analysis Examination of USGS Gauge Helotes Creek at Helotes, Texas
 Leon Creek Watershed October 17-18, 1998 Rainfall Analysis Examination of USGS Gauge 8181400 Helotes Creek at Helotes, Texas Terrance Jackson MSCE Candidate University of Texas San Antonio Abstract The
Fresh Water: Streams, Lakes Groundwater & Wetlands
 Fresh Water:, Lakes Groundwater & Wetlands Oct 27 Glaciers and Ice Ages Chp 13 Nov 3 Deserts and Wind and EXAM #3 Slope hydrologic cycle P = precip I = precip intercepted by veg ET = evapotranspiration
Classifying Access on Whitewater Wildlife Management Area Callahan Unit using GIS
 Classifying Access on Whitewater Wildlife Management Area Callahan Unit using GIS Chris Scharenbroich 1, 2 1 Department of Resource Analysis, Saint Mary s University of Minnesota, Winona, MN 55987, 2 Minnesota
Designing a Dam for Blockhouse Ranch. Haley Born
 Designing a Dam for Blockhouse Ranch Haley Born CE 394K GIS in Water Resources Term Paper Fall 2011 Table of Contents Introduction... 1 Data Sources... 2 Precipitation Data... 2 Elevation Data... 3 Geographic
Geoprocessing Tools at ArcGIS 9.2 Desktop
 Geoprocessing Tools at ArcGIS 9.2 Desktop Analysis Tools Analysis Tools \ Extract Clip Analysis Tools \ Extract Select Analysis Tools \ Extract Split Analysis Tools \ Extract Table Select Analysis Tools
Spatial Analyst: Multiple Criteria Evaluation Material adapted from FOR 4114 developed by Forestry Associate Professor Steve Prisley
 Spatial Analyst: Multiple Criteria Evaluation Material adapted from FOR 4114 developed by Forestry Associate Professor Steve Prisley Section 1: Data In this exercise we will be working with several types
ArcGIS Tools for Professional Cartography
 ArcGIS Tools for Professional Cartography By Makram Murad-al-shaikh M.S. Cartography Senior instructor ESRI Educational Services ICC - A Coruña - Spain, 9-16 July, 2005 Overview Overview of the ArcGIS
SIE 509 Principles of GIS Exercise 5 An Introduction to Spatial Analysis
 SIE 509 Principles of GIS Exercise 5 An Introduction to Spatial Analysis Due: Oct. 31, 2017 Total Points: 50 Introduction: The Governor of Maine is asking communities to look at regionalization for major
Delineation of Watersheds
 Delineation of Watersheds Adirondack Park, New York by Introduction Problem Watershed boundaries are increasingly being used in land and water management, separating the direction of water flow such that
Title: ArcMap: Calculating Soil Areas for Storm Water Pollution Prevention Plans Authors: Brandy Woodcock, Benjamin Byars
 Title: ArcMap: Calculating Soil Areas for Storm Water Pollution Prevention Plans Authors: Brandy Woodcock, Benjamin Byars Introduction Abstract: The use of ArcMap to calculate soil areas for storm water
Watershed Application of WEPP and Geospatial Interfaces. Dennis C. Flanagan
 Watershed Application of WEPP and Geospatial Interfaces Dennis C. Flanagan Research Agricultural Engineer USDA-Agricultural Research Service Adjunct Professor Purdue Univ., Dept. of Agric. & Biol. Eng.
Learning Unit Student Guide. Title: Estimating Areas of Suitable Grazing Land Using GPS, GIS, and Remote Sensing
 Learning Unit Student Guide Name of Creator: Jeff Sun Institution: Casper College Email: jsun@caspercollege.edu Phone: Office (307) 268-3560 Cell (307) 277-9766 Title: Estimating Areas of Suitable Grazing
Determination of Urban Runoff Using ILLUDAS and GIS
 Texas A&M University Department of Civil Engineering Instructor: Dr. Francisco Olivera CVEN689 Applications of GIS to Civil Engineering Determination of Urban Runoff Using ILLUDAS and GIS Tae Jin Kim 03.
A landscape characterization method for the Uusimaa region + identification of potential use for GIS
 A landscape characterization method for the Uusimaa region + identification of potential use for GIS Methodology: Updating the Finnish method The key finding The scope of characterization methods are limited
Using the Stock Hydrology Tools in ArcGIS
 Using the Stock Hydrology Tools in ArcGIS This lab exercise contains a homework assignment, detailed at the bottom, which is due Wednesday, October 6th. Several hydrology tools are part of the basic ArcGIS
Week 7 Last week: This week s topics. GIS and Forest Engineering Applications. FE 257. GIS and Forest Engineering Applications.
 FE 257. GIS and Forest Engineering Applications Week 7 Week 7 Last week: Spatial Projections Questions? Next week- read: Chapter 10: Updating GIS Databases Chapter 12: Synthesis of Techniques Applied to
Which map shows the stream drainage pattern that most likely formed on the surface of this volcano? A) B)
 B)") 1. When snow cover on the land melts, the water will most likely become surface runoff if the land surface is A) frozen B) porous C) grass covered D) unconsolidated gravel Base your answers to questions
1. When snow cover on the land melts, the water will most likely become surface runoff if the land surface is A) frozen B) porous C) grass covered D) unconsolidated gravel Base your answers to questions
In this exercise we will learn how to use the analysis tools in ArcGIS with vector and raster data to further examine potential building sites.
 GIS Level 2 In the Introduction to GIS workshop we filtered data and visually examined it to determine where to potentially build a new mixed use facility. In order to get a low interest loan, the building
Lauren Jacob May 6, Tectonics of the Northern Menderes Massif: The Simav Detachment and its relationship to three granite plutons
 Lauren Jacob May 6, 2010 Tectonics of the Northern Menderes Massif: The Simav Detachment and its relationship to three granite plutons I. Introduction: Purpose: While reading through the literature regarding
HYDROLOGIC RESPONSE OF HILLSLOPE SEEPS AND HEADWATER STREAMS OF THE FORT WORTH PRAIRIE
 HYDROLOGIC RESPONSE OF HILLSLOPE SEEPS AND HEADWATER STREAMS OF THE FORT WORTH PRAIRIE Shannon Jones M. S. Environmental Science TCU School of Geology, Energy and the Environment November 2, 2013 HEADWATERS
Existing NWS Flash Flood Guidance
 Introduction The Flash Flood Potential Index (FFPI) incorporates physiographic characteristics of an individual drainage basin to determine its hydrologic response. In flash flood situations, the hydrologic
Using GIS data and mapping techniques to delineate areas most prone to hazardous rockfall in the state of Colorado
 Using GIS data and mapping techniques to delineate areas most prone to hazardous rockfall in the state of Colorado Amber Patrick and Erin Manitou-Alvarez Department of Earth and Environmental Sciences
Creation of high resolution soil parameter data by use of artificial neural network technologies (advangeo )
") Creation of high resolution soil parameter data by use of artificial neural network technologies (advangeo ) A. Knobloch 1, F. Schmidt 1, M.K. Zeidler 1, A. Barth 1 1 Beak Consultants GmbH, Freiberg /
Creation of high resolution soil parameter data by use of artificial neural network technologies (advangeo ) A. Knobloch 1, F. Schmidt 1, M.K. Zeidler 1, A. Barth 1 1 Beak Consultants GmbH, Freiberg /
Watershed Delineation
 Watershed Delineation Jessica L. Watkins, University of Georgia 2 April 2009 Updated by KC Love February 25, 2011 PURPOSE For this project, I delineated watersheds for the Coweeta synoptic sampling area
Practical Session Instructions. Terrestrial Water Storage. Drought Monitoring
 Practical Session Instructions Terrestrial Water Storage Drought Monitoring Prof. Bob Su & M.Sc. Lichun Wang ITC, The Netherlands (July 2013) 1 Terrestrial water storage and Drought Monitoring using satellite