Map My Property User Guide
|
|
|
- Dina Lucas
- 6 years ago
- Views:
Transcription


1 Map My Property User Guide
2 Map My Property Table of Contents About Map My Property... 2 Accessing Map My Property... 2 Links... 3 Navigating the Map... 3 Navigating to a Specific Location... 3 Zooming and Panning... 4 Selecting a Base Map... 4 Toolboxes... 5 Find Location of Property... 5 Type Address... 5 Type latitude and Longitude... 5 Define Boundaries... 6 Draw... 6 Load... 7 Save... 7 Soils and Vegetation... 7 Soils... 7 Vegetation Type... 9 Clip... 9 Transparency Measure Area Distance Circle Add Labels Add Linear Features Line Freehand Add Points of Interest Print or Export to PDF Map My Property Page 1

3 About Map My Property Map My Property is a mechanism for the Texas A&M Forest Service to provide users with tools to locate their property, draw and edit the property boundary, measure areas and distances, create labels, linear features, and points of interest, and preview the property boundary map before it is printed or converted to PDF. The application also allows users to view and identify soils and vegetation types, clip these layers to the property boundary, and display in a table the proportion of each type of soil or vegetation in the property. Accessing Map My Property The Map My Property application is located at and is accessible using Microsoft Internet Explorer, Mozilla Firefox, Google Chrome, or Apple Safari. It is recommended that Firefox or Google Chrome be used with the application to optimize performance. Map My Property main page Map My Property Page 2
4 Links TexasForestInfo.com TexasForestInfo.com will take you to the Texas Forest Information Portal. About The About page provides a brief statement on what Map My Property is used for. Contact The Texas A&M Forest Service invites you to provide feedback on the Map My Property application. Please click on the address provided and send your questions, comments, and suggestions for improvement. Help User documentation is provided online. Click the Help link available on the main page to access this user guide. Additionally, for quick information, press the icon provided in the upper right part of each expanded toolbox. TFS Home Click TFS Home to go to the Texas A&M Forest Service main page. Navigating the Map There are several ways to navigate the map. You can zoom to a specific location by entering an address or geographic coordinates in the Find Location of Project Area toolbox. Alternatively, you can manually pan and zoom around the map using the standard Navigator tool in the upper left of the map panel. Navigating to a Specific Location Please see description of the Find Location of Property toolbox. Map My Property Page 3

5 Zooming and Panning There are several ways to zoom and pan around the map using the navigation control found on the top left side of the application. Navigation Panwheel Zoom to Full Extent Click on the Texas icon and it will zoom to the full extent of the map. Pan up Click on the arrow pointing up to pan the map up. Pan down Click on the arrow pointing down to pan the map down. Pan right Click on the arrow pointing right to pan the map to the right. Pan left Click on the arrow pointing left to pan the map to the left. Zoom to Previous Extent Click on the arrow pointing left to zoom to the previous extent in extent history. Zoom to Next Extent Click on the arrow pointing right to zoom the next extent in extent history. Zoom Slider Incremental Zoom use the + and - buttons or move the circular handle to the desired zoom level. Pan button Click on the icon to pan on the map. This tool is usually needed after using the zoom-in-toa-defined-extent or the zoom-out-to-a-defined-extent tool. Zoom-in-to-a-defined-extent-button Click on the icon and click on the map to draw a rectangle that will be the extent to which the tool will zoom in the map. The cursor will change to a icon. To return to the regular cursor and disable the zoom-in tool, click on the pan button. Zoom-out-to-a-defined-extent button Click on the icon and click on the map to draw a rectangle that will be the extent to which the tool will zoom out the map. The cursor will change to a icon. To have a regular cursor and disable the zoom-out tool, click on the pan button. Selecting a Base Map You can view different base maps anytime you desire by sliding to the map option you prefer to view: Hybrid Bing! aerial imagery and labeled roads Streets Esri roads Aerial Esri imagery Topo Esri topographic basemap Map My Property Page 4


 such as Jot 'Em Down, Texas or the street name, city and state (or zip code), for example FM 2154, 77845 or US")

6 Toolboxes The left panel in Map My Property consists of toolboxes that contain tools that locate and draw the boundaries of your property, identify and clip soils, display sensitive areas, conduct operational planning procedures, measure area and distance, add labels, add linear features, add points of interest, and preview a map with your property boundary before you print it or save it to PDF. In addition, there are several tools to produce various reports for the project area. Find Location of Property This toolbox is used to locate your project area quickly. You can either type the address of your property or enter the coordinates in decimal degrees. Type Address Type an address or place name and press the Find Address button. Valid addresses can be in the format of number, street name, city and state abbreviation (or zip code) such as 200 Technology Way, or 200 Technology Way, College Station, TX. Additionally, you can enter just the place name and state abbreviation (or zip code) such as Jot 'Em Down, Texas or the street name, city and state (or zip code), for example FM 2154, or US 290, Dripping Springs, TX. If there is a match, the tool window will show the address returned and the map will zoom in to the place matching that location. Click on Clear Location to delete the point on the map displaying the location of the address used to find the location of the project area. Type Latitude and Longitude If you have coordinates for the project area in decimal degrees, you can type them in the boxes below "Type Latitude and Longitude" and click on the Search button. If coordinates are entered correctly, the map will zoom in to the place matching the coordinates. Click on Clear Location to delete the point displaying the location of the coordinates used to find the location of the property. Map My Property Page 5


 that can be dragged to reshape the")
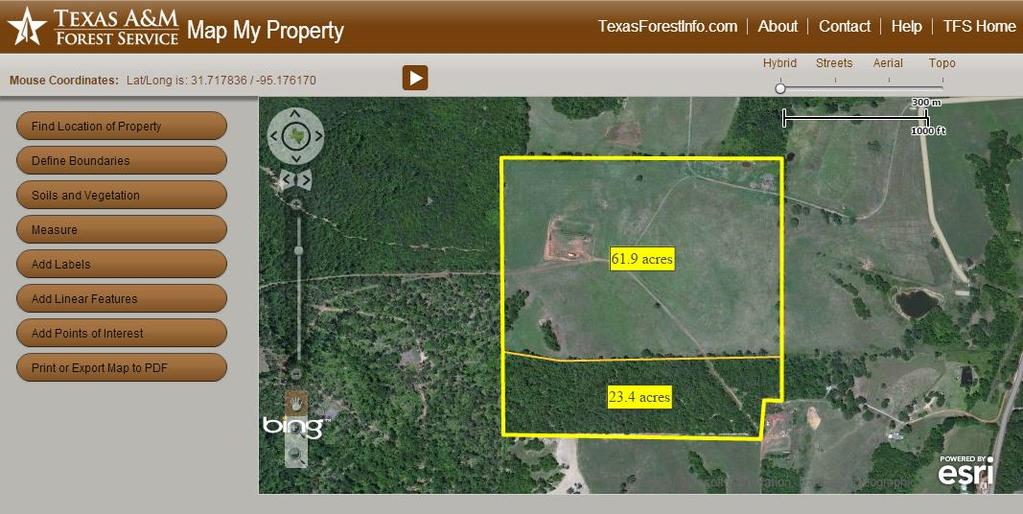
7 Define Boundaries This toolbox contains tools to define the boundaries of the project area. You can draw a boundary and/or load a GPX file with GPS points or a shapefile containing a polygon of the project area. Draw To define the project area by drawing it on the map, click on the Draw button. After moving the cursor to the map, click along the perimeter of the project area at each point along the boundary where the direction changes. On the final corner, or vertex, double-click on the point to complete the boundary. If you are not satisfied with part of the drawing and want to edit it, click on the drawn property to enable the editing mode and view vertices (gray squares) that can be dragged to reshape the boundary. To drag any vertex, click on it and drag it to a new location. To delete individual vertices, right-click on the vertex and click on "Delete vertex". To add a vertex, click anywhere on the boundary and a new vertex appears. To disable the editing mode, click anywhere on the map outside the boundary. To delete individual boundaries or individual acres labels, right-click inside the boundary or on the acres label and click on "Delete Me". To move the entire boundary, click on the drawing to enable editing mode, and then drag the entire drawing to a new location. To move the acres labels, click once on the label and then move it. To draw additional areas, for instance, stands or management areas, repeat the previous steps. Holding the <Ctrl> button down while adding a vertex will cause the new point to snap to an existing boundary point. This is especially useful when drawing stands within a tract boundary. If you are not satisfied with the entire drawing, click on Clear Boundaries to delete it from the map. If you do not wish to display the acres labels inside the property boundary, click on Clear Acres Labels and the labels will be removed from the map. Drawn boundary and acres label Drawn boundary in editing mode with vertices The color, line style, line width, and transparency can be set using the appropriate tool setting in the toolbox. However, these settings must be set prior to drawing a boundary. Default values are yellow, solid, 2 points, and 0 transparency for the respective settings. Map My Property Page 6
, select the file to load,")
8 Load Map My Property allows you to load either a GPX file that contains GPS points or load a shapefile containing a polygon of a boundary. To load either type of file, click on Load. In the Select-file-to-upload window, navigate to the appropriate path, or folder, on your computer, select the file type at the bottom of the window (default is ZIP file), select the file to load, and click on Open. If a GPX file is loaded, the points will be converted to a polygon if the area is smaller than 10,000 acres. If a shapefile is loaded, it must be in the form of a zipped file (since a shapefile is actually made up of a minimum of three files). A loaded file can be edited the same way as described above for drawing a boundary. Also, remember to set your boundary properties, e.g. color, before loading, as the loaded file will take on the properties of the current settings in the toolbox. Save Map My Property allows an easy way to save your boundary as a zipped shapefile in order to load it back in during a new, later session, or to have it accessible to load into other GIS software programs, such as ArcMAP, located on your local computer. To save your boundary to a zipped shapefile, click on Save. When the Select-location-download window appears, navigate to the appropriate location on your local computer and type in a file name making sure to end the name is.zip, and clicking on Save. Not adding the.zip file name extension will result in the file being unloadable later. Soils and Vegetation Map My Property can display a soils layer and a vegetation type layer using the Soils and Vegetation toolbox. Soils This toolbox contains several tools for displaying soils and their attributes either across the entire map or just within the project area. The Soils layer was developed from the Natural Resource Conservation Service (NRCS) Soil Survey Geographic (SSURGO) database. For a description of SSURGO, refer to the NRCS Description of SSURGO Database at For additional information on soil surveys, read the NRCS Soil Survey Manual at To display the soils across the whole map, ensure that Soils is checked and then check on the Visible checkbox. Soil labels will also appear if zoomed in enough. Map My Property Page 7

9 To investigate various attributes associated with an individual soil, check the Identify checkbox. When the Identify checkbox is checked, click on an individual soil on the map to display a window listing a set of selected attributes for that soil. The soils layer shows map units, which are collections of areas defined and named the same in terms of their soil components. For simplicity, the term soil here refers to a map unit. The following attributes have been extracted from SSURGO and included here: Mapunit Key: Unique number for soil used to relate to attribute tables. Mapunit Symbol: Label used on map to identify each soil. Mapunit Name: Name of soil. Slope Gradient: Percent slope. Flooding Frequency: The annual probability of a flood event expressed as a class including None, Very Rare, Rare, Occasional, Frequent, and Very Frequent. Drainage Class: The natural drainage condition of the soil refers to the frequency and duration of wet periods including Excessively Drained, Somewhat Excessively Drained, Well Drained, Moderately Well Drained, Somewhat Poorly Drained, Poorly Drained, Very Poorly Drained. Potential Erosion Hazard: The relative potential erosion hazard for the soil when used as a site for forest roads and trails, expressed as a rating class including Not Rated, Slight, Moderate, Severe, and Very Severe. Hydric Classification: An indication of the proportion of the soil, expressed as a class, that is hydric, based on the hydric classification of individual components of the soil, or map unit. Classes include Unknown, Not Hydric, Partially Hydric, and All Hydric. ph Top Horizon: ph of top horizon as determined using the 1:1 soil-water ratio method. A measure of the relative acidity or alkalinity of a soil sample (acid < 7; alkaline > 7) Ecological Class ID: Ecological Classification ID is the identifier of a particular ecological community. It also serves as a hyperlink to NRSC information about that Ecological Class. Ecological Class: Ecological Classification Name is the descriptive name of a particular ecological community. Range Productivity (lb/ac/yr): The estimated annual production of range forage in pounds per acre per year. Forest productivity (cuft/ac/yr): The annual growth of forest overstory trees in cubic feet per acre per year. Site Index Max Values (age 50): Weighted average of the highest site index (height of trees at 50 years of age) value for any tree species within a component for each soil (map unit). Site Index Loblolly Pine (age 50): Weighted average of site index for loblolly pine. Site Index Shortleaf Pine (age 50): Weighted average of site index for shortleaf pine. Site Index Longleaf Pine (age 50): Weighted average of site index for longleaf pine. Map My Property Page 8
: Weighted average of site index for willow oak. Site Index Sweetgum (age 50): Weighted average of site index for sweetgum.")
10 Site Index Water Oak (age 50): Weighted average of site index for water oak. Site Index Southern Red Oak (age 50): Weighted average of site index for southern red oak. Site Index Willow Oak (age 50): Weighted average of site index for willow oak. Site Index Sweetgum (age 50): Weighted average of site index for sweetgum. Site Index Cottonwood (age 50): Weighted average of site index for eastern cottonwood. Vegetation Type The toolbox can also be used to display vegetation type either across the entire map or just within the project area. The Vegetation Type layer was produced by the Texas Parks and Wildlife Department and partners under the Texas Ecological Systems Classification Project. A 398-class, 10-meter spatial resolution current vegetation map was completed for the state of Texas. The national Ecological Systems Classification provided the fundamental mapping targets. Land cover from 3-date, 30-meter resolution satellite imagery, and abiotic site types from digital county soil surveys and DEM-derived variables, were used together to model the current vegetation. For additional information on the development of this layer, please see vegetation documentation from Texas Parks and Wildlife Department. To show this layer, check Vegetation Layer and ensure Visible is checked. Labels will only show if the zoom level is sufficient. Click on the Identify checkbox and click on anywhere on the map to display the name of the vegetation type and the system and subsystem that type belongs to. The vegetation type name and the subsystem name is hyperlinked to PDF documents that provide short descriptions and photographs. Clip Soils or vegetation types can also be shown for only the project area. To do this, click on Clip. The active layer will be clipped to the boundary of the project area. In addition, a table will display listing the soils or vegetation types along with the acres and percent of the area they comprise. They will be listed in Map My Property Page 9


11 descending order of area. This functionality is only available for project areas of less than 10,000 acres. Clicking on a soil or vegetation layer on the map will highlight it in both the map and in the table. Likewise, clicking on a soil or vegetation type in the table will highlight it both in the table and the map. Clicking on a highlighted soil or vegetation type in either the table or the map will deselect it. The identify tool also works with the project area layers as they do with the map wide layers. Transparency To see what is under the soils or vegetation type layer, adjust the Layer Transparency slider handle to the right. The higher the value, the more transparent the soils layer will be. A transparency value of 75 and greater will cause the active layer to display with no fill and with outlines and labels as orange, similar to the NRCS s Web Soil Survey. Click on Clear Clipped Layer to clear the project area soils. Measure Map My Property provides several tool for measuring areas or distances. Area To measure a polygonal area, click on the Area button. Click on the map where you want to begin measuring and continue to define the perimeter of the area you are measuring. Using the <Ctrl> key while defining the perimeters will snap to existing boundaries. Double-click to complete the measurement. Upon completion of the measurement, a label will appear with the amount of area measured. Map My Property Page 10


12 Distance To measure a linear distance, click on the Distance tool. Measure the distance as is described above for polygonal areas. The distance will be displayed in feet for distances less than 3 miles and in miles for distances greater than 3 miles. Circle Circular areas can also be measured. This may be useful in displaying the area within a certain distance of a user-defined point. Either a drawn circle or a circular area having a user-defined radius can be drawn. Clicking on the Circle button will expand it to show the Draw Circle tool and the Create Radius tool. To draw a circle, click on Draw Circle and click on the map at the user-defined center of the circle to be measured and while holding the mouse button down, drag to the desired size on the map. To draw a circle of a specified radius, click on Create Radius, enter a radius value in feet and click on the map at the desired location. Clear the measurement lines or polygons and labels by clicking Clear. Add Labels The Add Labels toolbox contains a tool and several settings to add userdefined labels to a map. Besides the text, color, size, and font can be set. In addition, other settings such as bold and italic can be defined. To add a label, enter the text for the label and click on Add Label to activate the tool. Click on the desired location on the map to add the label. If the label is not exactly where you want it, click on it and drag it to a new location. If you want to change any attributes to different values than what are provided as defaults, you ll need to change the values before adding the label. Once the label has been added, its appearance cannot be changed, with the exception of location. To delete individual labels, right-click and select Delete me. To delete all labels at once, click on Clear Labels. Map My Property Page 11
 or as freehand lines, such as the way you might draw using a pencil.")


13 Add Linear Features The Add Linear Features toolbox contains two tools for adding linear features such as roads, streams, and utility right-of-ways. Linear features can either be drawn as polylines (connected segments of straight lines) or as freehand lines, such as the way you might draw using a pencil. The style can be set (solid, dash, dot, etc.), the color, the width (in points), and the transparency. As described for labels, these settings must be set before adding the linear features. Line To draw a polyline linear feature, click Line and click on the map at the starting point and begin adding straight-line segments. Double-click to complete the feature. Freehand To draw a freehand linear feature, click Freehand and click on the map at the desired starting point and while holding the mouse button down, drag the mouse along the desired route of the feature. To complete the feature, release the mouse button. Editing of vertices, or points, along the features can be done the same way as described for defining boundaries. Click Clear to remove all linear features. Add Points of Interest Map My Property also includes a toolbox that contains a tool for adding points of interest. The toolbox provides many ways to define the appearance of a point of interest. The shape can be defined including circle, cross, diamond, square, triangle, and x. The size can be changed from default of 20 points. The color and transparency of the fill can be defined as well as the style, color, width, and transparency of the outline of the symbol. To add a point of interest, click Add Point of Interest. Once the tool is activated, click on the map at the desired location. As with labels, the point can be moved. However, the appearance cannot be modified. Right-click and select Delete me to remove an individual point of interest. To remove all points, click Clear Points of Interest to clear all points. Map My Property Page 12
 and one to print at a portrait aspect ratio (long side")


14 Print or Export Map to PDF Besides printing pre-designed reports, Map My Property includes a toolbox to print or export a map to PDF format. The Print or Export Map to PDF toolbox contains two options for printing maps: one to print at a landscape aspect ratio (long side horizontal) and one to print at a portrait aspect ratio (long side vertical). Both options allow you to preview the map before printing or saving to PDF. Make sure you position the project area on the screen before clicking on either button. You may need to pan the map around to find the best position. On the print preview screen, any user-defined text can be entered into a text area to the right of the Comments label. This text will be printed or exported with the map. Clicking on Print will take you to your computer s print screen from which you can print as you normally do. One important thing to note here is that if you print to landscape, you will need to set your printer properties to landscape; else, the map will print as landscape but on a page positioned as portrait. Clicking on PDF will bring up your computer s Save As window from which you can save to a PDF. It is important here to ensure that the file name ends in.pdf. Portrait Landscape Map My Property Page 13
Watershed Modeling Orange County Hydrology Using GIS Data
 v. 10.0 WMS 10.0 Tutorial Watershed Modeling Orange County Hydrology Using GIS Data Learn how to delineate sub-basins and compute soil losses for Orange County (California) hydrologic modeling Objectives
OneStop Map Viewer Navigation
 OneStop Map Viewer Navigation» Intended User: Industry Map Viewer users Overview The OneStop Map Viewer is an interactive map tool that helps you find and view information associated with energy development,
An Instructional Module. FieldScope Unit 1. Introduction to National Geographic Society s FieldScope Program.
 An Instructional Module FieldScope Unit 1 www.budburst.org/fieldscope Introduction to National Geographic Society s FieldScope Program Unit Contents Overview 3 Learning Objectives Time Commitment Technical
Studying Topography, Orographic Rainfall, and Ecosystems (STORE)
") Introduction Studying Topography, Orographic Rainfall, and Ecosystems (STORE) Lesson: Using ArcGIS Explorer to Analyze the Connection between Topography, Tectonics, and Rainfall GIS-intensive Lesson This
Introduction Studying Topography, Orographic Rainfall, and Ecosystems (STORE) Lesson: Using ArcGIS Explorer to Analyze the Connection between Topography, Tectonics, and Rainfall GIS-intensive Lesson This
GIS Workshop UCLS_Fall Forum 2014 Sowmya Selvarajan, PhD TABLE OF CONTENTS
 TABLE OF CONTENTS TITLE PAGE NO. 1. ArcGIS Basics I 2 a. Open and Save a Map Document 2 b. Work with Map Layers 2 c. Navigate in a Map Document 4 d. Measure Distances 4 2. ArcGIS Basics II 5 a. Work with
Guide to Hydrologic Information on the Web
 NOAA s National Weather Service Guide to Hydrologic Information on the Web Colorado River at Lees Ferry Photo: courtesy Tim Helble Your gateway to web resources provided through NOAA s Advanced Hydrologic
BOUNDARY MAP USER GUIDE
 BOUNDARY MAP USER GUIDE Get Exploring. Boundaries. The Northern Ontario Boundary Map provides users with the ability to explore the many community, administrative and service provider boundaries in the
The Geodatabase Working with Spatial Analyst. Calculating Elevation and Slope Values for Forested Roads, Streams, and Stands.
 GIS LAB 7 The Geodatabase Working with Spatial Analyst. Calculating Elevation and Slope Values for Forested Roads, Streams, and Stands. This lab will ask you to work with the Spatial Analyst extension.
Lesson Plan 2 - Middle and High School Land Use and Land Cover Introduction. Understanding Land Use and Land Cover using Google Earth
 Understanding Land Use and Land Cover using Google Earth Image an image is a representation of reality. It can be a sketch, a painting, a photograph, or some other graphic representation such as satellite
The CSC Interface to Sky in Google Earth
 The CSC Interface to Sky in Google Earth CSC Threads The CSC Interface to Sky in Google Earth 1 Table of Contents The CSC Interface to Sky in Google Earth - CSC Introduction How to access CSC data with
Department of Natural Resources Geological Survey. Exploring the Geoscience Atlas
 Department of Natural Resources Geological Survey Exploring the Geoscience Atlas Updated November, 2015 Hyperlinked Contents Background: Browser Setup Browser Setup allow pop-ups Geoscience Online Geoscience
Child Opportunity Index Mapping
 Child Opportunity Index Mapping A partnership project of How to Use and Interpret the Child Opportunity Index Maps How to Use the Child Opportunity Index Maps Getting Started: How to Find and Open a Child
Great Lakes Online Watershed Interface W. Elliot, Research Engineer USDA Forest Service Rocky Mountain Research Station, Moscow, ID March, 2016
 Great Lakes Online Watershed Interface W. Elliot, Research Engineer USDA Forest Service Rocky Mountain Research Station, Moscow, ID March, 2016 Guidelines for using the Web WEPP Watershed Tool to Support
Geographical Information Systems
 Geographical Information Systems Geographical Information Systems (GIS) is a relatively new technology that is now prominent in the ecological sciences. This tool allows users to map geographic features
The data for this lab comes from McDonald Forest. We will be working with spatial data representing the forest boundary, streams, roads, and stands.
 GIS LAB 6 Using the Projection Utility. Converting Data to Oregon s Approved Lambert Projection. Determining Stand Size, Stand Types, Road Length, and Stream Length. This lab will ask you to work with
Office of Geographic Information Systems
 Office of Geographic Information Systems Print this Page Winter 2009 - Desktop GIS: The National Grid Wants You! By Todd Lusk In case of a disaster would you want emergency responders to be able to easily
In this exercise we will learn how to use the analysis tools in ArcGIS with vector and raster data to further examine potential building sites.
 GIS Level 2 In the Introduction to GIS workshop we filtered data and visually examined it to determine where to potentially build a new mixed use facility. In order to get a low interest loan, the building
Koenji. Using ARCGIS Online to explore a place
 Koenji Using ARCGIS Online to explore a place ArcGIS Online is a GIS program that can be opened at http://www.arcgis.com/home/ You can click on Sign-up now or Make a map to get started. It is free to use
(THIS IS AN OPTIONAL BUT WORTHWHILE EXERCISE)
") PART 2: Analysis in ArcGIS (THIS IS AN OPTIONAL BUT WORTHWHILE EXERCISE) Step 1: Start ArcCatalog and open a geodatabase If you have a shortcut icon for ArcCatalog on your desktop, double-click it to start
PART 2: Analysis in ArcGIS (THIS IS AN OPTIONAL BUT WORTHWHILE EXERCISE) Step 1: Start ArcCatalog and open a geodatabase If you have a shortcut icon for ArcCatalog on your desktop, double-click it to start
Presenting Tree Inventory. Tomislav Sapic GIS Technologist Faculty of Natural Resources Management Lakehead University
 Presenting Tree Inventory Tomislav Sapic GIS Technologist Faculty of Natural Resources Management Lakehead University Suggested Options 1. Print out a Google Maps satellite image of the inventoried block
Exercise 6: Using Burn Severity Data to Model Erosion Risk
 Exercise 6: Using Burn Severity Data to Model Erosion Risk Document Updated: November 2009 Software Versions: ERDAS Imagine 9.3 and ArcGIS 9.3, Microsoft Office 2007 Introduction A common use of burn severity
Lecture 9: Reference Maps & Aerial Photography
 Lecture 9: Reference Maps & Aerial Photography I. Overview of Reference and Topographic Maps There are two basic types of maps? Reference Maps - General purpose maps & Thematic Maps - maps made for a specific
Department of Natural Resources Geological Survey. Exploring the Geoscience Atlas
 Department of Natural Resources Geological Survey Exploring the Geoscience Atlas Updated November, 2016 Hyperlinked Contents Background: Browser Setup Browser Setup allow pop-ups Geoscience Online Geoscience
Tutorial 8 Raster Data Analysis
 Objectives Tutorial 8 Raster Data Analysis This tutorial is designed to introduce you to a basic set of raster-based analyses including: 1. Displaying Digital Elevation Model (DEM) 2. Slope calculations
Create Satellite Image, Draw Maps
 Create Satellite Image, Draw Maps 1. The goal Using Google Earth, we want to create and import a background file into our Adviser program. From there, we will be creating paddock boundaries. The accuracy
Development of Webbased. Tool for Tennessee
 Development of Webbased Farm Mapping Tool for Tennessee Southern Region Water Quality Conference, Oct. 24 2005 Forbes Walker and Alan Jolly Biosystems Engineering and SOIL SCIENCE Nutrient Management Planning
Lesson Plan 3 Google Earth Tutorial on Land Use for Middle and High School
 An Introduction to Land Use and Land Cover This lesson plan builds on the lesson plan on Understanding Land Use and Land Cover Using Google Earth. Please refer to it in terms of definitions on land use
Institutional Research with Public Data and Open Source Software
 2017 Institutional Research with Public Data and Open Source Software DUE1304591, 1644409, 1700496 Opinions expressed are those of the authors and not necessarily those of the National Science Foundation.
Downloading GPS Waypoints
 Downloading Data with DNR- GPS & Importing to ArcMap and Google Earth Written by Patrick Florance & Carolyn Talmadge, updated on 4/10/17 DOWNLOADING GPS WAYPOINTS... 1 VIEWING YOUR POINTS IN GOOGLE EARTH...
IMPERIAL COUNTY PLANNING AND DEVELOPMENT
 IMPERIAL COUNTY PLANNING AND DEVELOPMENT GEODATABASE USER MANUAL FOR COUNTY BUSINESS DEVELOPMENT GIS June 2010 Prepared for: Prepared by: County of Imperial Planning and Development 801 Main Street El
CE 365K Exercise 1: GIS Basemap for Design Project Spring 2014 Hydraulic Engineering Design
 CE 365K Exercise 1: GIS Basemap for Design Project Spring 2014 Hydraulic Engineering Design The purpose of this exercise is for you to construct a basemap in ArcGIS for your design project. You may execute
v WMS Tutorials GIS Module Importing, displaying, and converting shapefiles Required Components Time minutes
 v. 11.0 WMS 11.0 Tutorial Importing, displaying, and converting shapefiles Objectives This tutorial demonstrates how to import GIS data, visualize it, and convert it into WMS coverage data that could be
SoilView: Development of a Custom GIS Application for Publishing Soil Surveys
 SoilView: Development of a Custom GIS Application for Publishing Soil Surveys Allan Johnson and Mike Wigginton Abstract Currently, digital soils information can be obtained from many sources. Numerous
The Realist Map contains several views that let you see different aspects about the properties you ve selected on the Map:
 Realist Map Views The Realist Map contains several views that let you see different aspects about the properties you ve selected on the Map: Road: The Road view is a standard Map view showing the roads
Week 8 Cookbook: Review and Reflection
 : Review and Reflection Week 8 Overview 8.1) Review and Reflection 8.2) Making Intelligent Maps: The map sheet as a blank canvas 8.3) Making Intelligent Maps: Base layers and analysis layers 8.4) ArcGIS
ISIS/Draw "Quick Start"
 ISIS/Draw "Quick Start" Click to print, or click Drawing Molecules * Basic Strategy 5.1 * Drawing Structures with Template tools and template pages 5.2 * Drawing bonds and chains 5.3 * Drawing atoms 5.4
Midterm Exam : Answer
 Midterm Exam : Answer Create a double-spaced document with answers to the questions below. File Name: LASTNAME_Midterm.pdf Make sure to include your Name, UWNetID, course number, quarter and year, and
Contour Line Overlays in Google Earth
 Overview: Students download a section of a topographic map of their community from the ATEP website. This file will overlay the Google Earth satellite imagery. Students use the path tool to trace a contour
Working with ArcGIS: Classification
 Working with ArcGIS: Classification 2 Abbreviations D-click R-click TOC Double Click Right Click Table of Content Introduction The benefit from the use of geographic information system (GIS) software is
Trail Flow: Analysis of Drainage Patterns Affecting a Mountain Bike Trail
 Andy Belcher BAE 590 Professor Huffman 12.9.11 Location Trail Flow: Analysis of Drainage Patterns Affecting a Mountain Bike Trail The location of the project area rests in the Cary area of Wake County,
How to Create Stream Networks using DEM and TauDEM
 How to Create Stream Networks using DEM and TauDEM Take note: These procedures do not describe all steps. Knowledge of ArcGIS, DEMs, and TauDEM is required. TauDEM software ( http://hydrology.neng.usu.edu/taudem/
M E R C E R W I N WA L K T H R O U G H
 H E A L T H W E A L T H C A R E E R WA L K T H R O U G H C L I E N T S O L U T I O N S T E A M T A B L E O F C O N T E N T 1. Login to the Tool 2 2. Published reports... 7 3. Select Results Criteria...
SWAMP GIS: A spatial decision support system for predicting and treating stormwater runoff. Michael G. Wing 1 * and Derek Godwin
 Journal of Spatial Hydrology Vol. 11, No. 2 Fall 2011 SWAMP GIS: A spatial decision support system for predicting and treating stormwater runoff Michael G. Wing 1 * and Derek Godwin Abstract SWAMP GIS
Export Basemap Imagery from GIS to CAD
 Export Basemap Imagery from GIS to CAD This tutorial illustrates how to add high resolution imagery as a basemap into an existing CAD drawing using ArcGIS and AutoCAD. Through this method, the imagery
User Guide. Affirmatively Furthering Fair Housing Data and Mapping Tool. U.S. Department of Housing and Urban Development
 User Guide Affirmatively Furthering Fair Housing Data and Mapping Tool U.S. Department of Housing and Urban Development December, 2015 1 Table of Contents 1. Getting Started... 5 1.1 Software Version...
GeoWEPP Tutorial Appendix
 GeoWEPP Tutorial Appendix Chris S. Renschler University at Buffalo - The State University of New York Department of Geography, 116 Wilkeson Quad Buffalo, New York 14261, USA Prepared for use at the WEPP/GeoWEPP
PROJECT LEADER TIP #6 HOW TO ADD SAMPLING UNITS
 PROJECT LEADER TIP #6 HOW TO ADD SAMPLING UNITS Before beginning, it is important to understand that sampling locations are set-up hierarchically. For example, Pacific Flyway Shorebird Survey the hierarchy
Lesser Sunda - Banda Seascape Atlas
 Lesser Sunda - Banda Seascape Atlas Report prepared for the development of online interactive map for Lesser Sunda Banda Seascape by WorldFish December 2014 http://sbsatlas.reefbase.org Page 1 of 8 Table
WindNinja Tutorial 3: Point Initialization
 WindNinja Tutorial 3: Point Initialization 07/20/2017 Introduction Welcome to. This tutorial will step you through the process of running a WindNinja simulation that is initialized by location specific
How do I do that in Quantum GIS: illustrating classic GIS tasks Edited by: Arthur J. Lembo, Jr.; Salisbury University
 How do I do that in Quantum GIS: illustrating classic GIS tasks Edited by: Arthur J. Lembo, Jr.; Salisbury University How do I do that in Quantum GIS Page 1 Introduction from the editor:... 4 Database
ArcGIS 9 ArcGIS StreetMap Tutorial
 ArcGIS 9 ArcGIS StreetMap Tutorial Copyright 2001 2008 ESRI All Rights Reserved. Printed in the United States of America. The information contained in this document is the exclusive property of ESRI. This
Lauren Jacob May 6, Tectonics of the Northern Menderes Massif: The Simav Detachment and its relationship to three granite plutons
 Lauren Jacob May 6, 2010 Tectonics of the Northern Menderes Massif: The Simav Detachment and its relationship to three granite plutons I. Introduction: Purpose: While reading through the literature regarding
Catchment Delineation Workflow
 Catchment Delineation Workflow Slide 1 Given is a GPS point (Lat./Long.) for an outlet location. The outlet could be a proposed Dam site, a storm water drainage culvert on a rural highway, or any other
Space Objects. Section. When you finish this section, you should understand the following:
 GOLDMC02_132283433X 8/24/06 2:21 PM Page 97 Section 2 Space Objects When you finish this section, you should understand the following: How to create a 2D Space Object and label it with a Space Tag. How
GIS IN ECOLOGY: ANALYZING RASTER DATA
 GIS IN ECOLOGY: ANALYZING RASTER DATA Contents Introduction... 2 Raster Tools and Functionality... 2 Data Sources... 3 Tasks... 4 Getting Started... 4 Creating Raster Data... 5 Statistics... 8 Surface
The GHG Reservoir Tool (G-res)
") UNESCO/IHA research project on the GHG status of freshwater reservoirs The GHG Reservoir Tool (G-res) User guidelines for the Earth Engine functionality United Nations Educational, Scientific and Cultural
UNESCO/IHA research project on the GHG status of freshwater reservoirs The GHG Reservoir Tool (G-res) User guidelines for the Earth Engine functionality United Nations Educational, Scientific and Cultural
GIS: Introductory Guide to MapPlace. Workshop Agenda. How the Maps Work. Geographic Information Systems. -The MapPlace is a web GIS application
 1 Introductory Guide to MapPlace Workshop 2007 Larry Jones MapPlace & Geoscience Databases Pat Desjardins Corporate GIS Gib McArthur Manager, Resource Information Kirk Hancock MINFILE Geologist Ward Kilby
Soil Map Polk County, Florida
 Soil Map Polk County, Florida 28 9' 21'' 28 8' 23'' 3113000 3113200 3113400 3113600 3113800 3114000 3114200 3114400 3114600 81 51' 19'' 81 51' 19'' 416000 416000 ± 416200 416200 68 416400 68 416400 7 13
Identifying Landslides Using Google Earth
 Identifying Landslides (This draft updated on 1 Dec 2014) Page 1 of 15 1. Introduction Identifying Landslides Using Google Earth 1.1. Workshop Aims 1. Identify landslides from Google Earth images 2. Approximate
Exercise 2: Working with Vector Data in ArcGIS 9.3
 Exercise 2: Working with Vector Data in ArcGIS 9.3 There are several tools in ArcGIS 9.3 used for GIS operations on vector data. In this exercise we will use: Analysis Tools in ArcToolbox Overlay Analysis
WORKING WITH DMTI DIGITAL ELEVATION MODELS (DEM)
") WORKING WITH DMTI DIGITAL ELEVATION MODELS (DEM) Contents (Ctrl-Click to jump to a specific page) Manipulating the DEM Step 1: Finding the DEM Tiles You Need... 2 Step 2: Importing the DEM Tiles into ArcMap...
WORKING WITH DMTI DIGITAL ELEVATION MODELS (DEM) Contents (Ctrl-Click to jump to a specific page) Manipulating the DEM Step 1: Finding the DEM Tiles You Need... 2 Step 2: Importing the DEM Tiles into ArcMap...
ESCI 121 Physical Geology
 Observing Streams & Rivers in Google Earth Dr. Jennifer L. Piatek Dept. of Physics and Earth Sciences Central Connecticut State University 506 Copernicus Hall 1615 Stanley Street New Britain, CT 06050
The WEPP online GIS interface uses the OpenLayers (http://openlayers.org/) software to assist in setting
 software to assist in setting") WEPP Online GIS OpenLayers/Google Maps Interface February 15,2011 Website: http://milford.nserl.purdue.edu/ol/wepp/ The WEPP online GIS interface uses the OpenLayers (http://openlayers.org/) software to
WEPP Online GIS OpenLayers/Google Maps Interface February 15,2011 Website: http://milford.nserl.purdue.edu/ol/wepp/ The WEPP online GIS interface uses the OpenLayers (http://openlayers.org/) software to
Introducing Iowa StreamStats Version 4, a Redesign of the USGS Application for Estimating Streamflow Stats
 Introducing Iowa StreamStats Version 4, a Redesign of the USGS Application for Estimating Streamflow Stats Presented at the 2016 Iowa Water Conference Ames, IA March 24, 2016 by David Eash U.S. Geological
 www.goldensoftware.com Why Create a Thematic Map? A thematic map visually represents the geographic distribution of data. MapViewer will help you to: understand demographics define sales or insurance territories
Using the Stock Hydrology Tools in ArcGIS
 Using the Stock Hydrology Tools in ArcGIS This lab exercise contains a homework assignment, detailed at the bottom, which is due Wednesday, October 6th. Several hydrology tools are part of the basic ArcGIS
Introduction to ArcGIS 10.2
 Introduction to ArcGIS 10.2 Francisco Olivera, Ph.D., P.E. Srikanth Koka Lauren Walker Aishwarya Vijaykumar Keri Clary Department of Civil Engineering April 21, 2014 Contents Brief Overview of ArcGIS 10.2...
Utilizing Data from American FactFinder with TIGER/Line Shapefiles in ArcGIS
 Utilizing Data from American FactFinder with TIGER/Line Shapefiles in ArcGIS Web Adams, GISP Data Dissemination Specialist U.S. Census Bureau New York Regional Office 1 What We Do Decennial Census Every
Building a Hydrologic Base Map Prepared by David R. Maidment Waterways Centre for Freshwater Research University of Canterbury
 Building a Hydrologic Base Map Prepared by David R. Maidment Waterways Centre for Freshwater Research University of Canterbury 14 March 2018 Goals of the Exercise This exercise shows how to develop a hydrologic
Data Structures & Database Queries in GIS
 Data Structures & Database Queries in GIS Objective In this lab we will show you how to use ArcGIS for analysis of digital elevation models (DEM s), in relationship to Rocky Mountain bighorn sheep (Ovis
Space Informatics Lab - University of Cincinnati
 Space Informatics Lab - University of Cincinnati USER GUIDE SocScape V 1.0 September 2014 1. Introduction SocScape (Social Landscape) is a GeoWeb-based tool for exploration of patterns in high resolution
Introduction. Project Summary In 2014 multiple local Otsego county agencies, Otsego County Soil and Water
 Introduction Project Summary In 2014 multiple local Otsego county agencies, Otsego County Soil and Water Conservation District (SWCD), the Otsego County Planning Department (OPD), and the Otsego County
1. Double-click the ArcMap icon on your computer s desktop. 2. When the ArcMap start-up dialog box appears, click An existing map and click OK.
 Module 2, Lesson 1 The earth moves In this activity, you will observe worldwide patterns of seismic activity (earthquakes) and volcanic activity (volcanoes). You will analyze the relationships of those
How to Perform a Site Based Plant Search
 PlantSelector Help Use PlantSelector to get detailed information and photos of plants by: Searching for plants that will grow well at your planting site. How do I do this? OR Searching for plants with
Visual Studies Exercise, Assignment 07 (Architectural Paleontology) Geographic Information Systems (GIS), Part II
 Geographic Information Systems (GIS), Part II") ARCH1291 Visual Studies II Week 8, Spring 2013 Assignment 7 GIS I Prof. Alihan Polat Visual Studies Exercise, Assignment 07 (Architectural Paleontology) Geographic Information Systems (GIS), Part II Medium:
ARCH1291 Visual Studies II Week 8, Spring 2013 Assignment 7 GIS I Prof. Alihan Polat Visual Studies Exercise, Assignment 07 (Architectural Paleontology) Geographic Information Systems (GIS), Part II Medium:
GEOREFERENCING, PROJECTIONS Part I. PRESENTING DATA Part II
 Week 7 GEOREFERENCING, PROJECTIONS Part I PRESENTING DATA Part II topics of the week Georeferencing Coordinate systems Map Projections ArcMap and Projections Geo-referencing Geo-referencing is the process
Adding point data. Account not required
 Adding point data Find patterns in mountains of data You begin to get a strong sense of what maps can do from this lesson. The image shows a total of 58,000 airline routes on one map. The Web Mercator
A Help Guide for Using gssurgo to Find Potential Wetland Soil Landscapes
 A Help Guide for Using gssurgo to Find Potential Wetland Soil Landscapes Wetland Mapping Consortium Webinar September 17, 2014 Dr. John M. Galbraith Crop & Soil Environmental Sciences Virginia Tech Wetland
Hydric Rating by Map Unit Harrison County, Mississippi. Web Soil Survey National Cooperative Soil Survey
 89 9' 7'' W 89 8' 38'' W 30 34' 13'' N 30 33' 57'' N 3383480 3383560 3383640 3383720 3383800 3383880 3383960 293640 293720 293800 293880 293960 294040 294120 294200 294280 294360 3383480 3383560 3383640
Lab 4 -Vector data and Attributes
 Lab 4 -Vector data and Attributes ERSC/BIOL 4421/5421 Name In this lab you will learn how to create your own vector data by collecting point data from GPS coordinates and by digitizing lines using an Aerial
Student Activity Sheet- Denali Topo Map
 Student Activity Sheet- Denali Topo Map Directions: Follow the steps in order and answer the associated questions as you proceed through the activity. The first part of the activity will be guided by your
Introducing IMS. v) Select the Zoom to Full Extent tool. Did you return to the original view?
 Select the Zoom to Full Extent tool. Did you return to the original view?") Ocean/ENVIR 260, Winter 2006 Lab 1, Get to Know the Puget Sound Watershed Name Introducing IMS 1) Open your web browser and navigate to http://128.208.23.127/website/lab1. (This link can be found on the
Ocean/ENVIR 260, Winter 2006 Lab 1, Get to Know the Puget Sound Watershed Name Introducing IMS 1) Open your web browser and navigate to http://128.208.23.127/website/lab1. (This link can be found on the
Flooding on the Somerset Levels. ArcGIS Online
 Flooding on the Somerset Levels ArcGIS Online Using this resource This resource has been written to help teachers make use of the ArcGIS Online program. It provides; guidance on how to use the program
CHARTING THE HEAVENS USING A VIRTUAL PLANETARIUM
 Name Partner(s) Section Date CHARTING THE HEAVENS USING A VIRTUAL PLANETARIUM You have had the opportunity to look at two different tools to display the night sky, the celestial sphere and the star chart.
Automatic Watershed Delineation using ArcSWAT/Arc GIS
 Automatic Watershed Delineation using ArcSWAT/Arc GIS By: - Endager G. and Yalelet.F 1. Watershed Delineation This tool allows the user to delineate sub watersheds based on an automatic procedure using
Welcome to NR502 GIS Applications in Natural Resources. You can take this course for 1 or 2 credits. There is also an option for 3 credits.
 Welcome to NR502 GIS Applications in Natural Resources. You can take this course for 1 or 2 credits. There is also an option for 3 credits. The 1st credit consists of a series of readings, demonstration,
Hydric Rating by Map Unit Harrison County, Mississippi
 89 6' 12'' W 89 5' 54'' W 30 28' 47'' N 30 28' 26'' N 3373210 3373290 3373370 3373450 3373530 3373610 3373690 3373770 3373850 298080 298160 298240 298320 298400 298480 298560 30 28' 47'' N Soil Map may
Electric Fields and Equipotentials
 OBJECTIVE Electric Fields and Equipotentials To study and describe the two-dimensional electric field. To map the location of the equipotential surfaces around charged electrodes. To study the relationship
Within this document, the term NHDPlus is used when referring to NHDPlus Version 2.1 (unless otherwise noted).
.") Exercise 7 Watershed Delineation Using ArcGIS Spatial Analyst Last Updated 4/6/2017 Within this document, the term NHDPlus is used when referring to NHDPlus Version 2.1 (unless otherwise noted). There
Exercise 7 Watershed Delineation Using ArcGIS Spatial Analyst Last Updated 4/6/2017 Within this document, the term NHDPlus is used when referring to NHDPlus Version 2.1 (unless otherwise noted). There
Write a report (6-7 pages, double space) on some examples of Internet Applications. You can choose only ONE of the following application areas:
 on some examples of Internet Applications. You can choose only ONE of the following application areas:") UPR 6905 Internet GIS Homework 1 Yong Hong Guo September 9, 2008 Write a report (6-7 pages, double space) on some examples of Internet Applications. You can choose only ONE of the following application
UPR 6905 Internet GIS Homework 1 Yong Hong Guo September 9, 2008 Write a report (6-7 pages, double space) on some examples of Internet Applications. You can choose only ONE of the following application
Soil Map Boulder County Area, Colorado (Planet Blue Grass) Web Soil Survey National Cooperative Soil Survey
 Web Soil Survey National Cooperative Soil Survey") 475910 476000 476090 476180 476270 476360 105 16' 21'' W 476450 476540 476630 476720 476810 4453350 4453440 4453260 4453350 4453170 4453260 4453080 4453170 4453080 475820 475910 4452990 476000 476090 476180
475910 476000 476090 476180 476270 476360 105 16' 21'' W 476450 476540 476630 476720 476810 4453350 4453440 4453260 4453350 4453170 4453260 4453080 4453170 4453080 475820 475910 4452990 476000 476090 476180
Modeling Incident Density with Contours in ArcGIS Pro
 Modeling Incident Density with Contours in ArcGIS Pro By Mike Price, Entrada/San Juan, Inc. What you will need ArcGIS Pro 1.4 license or later ArcGIS Spatial Analyst license ArcGIS Online for organizational
WlLPEN L. GORR KRISTEN S. KURLAND. Universitats- und Landesbibliothek. Bibliothek Architektur und Stadtebau ESRI
 hj WlLPEN L. GORR KRISTEN S. KURLAND Universitats- und Landesbibliothek Darmstadt Bibliothek Architektur und Stadtebau ESRI Contents Acknowledgments Preface xvii XV GIS Tutorial 1 Introduction Launch ArcMap
Using Web GIS to Build Consensus and Combat Wildland Fire Threats
 Using Web GIS to Build Consensus and Combat Wildland Fire Threats By Mike Price, Entrada/San Juan, Inc. What You Will Need ArcGIS 10.3 for Desktop (any license level) An ArcGIS Online account (one comes
Session Objectives. Learn how to: Bring georeferenced aerial imagery into Civil 3D. Connect to and import GIS data using various tools and techniques.
 GIS into Civil 3D Data 70th Annual Wisconsin Society of Land Surveyors' Institute January 24, 2019 1 Learn how to: Session Objectives Bring georeferenced aerial imagery into Civil 3D. Connect to and import
Nested Frequency Plot Sample Design and Field Methods for Vegetation Monitoring
 1 Nested Frequency Plot Sample Design and Field Methods for Vegetation Monitoring Materials Plot frame Map of site showing boundaries and sampling point locations Compass GPS pre-loaded with sample points
Hydric Rating by Map Unit Ocean County, New Jersey (Larsen & N New Prospect Jackson Twp., NJ)
") 74 16' 14'' W Hydric Rating by Map Unit Ocean County, New Jersey ( ) 74 15' 50'' W 40 9' 17'' N 40 8' 53'' N 4444460 4444550 4444640 4444730 4444820 4444910 4445000 4445090 4445180 562120 562210 562300
74 16' 14'' W Hydric Rating by Map Unit Ocean County, New Jersey ( ) 74 15' 50'' W 40 9' 17'' N 40 8' 53'' N 4444460 4444550 4444640 4444730 4444820 4444910 4445000 4445090 4445180 562120 562210 562300
Tutorial 23 Back Analysis of Material Properties
 Tutorial 23 Back Analysis of Material Properties slope with known failure surface sensitivity analysis probabilistic analysis back analysis of material strength Introduction Model This tutorial will demonstrate
Lab 1: Landuse and Hydrology, learning ArcGIS II. MANIPULATING DATA
 Lab 1: Landuse and Hydrology, learning ArcGIS II. MANIPULATING DATA As you experienced in the first lab session when you created a hillshade, high resolution data can be unwieldy if you are trying to perform
DGS Digital Geologic Information Resource (DGIR) User Guide
 User Guide") DGS Digital Geologic Information Resource (DGIR) User Guide Developed by the Delaware Geological Survey. Revised January 2012. TABLE OF CONTENTS I. INTRODUCTION II. DGIR LAYOUT III. TOOLBARS IV. USING
DGS Digital Geologic Information Resource (DGIR) User Guide Developed by the Delaware Geological Survey. Revised January 2012. TABLE OF CONTENTS I. INTRODUCTION II. DGIR LAYOUT III. TOOLBARS IV. USING