Conservation Applications of LiDAR Data
|
|
|
- Morgan Barker
- 6 years ago
- Views:
Transcription


1 Program: Funding: Conservation Applications of LiDAR Data Environment and Natural Resources Trust Fund Module: Instructor: Exercise: Hydrologic Applications Sean Vaughn, DNR GIS Hydrologist (Funded by the Clean Water Fund) DEM Display Objectives Learn the basics of setting Environment Settings to control raster analysis and processing outputs. Demonstrate methods to display a DEM and associated raster products for the purpose of hydrography identification and delineation. Page 1 of 21
2 ArcMap Setup The set up of ArcMap with the proper toolbars, extensions, and environmental settings is critical for this exercise. In addition to using the functionality of these various ArcMap capabilities we want you to understand how to: locate, load, and setup these toolbars, extensions, and environmental settings. You can retain these instructions for future reference. 1. Open your GIS software. Start by opening ArcMap. 2. Load the Base DEM. Using ArcMap or ArcCatalog (your preference), load a base Digital Elevation Model (DEM) into the ArcMap Table of Contents. Page 2 of 21


3 3. Load ArcMap Extensions. In ArcMap, load the Spatial Analyst and 3D Analyst Extensions. Customize Extensions Note: Depending on the setup of your machine or prior use and instruction, these extensions may already be loaded for you. 4. Setup the Environment Settings at the Application Level. Discussion: Application environment settings are the system wide default setting that are used by every tool. a. Open the Environment Settings one of two ways. 1.) Right Click in the Toolbox, Click on Environments or 2.) From the Geoprocessing dropdown menu, Click Environments. OR Discussion: It s good data management to get in the habit of working with and setting the Environment Settings. This is especially true when working with raster data. As demonstrated in the course lecture it is important to ensure the output raster data you generate match up with your source/input grids. It should be noted that the Environment Settings are not exclusive to raster data. Simply setting your Workspace will ensure all your output data (vector and raster) is sent to a location where you can find them. Consequently, we start you out using the Environment Settings right from the beginning of your training. Page 3 of 21

4 There are four levels of Environment Settings that form a hierarchy: 1. application, 2. tool, 3. model, and 4. model process. In this hierarchy, all levels contain the same environment variables and have the same effect on output results. The levels differ only in how you access and set them. However, Environment Settings are passed down to the next level. These passed down Environment Settings can be overridden at each succeeding level. We feel more comfortable establishing the Environment Settings at the tool level even if previously set at the application level. However, for the following steps in this exercise you will be asked to set the Environment Settings at both the application and tool levels. b. Under the Workspace Tab, set Current Workspace to: Location: %root folder% :\dem_display_data. c. Under the General Settings Tab, set Scratch Workspace Location: %root folder%:\dem_display_scratch. Discussion: If the Current Workspace is set, tools will look for their inputs in this workspace and you can enter inputs for tools using just the name rather than the full pathname. Furthermore, output will be written to the current workspace, you should always check where tool output is being written. Nothing is more frustrating than to run a tool and forget or not know where the output was written. After you've run a tool, you may find that output isn't output to where you expect perhaps you made a mistake when entering the output name, or you've just forgotten where it was written. If this is the case, open the Results window; it will contain a record of the tool you've run along with its input and output datasets which will include the directory path structure. d. Set Output Coordinate System to (in this example, dem03 ). e. Set the Extent and Snap Raster to the name of your DEM layer. Page 4 of 21


5 Discussion: The Snap Raster setting is what ensures your output raster will snap or mesh with your input raster. Note: The Extent will state As Specified Below the next time you open the Environment Settings. f. Set the Raster Analysis Settings to dem03. Page 5 of 21

6 5. Add the Land Facet Analysis Tool Bar. a. Customize Toolbars Land Facet Analysis 6. Save/Save As your ArcMap project to DEM_display Name: DEM_display Location: %root folder%:\dem_display_project Page 6 of 21
![Hill Shade 1. Create a Hillshade raster of the base DEM [dem03, in this example] using the Spatial Analyst Tools. a. Select the Hillshade Tool from the Surface Toolbox menu (supporting graphic below).](/docs-images/75/72191792/images/7-1.jpg "ArcToolbox Spatial Analyst Tools Surface Hillshade b. Select the base DEM (dem03) from the dropdown menu or browse button. c. Accept the defaults for Azimuth and Altitude. d. Ensure the Z factor is 1 because our x,y and z values are all in meters.")
7 Hill Shade 1. Create a Hillshade raster of the base DEM [dem03, in this example] using the Spatial Analyst Tools. a. Select the Hillshade Tool from the Surface Toolbox menu (supporting graphic below). ArcToolbox Spatial Analyst Tools Surface Hillshade b. Select the base DEM (dem03) from the dropdown menu or browse button. c. Accept the defaults for Azimuth and Altitude. d. Ensure the Z factor is 1 because our x,y and z values are all in meters. e. Name the raster: dem03_hlshd (supporting graphic below). Name: dem03_hlshd Location: %root folder%:\dem_display_scratch\dem03_hlshd Note: Why does the value of sometimes show up which is different from the default of 1? This often happens when you have saved an MXD that had previously used a tool that required (or it was by accident) a Z factor conversion between feet and meters. If the x,y units and z units are in the same units of measure, the z factor is 1. This is the ESRI ArcGIS default (not always). If the x,y units and z units are in different units of measure, the z factor must be set to the appropriate factor, or the results will be incorrect. For example, if your z units are feet and your x,y units are meters, you would use a z factor of to convert your z units from feet to meters (1 foot = meter). Page 7 of 21
 Contrast: = 0% (default) Brightness: = 0% (default) Transparency = 0% (default) Symbology Tab Show: =")
8 2. Set Display and Symbology for the new dem03_hlshd raster with the settings defined in the grey box below. Display Tab Resample during display using: = Bilinear Interpolation (for continuous data) Contrast: = 0% (default) Brightness: = 0% (default) Transparency = 0% (default) Symbology Tab Show: = Stretched (default) Color Ramp: = gray scale (default) Stretch Type: = Standard Deviations, n: = 2 (default) Statistics: = From Current Display Extent Note: Examples of Display and Symbology Window Tabs in images below. 3. Now that you have created the Hillshade raster (dem03_hlshd), move it under dem03 in the table of contents. 4. Set the Display and Symbology for dem03 you loaded earlier using the following criteria. Display Tab Resample during display using: = Bilinear Interpolation (for continuous data) Contrast: = 0% (default) Brightness: = 0% (default) Transparency = 55% Symbology Tab Show: = Stretched (default) Color Ramp: = {your choice} Stretch Type: = Standard Deviations, n: = 2 (default) Statistics: = From Current Display Extent Page 8 of 21

9 Note: What you are doing is seeing through the DEM with the shaded signatures of the Hillshade influencing the visual perspective of the DEM. Some people prefer to make the Hillshade transparent and place it over the DEM. 5. Take a minute to pan around and zoom in to get familiar with the data, the display settings, and the geographic setting of the exercise area. Notice that it is hard to explicitly define the location of watercourses. Unfortunately you can t spend too much time playing with this amazing data because you have more to do ahead 6. Load an aerial image for the same area you have been working in. It should load into the Table of Contents above the raster dem03. Location: %root folder%:\dem_display\dem_display_image Aerial images: Digital orthophoto quadrangles (DOQs) are aerial photographs corrected to align with the geographic grid. Air photos are available from MnGeo at In the Popular Resources section, click on Air Photos > FSA Photos, select the most recent year, and either download the file for your county or click on WMS service to learn how to connect to the aerial photos without downloading them to your computer. Page 9 of 21


10 7. Turn the DOQ on and off repeatedly to see how the topography looks without the hill shaded DEM. Take a moment to toggle back and forth to see how much topography is visible in the DEM compared to what the high quality DOQ offers. 8. Turn off dem In the Table of Contents Move the DOQ under dem03_hlshd in the Table of Contents and set dem03_hlshd to 60% Transparent. Page 10 of 21
11 Discussion: By placing the DOQ under the hillshade raster (dem03_hlshd) with a high transparency set on the raster, we can give the depth of topography to the image and the signatures of features from the DOQ to the topography of the DEM (raster). Pay particular attention to the water conveyance features which show up very well with this combination. However, do they exhibit signatures suitable for accurate delineation and digitization? As far as hydrography is concerned, we can do better to increase the visualization and interpretation of the hydrography This creates some exciting results but don t get wrapped up in all the splendor, there is more work ahead. 10. Turn off the DOQ. 11. Change the Transparency of the Hillshade raster (dem03_hlshd) back to 0%. 12. Change the Display and Symbology for dem03 a. Change the settings for dem03 to the values below. Display Tab Resample during display using: = Bilinear Interpolation (for continuous data) Contrast: = 70% Brightness: = 30% (negative thirty) Transparency = 40% Symbology Tab Show: = Stretched Color Ramp: = Yellow to Dark Red (5 th color ramp up from the bottom) Invert = Checked (on) Stretch Type: = Standard Deviations, n: = 2 Statistics: = From Current Display Extent Page 11 of 21


12 Note: You can ensure you are using the correct Color Ramp by right mouse clicking on the color ramp and selecting Save to style Fire symbology defined DEMcolor. Discussion: I call this raster symbology Fire. The goal of this color ramp and settings is to put the darkest colors into the lowest features, attempting to highlight the hydrography of the landscape. The hope is to make the bottoms of watercourses black when you zoom in. 13. Save your ArcMap project. Page 12 of 21


13 TPI Raster Creation We will now explore a method of indentifying the hydrography in the DEM with more intensity and definition using a special output raster with simple display and symbology settings. We will do this through a multistep process using a free ArcMap Toolbox called Land Facet Corridor Tools. From that extension we will employ the Land Facet Analysis tool which contains the Topographic Position Index (TPI) functionality. TPI Topographic Position Index TPI is the difference between a cell s elevation value and the average elevation of the neighborhood around that cell. TPI is a simplification of the Landscape Position Index described by Fels and Zobel (1995) and was developed in detail by Weiss (2001). Fels, J.E. and R. Zobel, Landscape position and classified landtype mapping for statewide DRASTIC mapping project. North Carolina State University Technical Report. Different Neighborhood settings (circle, rectangle, annulus) produce different results that may or may not be helpful. Users of TPI are encouraged to experiment to identify which settings are most useful for their task. Positive values mean the cell is higher than its surroundings while Negative values mean it is lower. 1. Make a Topographic Index Raster. Open the Land Facet Analysis Toolbar Topographic Position Index Tools Calculate TPI Raster. Toolbar Menu Appearance as a docked Tool Bar Appearance as a floating Tool Bar a. Create a Topographic Position Index (TPI) raster from dem03 with these settings (supporting graphics below or on next page). Input elevation raster: = dem03 Neighborhood (optional): = Circle Neighborhood Settings: Radius = 3 Units: = Cell TPI Raster: = TPI_cir3 Page 13 of 21
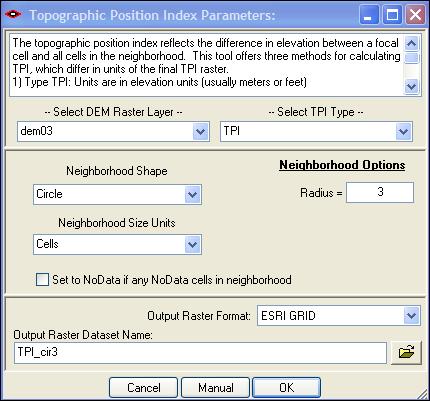
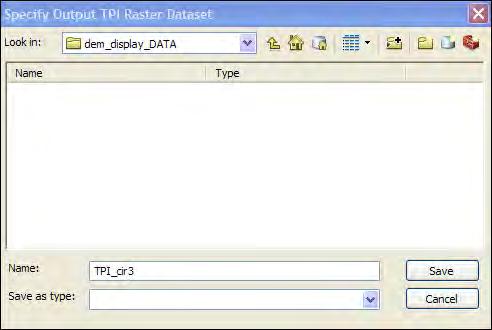
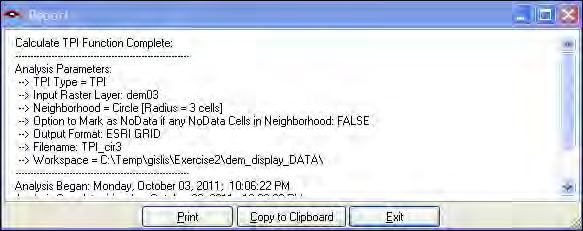
14 Name: TPI_cir3 Location: %root folder%:\dem_display_data\tpi_cir3 2. Check to see if TPI_cir3 loaded into your table of contents (supporting graphics below or on next page). Page 14 of 21

 Contrast: = 0% Brightness: =")

15 Discussion / Review: A TPI raster represents the difference between a cell elevation value and the average elevation of the neighborhood around that cell. 3. Change the Display and Symbology for TPI_cir3 Display Tab Resample during display using: = Bilinear Interpolation (for continuous data) Contrast: = 0% Brightness: = 0% Transparency = 0% Symbology Tab Show: = Stretched Color Ramp: = Gray Scale Stretch Type: = Standard Deviations, n: = 2 Statistics: = From Current Display Extent Page 15 of 21


16 Discussion: We have used a freely available proprietary Creative Commons Tool to generate our TPI for this exercise. You could use the Spatial Analyst Focal Statistics tool and the Raster Calculator to accomplish the same thing. Using Model Builder it would look like the model below. 4. Take a moment to pan around and explore the TPI raster. Discussion: Notice how we can now see the sides of the ditches and other features on the landscape that convey water. Now with the influences of oblique shading removed a technician can digitize hydrography with more certainty resulting in a more accurate placement of the geometry representing these features. 5. Save your ArcMap project. Page 16 of 21

 Contrast: = 0% Brightness:")

17 1. In your table of contents Turn off dem03. TPI Raster Integration 2. Turn on dem03_hlshd. a. Ensure the Display for dem03_hlshd is set to 0% transparency. 3. Change the Display and Symbology again for TPI_cir3 to: Display Tab Resample during display using: = Bilinear Interpolation (for continuous data) Contrast: = 0% Brightness: = 0% Transparency = 50% Symbology Tab Show: = Stretched Color Ramp: = Gray Scale Stretch Type: = Standard Deviations, n: = 2 Statistics: = From Current Display Extent a. Zoom in on TPI_cir3 Page 17 of 21
![Discussion: Notice how the TPI raster [TPI_cir3] defines the hydrography in the Hillshade [dem03_hlshd].](/docs-images/75/72191792/images/18-0.jpg "The TPI raster tightly defines the water conveyance features while the hillshade introduces elevation. 4.")

 Transparency = 30% Symbology Tab Show: = Stretched Color Ramp: = Yellow to Dark Red (5 th ramp up from")
18 Discussion: Notice how the TPI raster [TPI_cir3] defines the hydrography in the Hillshade [dem03_hlshd]. The TPI raster tightly defines the water conveyance features while the hillshade introduces elevation. 4. Change the Display and Symbology for TPI_cir3 to the Fire symbol set you set earlier. Note: This is the same color scheme you set up for dem03 earlier. Display Tab Resample during display using: Contrast: = 70% = Bilinear Interpolation (for continuous data) Brightness: = 30% (negative thirty) Transparency = 30% Symbology Tab Show: = Stretched Color Ramp: = Yellow to Dark Red (5 th ramp up from the bottom) Invert = Check (on) Stretch Type: = Standard Deviations, n: = 2 Statistics: = From Current Display Extent Page 18 of 21


19 Discussion: When you are working in areas with minimal elevation changes, as in the examples shown here, the roads and ditch banks pop with this Fire color scheme, making for easy interpretation of the features that convey water on the landscape. Like our earlier TPI illustration, the technician only needs to concentrate on the features in black for digitizing the hydrography, resulting in a more accurate final digitized product. 5. You should now have dem03_hlshd turned on and under the TPI_cir3 raster in the Table of Contents. Discussion / Review: We have now added a slight amount of visual relief to the TPI with the hillshaded DEM which can aid the technician in hydrography identification and the delineation of those features. Incorporating the relief and contours is also beneficial for determining directionality of most water conveyance features. Notice how many water conveyance loops there are on the landscape because of excavation on the landscape. Compare the effectiveness of the TPI with relief to just the DOQ. Not so long ago we were quite satisfied with what the DOQs provided us. 6. Save your ArcMap project. 7. Add the Effects Tool Bar (if it s not already loaded). a. Customize Toolbars Effects Page 19 of 21

20 8. Use the Swipe Layer from the Effects Tool bar to see how the TPI raster lines up with the original DEM and the DOQ. 9. Explore the raster s in your view to see how you could use TPI for results verification on other projects you are involved in. 10. Save your project. END Discussion: TPI Evolution and Availability Andrew Weiss First presented at the 2001 ESRI International User Conference. Weiss, A., Topographic position and landforms analysis. Poster Presentation, ESRI User Conference, San Diego, CA. Jeff Jenness, Wildlife Biologist, GIS Analyst, Jenness Enterprises/CorridorDesign. Originally wrote the code in Avenue for ArcView 3.3. Jenness, J., Topographic Position Index (tpi_jen.avx) Extension for ArcView 3.x. Jenness Enterprises. Available for ArcGIS 10 at: Thomas Dilts, Research Scientist, University of Nevada, Reno. Migrated the TPI functionality to an ArcGIS toolbox. Available for ArcGIS 9.x at: Page 20 of 21
 A 1 x 1 rectangle using cell units. a. Does the representation of water conveyance features tighten up or get larger for each? 2. Use the DOQ for your comparison. 3.")
21 Note: The Land Facet Corridor Designer can be downloaded at: Extra Time Project: 1. Create a TPI on dem03 for 1.) A 3 x 3 Rectangle, using cell units 2.) A 1 x 1 rectangle using cell units. a. Does the representation of water conveyance features tighten up or get larger for each? 2. Use the DOQ for your comparison. 3. What do you think the results would be if we made TPI raster s using the 1 meter DEM (dem01)? Document version: June 2013 Page 21 of 21
The Geodatabase Working with Spatial Analyst. Calculating Elevation and Slope Values for Forested Roads, Streams, and Stands.
 GIS LAB 7 The Geodatabase Working with Spatial Analyst. Calculating Elevation and Slope Values for Forested Roads, Streams, and Stands. This lab will ask you to work with the Spatial Analyst extension.
Tutorial 8 Raster Data Analysis
 Objectives Tutorial 8 Raster Data Analysis This tutorial is designed to introduce you to a basic set of raster-based analyses including: 1. Displaying Digital Elevation Model (DEM) 2. Slope calculations
Watershed Delineation
 Watershed Delineation Jessica L. Watkins, University of Georgia 2 April 2009 Updated by KC Love February 25, 2011 PURPOSE For this project, I delineated watersheds for the Coweeta synoptic sampling area
GIS IN ECOLOGY: ANALYZING RASTER DATA
 GIS IN ECOLOGY: ANALYZING RASTER DATA Contents Introduction... 2 Raster Tools and Functionality... 2 Data Sources... 3 Tasks... 4 Getting Started... 4 Creating Raster Data... 5 Statistics... 8 Surface
Task 1: Open ArcMap and activate the Spatial Analyst extension.
 Exercise 10 Spatial Analyst The following steps describe the general process that you will follow to complete the exercise. Specific steps will be provided later in the step-by-step instructions component
Lab 7: Cell, Neighborhood, and Zonal Statistics
 Lab 7: Cell, Neighborhood, and Zonal Statistics Exercise 1: Use the Cell Statistics function to detect change In this exercise, you will use the Spatial Analyst Cell Statistics function to compare the
NR402 GIS Applications in Natural Resources
 NR402 GIS Applications in Natural Resources Lesson 1 Introduction to GIS Eva Strand, University of Idaho Map of the Pacific Northwest from http://www.or.blm.gov/gis/ Welcome to NR402 GIS Applications in
Spatial Analyst: Multiple Criteria Evaluation Material adapted from FOR 4114 developed by Forestry Associate Professor Steve Prisley
 Spatial Analyst: Multiple Criteria Evaluation Material adapted from FOR 4114 developed by Forestry Associate Professor Steve Prisley Section 1: Data In this exercise we will be working with several types
GIS Workshop UCLS_Fall Forum 2014 Sowmya Selvarajan, PhD TABLE OF CONTENTS
 TABLE OF CONTENTS TITLE PAGE NO. 1. ArcGIS Basics I 2 a. Open and Save a Map Document 2 b. Work with Map Layers 2 c. Navigate in a Map Document 4 d. Measure Distances 4 2. ArcGIS Basics II 5 a. Work with
Spatial Data Analysis in Archaeology Anthropology 589b. Kriging Artifact Density Surfaces in ArcGIS
 Spatial Data Analysis in Archaeology Anthropology 589b Fraser D. Neiman University of Virginia 2.19.07 Spring 2007 Kriging Artifact Density Surfaces in ArcGIS 1. The ingredients. -A data file -- in.dbf
WORKING WITH DMTI DIGITAL ELEVATION MODELS (DEM)
") WORKING WITH DMTI DIGITAL ELEVATION MODELS (DEM) Contents (Ctrl-Click to jump to a specific page) Manipulating the DEM Step 1: Finding the DEM Tiles You Need... 2 Step 2: Importing the DEM Tiles into ArcMap...
WORKING WITH DMTI DIGITAL ELEVATION MODELS (DEM) Contents (Ctrl-Click to jump to a specific page) Manipulating the DEM Step 1: Finding the DEM Tiles You Need... 2 Step 2: Importing the DEM Tiles into ArcMap...
Watershed Modeling Orange County Hydrology Using GIS Data
 v. 10.0 WMS 10.0 Tutorial Watershed Modeling Orange County Hydrology Using GIS Data Learn how to delineate sub-basins and compute soil losses for Orange County (California) hydrologic modeling Objectives
Data Structures & Database Queries in GIS
 Data Structures & Database Queries in GIS Objective In this lab we will show you how to use ArcGIS for analysis of digital elevation models (DEM s), in relationship to Rocky Mountain bighorn sheep (Ovis
How to Create Stream Networks using DEM and TauDEM
 How to Create Stream Networks using DEM and TauDEM Take note: These procedures do not describe all steps. Knowledge of ArcGIS, DEMs, and TauDEM is required. TauDEM software ( http://hydrology.neng.usu.edu/taudem/
GIS IN ECOLOGY: ANALYZING RASTER DATA
 GIS IN ECOLOGY: ANALYZING RASTER DATA Contents Introduction... 2 Tools and Functionality for Raster Data... 2 Data Sources... 3 Tasks... 4 Getting Started... 4 Creating Raster Data... 5 Summary Statistics...
In this exercise we will learn how to use the analysis tools in ArcGIS with vector and raster data to further examine potential building sites.
 GIS Level 2 In the Introduction to GIS workshop we filtered data and visually examined it to determine where to potentially build a new mixed use facility. In order to get a low interest loan, the building
Automatic Watershed Delineation using ArcSWAT/Arc GIS
 Automatic Watershed Delineation using ArcSWAT/Arc GIS By: - Endager G. and Yalelet.F 1. Watershed Delineation This tool allows the user to delineate sub watersheds based on an automatic procedure using
Exercise 6: Working with Raster Data in ArcGIS 9.3
 Exercise 6: Working with Raster Data in ArcGIS 9.3 Why Spatial Analyst? Grid query Grid algebra Grid statistics Summary by zone Proximity mapping Reclassification Histograms Surface analysis Slope, aspect,
Lab 1: Landuse and Hydrology, learning ArcGIS II. MANIPULATING DATA
 Lab 1: Landuse and Hydrology, learning ArcGIS II. MANIPULATING DATA As you experienced in the first lab session when you created a hillshade, high resolution data can be unwieldy if you are trying to perform
Using Earthscope and B4 LiDAR data to analyze Southern California s active faults
 Using Earthscope and B4 LiDAR data to analyze Southern California s active faults Exercise 8: Simple landscape morphometry and stream network delineation Introduction This exercise covers sample activities
(THIS IS AN OPTIONAL BUT WORTHWHILE EXERCISE)
") PART 2: Analysis in ArcGIS (THIS IS AN OPTIONAL BUT WORTHWHILE EXERCISE) Step 1: Start ArcCatalog and open a geodatabase If you have a shortcut icon for ArcCatalog on your desktop, double-click it to start
PART 2: Analysis in ArcGIS (THIS IS AN OPTIONAL BUT WORTHWHILE EXERCISE) Step 1: Start ArcCatalog and open a geodatabase If you have a shortcut icon for ArcCatalog on your desktop, double-click it to start
Global Atmospheric Circulation Patterns Analyzing TRMM data Background Objectives: Overview of Tasks must read Turn in Step 1.
 Global Atmospheric Circulation Patterns Analyzing TRMM data Eugenio Arima arima@hws.edu Hobart and William Smith Colleges Department of Environmental Studies Background: Have you ever wondered why rainforests
Determining the Location of the Simav Fault
 Lindsey German May 3, 2012 Determining the Location of the Simav Fault 1. Introduction and Problem Formulation: The issue I will be focusing on involves interpreting the location of the Simav fault in
Handling Raster Data for Hydrologic Applications
 Handling Raster Data for Hydrologic Applications Prepared by Venkatesh Merwade Lyles School of Civil Engineering, Purdue University vmerwade@purdue.edu January 2018 Objective The objective of this exercise
IMPERIAL COUNTY PLANNING AND DEVELOPMENT
 IMPERIAL COUNTY PLANNING AND DEVELOPMENT GEODATABASE USER MANUAL FOR COUNTY BUSINESS DEVELOPMENT GIS June 2010 Prepared for: Prepared by: County of Imperial Planning and Development 801 Main Street El
Creating Watersheds from a DEM
 Creating Watersheds from a DEM These instructions enable you to create watersheds of specified area using a good quality Digital Elevation Model (DEM) in ArcGIS 8.1. The modeling is performed in ArcMap
Welcome to NR502 GIS Applications in Natural Resources. You can take this course for 1 or 2 credits. There is also an option for 3 credits.
 Welcome to NR502 GIS Applications in Natural Resources. You can take this course for 1 or 2 credits. There is also an option for 3 credits. The 1st credit consists of a series of readings, demonstration,
Environmental Systems Research Institute
 Introduction to ArcGIS ESRI Environmental Systems Research Institute Redlands, California 2 ESRI GIS Development Arc/Info (coverage model) Versions 1-7 from 1980 1999 Arc Macro Language (AML) ArcView (shapefile
ISU GIS CENTER S ARCSDE USER'S GUIDE AND DATA CATALOG
 ISU GIS CENTER S ARCSDE USER'S GUIDE AND DATA CATALOG 2 TABLE OF CONTENTS 1) INTRODUCTION TO ARCSDE............. 3 2) CONNECTING TO ARCSDE.............. 5 3) ARCSDE LAYERS...................... 9 4) LAYER
Working with ArcGIS: Classification
 Working with ArcGIS: Classification 2 Abbreviations D-click R-click TOC Double Click Right Click Table of Content Introduction The benefit from the use of geographic information system (GIS) software is
Delineation of Watersheds
 Delineation of Watersheds Adirondack Park, New York by Introduction Problem Watershed boundaries are increasingly being used in land and water management, separating the direction of water flow such that
Within this document, the term NHDPlus is used when referring to NHDPlus Version 2.1 (unless otherwise noted).
.") Exercise 7 Watershed Delineation Using ArcGIS Spatial Analyst Last Updated 4/6/2017 Within this document, the term NHDPlus is used when referring to NHDPlus Version 2.1 (unless otherwise noted). There
Exercise 7 Watershed Delineation Using ArcGIS Spatial Analyst Last Updated 4/6/2017 Within this document, the term NHDPlus is used when referring to NHDPlus Version 2.1 (unless otherwise noted). There
Using the Stock Hydrology Tools in ArcGIS
 Using the Stock Hydrology Tools in ArcGIS This lab exercise contains a homework assignment, detailed at the bottom, which is due Wednesday, October 6th. Several hydrology tools are part of the basic ArcGIS
Learning ArcGIS: Introduction to ArcCatalog 10.1
 Learning ArcGIS: Introduction to ArcCatalog 10.1 Estimated Time: 1 Hour Information systems help us to manage what we know by making it easier to organize, access, manipulate, and apply knowledge to the
Outline. Chapter 1. A history of products. What is ArcGIS? What is GIS? Some GIS applications Introducing the ArcGIS products How does GIS work?
 Outline Chapter 1 Introducing ArcGIS What is GIS? Some GIS applications Introducing the ArcGIS products How does GIS work? Basic data formats The ArcCatalog interface 1-1 1-2 A history of products Arc/Info
Working with Digital Elevation Models and Spot Heights in ArcMap
 Working with Digital Elevation Models and Spot Heights in ArcMap 10.3.1 1 TABLE OF CONTENTS INTRODUCTION... 3 WORKING WITH SPOT HEIGHTS FROM NRVIS, CITY OF KITCHENER, AND CITY OF TORONTO...4 WORKING WITH
MERGING (MERGE / MOSAIC) GEOSPATIAL DATA
 GEOSPATIAL DATA") This help guide describes how to merge two or more feature classes (vector) or rasters into one single feature class or raster dataset. The Merge Tool The Merge Tool combines input features from input
This help guide describes how to merge two or more feature classes (vector) or rasters into one single feature class or raster dataset. The Merge Tool The Merge Tool combines input features from input
GIS Topographic Wetness Index (TWI) Exercise Steps
 Exercise Steps") GIS Topographic Wetness Index (TWI) Exercise Steps October 2016 Jeffrey L. Zimmerman, Jr. GIS Analyst James P. Shallenberger Manager, Monitoring & Protection Susquehanna River Basin Commission Table of
GIS Topographic Wetness Index (TWI) Exercise Steps October 2016 Jeffrey L. Zimmerman, Jr. GIS Analyst James P. Shallenberger Manager, Monitoring & Protection Susquehanna River Basin Commission Table of
Working with Digital Elevation Models in ArcGIS 8.3
 Working with Digital Elevation Models in ArcGIS 8.3 The homework that you need to turn in is found at the end of this document. This lab continues your introduction to using the Spatial Analyst Extension
How to Construct Urban Three Dimensional GIS Model based on ArcView 3D Analysis
 How to Construct Urban Three Dimensional GIS Model based on ArcView 3D Analysis Ko Ko Lwin Division of Spatial Information Science Graduate School of Life and Environmental Sciences University of Tsukuba
Working with Digital Elevation Models and Digital Terrain Models in ArcMap 9
 Working with Digital Elevation Models and Digital Terrain Models in ArcMap 9 1 TABLE OF CONTENTS INTRODUCTION...3 WORKING WITH DIGITAL TERRAIN MODEL (DTM) DATA FROM NRVIS, CITY OF KITCHENER, AND CITY OF
Creating Watersheds from a DEM in ArcGIS 9.x
 Creating Watersheds from a DEM in ArcGIS 9.x These instructions enable you to create watersheds (a.k.a. catchments or basins) using a good quality Digital Elevation Model (DEM) in ArcGIS 9.1. The modeling
How to Convert USGS Topographic GeoPDF 1 Maps to GeoTIFF using ArcGIS 10.4
 How to Convert USGS Topographic GeoPDF 1 Maps to GeoTIFF using ArcGIS 10.4 This tutorial assumes that you have: 1) downloaded some USGS geopdfs, 2) a pdf reader such as Adobe Acrobat, and 3) ArcGIS 10.4
2G1/3G4 GIS TUTORIAL >>>>>>>>>>>>>>>>>>>>>>>>>>>>>>>>>>>>>>>>>>>>>>>>>>>>>>>>>>>>>>>>>>>>>>>>>>>>>>>>
 > University of Michigan >Taubman College of Architecture > ARCH 552, Perimeter @ Work Out [T]here, Fall 2009 >September 24, 2009 2G1/3G4 GIS TUTORIAL >>>>>>>>>>>>>>>>>>>>>>>>>>>>>>>>>>>>>>>>>>>>>>>>>>>>>>>>>>>>>>>>>>>>>>>>>>>>>>>>
GEOREFERENCING, PROJECTIONS Part I. PRESENTING DATA Part II
 Week 7 GEOREFERENCING, PROJECTIONS Part I PRESENTING DATA Part II topics of the week Georeferencing Coordinate systems Map Projections ArcMap and Projections Geo-referencing Geo-referencing is the process
Popular Mechanics, 1954
 Introduction to GIS Popular Mechanics, 1954 1986 $2,599 1 MB of RAM 2017, $750, 128 GB memory, 2 GB of RAM Computing power has increased exponentially over the past 30 years, Allowing the existence of
GIS Boot Camp for Education June th, 2011 Day 1. Instructor: Sabah Jabbouri Phone: (253) x 4854 Office: TC 136
 x 4854 Office: TC 136") GIS Boot Camp for Education June 27-30 th, 2011 Day 1 Instructor: Sabah Jabbouri Phone: (253) 833-9111 x 4854 Office: TC 136 Email: sjabbouri@greenriver.edu http://www.instruction.greenriver.edu/gis/ Summer
GIS Boot Camp for Education June 27-30 th, 2011 Day 1 Instructor: Sabah Jabbouri Phone: (253) 833-9111 x 4854 Office: TC 136 Email: sjabbouri@greenriver.edu http://www.instruction.greenriver.edu/gis/ Summer
Lecture 9: Reference Maps & Aerial Photography
 Lecture 9: Reference Maps & Aerial Photography I. Overview of Reference and Topographic Maps There are two basic types of maps? Reference Maps - General purpose maps & Thematic Maps - maps made for a specific
Benthic Terrain Modeler
 Benthic Terrain Modeler - Introduction Introduction to Benthic Terrain Modeling Exercise A Setting up your workspace: Installing the BTM and activating the Spatial Analyst Extension Exercise B Calculating
Introduction to Coastal GIS
 Introduction to Coastal GIS Event was held on Tues, 1/8/13 - Thurs, 1/10/13 Time: 9:00 am to 5:00 pm Location: Roger Williams University, Bristol, RI Audience: The intended audiences for this course are
Week 8 Cookbook: Review and Reflection
 : Review and Reflection Week 8 Overview 8.1) Review and Reflection 8.2) Making Intelligent Maps: The map sheet as a blank canvas 8.3) Making Intelligent Maps: Base layers and analysis layers 8.4) ArcGIS
Course overview. Grading and Evaluation. Final project. Where and When? Welcome to REM402 Applied Spatial Analysis in Natural Resources.
 Welcome to REM402 Applied Spatial Analysis in Natural Resources Eva Strand, University of Idaho Map of the Pacific Northwest from http://www.or.blm.gov/gis/ Where and When? Lectures Monday & Wednesday
v WMS Tutorials GIS Module Importing, displaying, and converting shapefiles Required Components Time minutes
 v. 11.0 WMS 11.0 Tutorial Importing, displaying, and converting shapefiles Objectives This tutorial demonstrates how to import GIS data, visualize it, and convert it into WMS coverage data that could be
Outline Anatomy of ArcGIS Metadata Data Types Vector Raster Conversion Adding Data Navigation Symbolization Methods Layer Files Editing Help Files
 UPlan Training Lab Exercise: Introduction to ArcGIS Outline Anatomy of ArcGIS Metadata Data Types Vector Raster Conversion Adding Data Navigation Symbolization Methods Layer Files Editing Help Files Anatomy
GIS Software. Evolution of GIS Software
 GIS Software The geoprocessing engines of GIS Major functions Collect, store, mange, query, analyze and present Key terms Program collections of instructions to manipulate data Package integrated collection
Measuring earthquake-generated surface offsets from high-resolution digital topography
 Measuring earthquake-generated surface offsets from high-resolution digital topography July 19, 2011 David E. Haddad david.e.haddad@asu.edu Active Tectonics, Quantitative Structural Geology, and Geomorphology
Introduction to ArcGIS 10.2
 Introduction to ArcGIS 10.2 Francisco Olivera, Ph.D., P.E. Srikanth Koka Lauren Walker Aishwarya Vijaykumar Keri Clary Department of Civil Engineering April 21, 2014 Contents Brief Overview of ArcGIS 10.2...
EnvSci 360 Computer and Analytical Cartography
 EnvSci 360 Computer and Analytical Cartography Lecture 7 Mapping Images, Surfaces, and 3-D Data Brief Overview of Imagery What is Imagery? A spatial data model that defines space as an array of equally
ArcGIS 9 ArcGIS StreetMap Tutorial
 ArcGIS 9 ArcGIS StreetMap Tutorial Copyright 2001 2008 ESRI All Rights Reserved. Printed in the United States of America. The information contained in this document is the exclusive property of ESRI. This
Photographs to Maps Using Aerial Photographs to Create Land Cover Maps
 Aerial photographs are an important source of information for maps, especially land cover and land use maps. Using ArcView, a map composed of points, lines, and areas (vector data) can be constructed from
Lesson Plan 2 - Middle and High School Land Use and Land Cover Introduction. Understanding Land Use and Land Cover using Google Earth
 Understanding Land Use and Land Cover using Google Earth Image an image is a representation of reality. It can be a sketch, a painting, a photograph, or some other graphic representation such as satellite
Hot Spot / Kernel Density Analysis: Calculating the Change in Uganda Conflict Zones
 Hot Spot / Kernel Density Analysis: Calculating the Change in Uganda Conflict Zones Created by Patrick Florance; revised by Carolyn Talmadge, Madeline Wrable, Kyle Monahan on March 28, 2017 OVERVIEW...
Exercise 4. Watershed and Stream Network Delineation
 Exercise 4. Watershed and Stream Network Delineation GIS in Water Resources, Fall 2014 Prepared by David G Tarboton and David R. Maidment Purpose The purpose of this exercise is to illustrate watershed
Overlay Analysis II: Using Zonal and Extract Tools to Transfer Raster Values in ArcMap
 Overlay Analysis II: Using Zonal and Extract Tools to Transfer Raster Values in ArcMap Created by Patrick Florance and Jonathan Gale, Edited by Catherine Ressijac on March 26, 2018 If you have raster data
GeoWEPP Tutorial Appendix
 GeoWEPP Tutorial Appendix Chris S. Renschler University at Buffalo - The State University of New York Department of Geography, 116 Wilkeson Quad Buffalo, New York 14261, USA Prepared for use at the WEPP/GeoWEPP
This paper outlines the steps we took to process the repository file into a Geodatabase Utility Data Model for Bloomfield Township s analysis.
 Title of Paper Importing CAD Drawings into a Utility Data Model Authors Names Kevin G. Broecker & James R. Miller Abstract This presentation covers the process needed to integrate data from a CAD drawing
ArcGIS Tools for Professional Cartography
 ArcGIS Tools for Professional Cartography By Makram Murad-al-shaikh M.S. Cartography Senior instructor ESRI Educational Services ICC - A Coruña - Spain, 9-16 July, 2005 Overview Overview of the ArcGIS
EXERCISE 12: IMPORTING LIDAR DATA INTO ARCGIS AND USING SPATIAL ANALYST TO MODEL FOREST STRUCTURE
 EXERCISE 12: IMPORTING LIDAR DATA INTO ARCGIS AND USING SPATIAL ANALYST TO MODEL FOREST STRUCTURE Document Updated: December, 2007 Introduction This exercise is designed to provide you with possible silvicultural
caused displacement of ocean water resulting in a massive tsunami. II. Purpose
 I. Introduction The Great Sumatra Earthquake event took place on December 26, 2004, and was one of the most notable and devastating natural disasters of the decade. The event consisted of a major initial
11. Kriging. ACE 492 SA - Spatial Analysis Fall 2003
 11. Kriging ACE 492 SA - Spatial Analysis Fall 2003 c 2003 by Luc Anselin, All Rights Reserved 1 Objectives The goal of this lab is to further familiarize yourself with ESRI s Geostatistical Analyst, extending
ArcHYDRO: GIS for Water Resources
 SOCRATES ERASMUS Intensive Programme ArcHYDRO: GIS for Water Resources Source: Center for Research in Water Resources, University of Texas at Austin Tutorial: Watershed and Stream Network Delineation Goals
The data for this lab comes from McDonald Forest. We will be working with spatial data representing the forest boundary, streams, roads, and stands.
 GIS LAB 6 Using the Projection Utility. Converting Data to Oregon s Approved Lambert Projection. Determining Stand Size, Stand Types, Road Length, and Stream Length. This lab will ask you to work with
Studying Topography, Orographic Rainfall, and Ecosystems (STORE)
") Introduction Studying Topography, Orographic Rainfall, and Ecosystems (STORE) Lesson: Using ArcGIS Explorer to Analyze the Connection between Topography, Tectonics, and Rainfall GIS-intensive Lesson This
Introduction Studying Topography, Orographic Rainfall, and Ecosystems (STORE) Lesson: Using ArcGIS Explorer to Analyze the Connection between Topography, Tectonics, and Rainfall GIS-intensive Lesson This
GIS APPLICATIONS IN SOIL SURVEY UPDATES
 GIS APPLICATIONS IN SOIL SURVEY UPDATES ABSTRACT Recent computer hardware and GIS software developments provide new methods that can be used to update existing digital soil surveys. Multi-perspective visualization
Learning Unit Student Guide. Title: Estimating Areas of Suitable Grazing Land Using GPS, GIS, and Remote Sensing
 Learning Unit Student Guide Name of Creator: Jeff Sun Institution: Casper College Email: jsun@caspercollege.edu Phone: Office (307) 268-3560 Cell (307) 277-9766 Title: Estimating Areas of Suitable Grazing
Exercise 3: GIS data on the World Wide Web
 Exercise 3: GIS data on the World Wide Web These web sites are a few examples of sites that are serving free GIS data. Many other sites exist. Search in Google or other search engine to find GIS data for
Esri UC2013. Technical Workshop.
 Esri International User Conference San Diego, California Technical Workshops July 9, 2013 CAD: Introduction to using CAD Data in ArcGIS Jeff Reinhart & Phil Sanchez Agenda Overview of ArcGIS CAD Support
Hot Spot / Point Density Analysis: Kernel Smoothing
 Hot Spot / Point Density Analysis: Kernel Smoothing Revised by Carolyn Talmadge on January 15, 2016 SETTING UP... 1 ENABLING THE SPATIAL ANALYST EXTENSION... 1 SET UP YOUR ANALYSIS OPTIONS IN ENVIRONMENTS...
Introduction To Raster Based GIS Dr. Zhang GISC 1421 Fall 2016, 10/19
 Introduction To Raster Based GIS Dr. Zhang GISC 1421 Fall 2016, 10/19 Model of the course Using and making maps Navigating GIS maps Map design Working with spatial data Geoprocessing Spatial data infrastructure
Key Processes
 Data Manipulation and Extraction Key Processes Key Processes Re-Projecting Data Selecting by Attributes Exporting Data Hillshade Reclassification Conversion of Raster to Vector Re-Projecting Data Purpose
Task 1: Start ArcMap and add the county boundary data from your downloaded dataset to the data frame.
 Exercise 6 Coordinate Systems and Map Projections The following steps describe the general process that you will follow to complete the exercise. Specific steps will be provided later in the step-by-step
SIE 509 Principles of GIS Exercise 5 An Introduction to Spatial Analysis
 SIE 509 Principles of GIS Exercise 5 An Introduction to Spatial Analysis Due: Oct. 31, 2017 Total Points: 50 Introduction: The Governor of Maine is asking communities to look at regionalization for major
Fundamentals of ArcGIS Desktop Pathway
 Fundamentals of ArcGIS Desktop Pathway Table of Contents ArcGIS Desktop I: Getting Started with GIS 3 ArcGIS Desktop II: Tools and Functionality 5 Understanding Geographic Data 8 Understanding Map Projections
Today: GEOL 452/552 - GIS for Geoscientists I. Lecture 3 - Chapter 1. GIS vector Data (review) Let s annotate this layer (draw on paper)
 Let s annotate this layer (draw on paper)") Today: GEOL 452/552 - GIS for Geoscientists I Lecture 3 - Chapter 1 GIS vector data - review raster data history: ArcView/ArcINFO - ArcGIS types of GIS data files Lab: finish Ch. 1 tutorial and HW1 Please
Today: GEOL 452/552 - GIS for Geoscientists I Lecture 3 - Chapter 1 GIS vector data - review raster data history: ArcView/ArcINFO - ArcGIS types of GIS data files Lab: finish Ch. 1 tutorial and HW1 Please
Spatial Analysis using Vector GIS THE GOAL: PREPARATION:
 PLAN 512 GIS FOR PLANNERS Department of Urban and Environmental Planning University of Virginia Fall 2006 Prof. David L. Phillips Spatial Analysis using Vector GIS THE GOAL: This tutorial explores some
Lecture 2. Introduction to ESRI s ArcGIS Desktop and ArcMap
 Lecture 2 Introduction to ESRI s ArcGIS Desktop and ArcMap Outline ESRI What is ArcGIS? ArcGIS Desktop ArcMap Overview Views Layers Attribute Tables Help! Scale Tips and Tricks ESRI Environmental Systems
Using Feature Templates for Complex Editing
 Using Feature Templates for Complex Editing By Mike Price, Entrada/San Juan, Inc. What You Will Need ArcGIS 10.3 for Desktop (Basic, Standard, or Advanced license) Sample dataset downloaded from esri.com/arcuser
How do I do that in Quantum GIS: illustrating classic GIS tasks Edited by: Arthur J. Lembo, Jr.; Salisbury University
 How do I do that in Quantum GIS: illustrating classic GIS tasks Edited by: Arthur J. Lembo, Jr.; Salisbury University How do I do that in Quantum GIS Page 1 Introduction from the editor:... 4 Database
Exercise 4. Watershed and Stream Network Delineation
 Exercise 4. Watershed and Stream Network Delineation GIS in Water Resources, Fall 2015 Prepared by David G Tarboton and David R. Maidment Purpose The purpose of this exercise is to illustrate watershed
In order to follow this exercise you need to have completed exercise 1.
 In order to follow this exercise you need to have completed exercise 1. Contents of Exercise 2: Derive new datasets from inputs and carry out Multicriteria analysis in order to Part 1: Use Spatial Analysis
INTRODUCTION TO ARCGIS Version 10.*
 Week 3 INTRODUCTION TO ARCGIS Version 10.* topics of the week Overview of ArcGIS Using ArcCatalog Overview of ArcGIS Desktop ArcGIS Overview Scalable desktop applications ArcView ArcEditor ArcInfo ArcGIS
Urban Canopy Tool User Guide `bo`
 Urban Canopy Tool User Guide `bo` ADMS Urban Canopy Tool User Guide Version 2.0 June 2014 Cambridge Environmental Research Consultants Ltd. 3, King s Parade Cambridge CB2 1SJ UK Telephone: +44 (0)1223
Map image from the Atlas of Oregon (2nd. Ed.), Copyright 2001 University of Oregon Press
, Copyright 2001 University of Oregon Press") Map Layout and Cartographic Design with ArcGIS Desktop Matthew Baker ESRI Educational Services Redlands, CA Education UC 2008 1 Seminar overview General map design principles Working with map elements
Map Layout and Cartographic Design with ArcGIS Desktop Matthew Baker ESRI Educational Services Redlands, CA Education UC 2008 1 Seminar overview General map design principles Working with map elements
Brief Overview of Geodatabases. Procedure IT GEOGRAPHIC INFORMATION SYSTEMS LAB 9 GEODATABASE AND DIGITIZING SHAPEFILED
 Developing entirely new maps using on-screen digitizing to create spatial features (such as points, lines, and polygons) is a vital GIS capability. ArcGIS provides a useful, but proprietary, spatial data
Lab 1: Importing Data, Rectification, Datums, Projections, and Coordinate Systems
 Lab 1: Importing Data, Rectification, Datums, Projections, and Coordinate Systems Topics covered in this lab: i. Importing spatial data to TAS ii. Rectification iii. Conversion from latitude/longitude
Displaying and Rotating WindNinja-Derived Wind Vectors in ArcMap 10.5
 Displaying and Rotating WindNinja-Derived Wind Vectors in ArcMap 10.5 Chuck McHugh RMRS, Fire Sciences Lab, Missoula, MT, 406-829-6953, cmchugh@fs.fed.us 08/01/2018 Displaying WindNinja-generated gridded
Part 1: GIS Data from the Web: Downloading and Projecting Digital Elevation Models (DEM) and BTS Road data
 and BTS Road data") Field Geology I Hometown GIS, Part 1 October 03, 2005 Lab Exercise 2.1 Part 1: GIS Data from the Web: Downloading and Projecting Digital Elevation Models (DEM) and BTS Road data 1. Introduction a. GIS
Field Geology I Hometown GIS, Part 1 October 03, 2005 Lab Exercise 2.1 Part 1: GIS Data from the Web: Downloading and Projecting Digital Elevation Models (DEM) and BTS Road data 1. Introduction a. GIS
Vector Analysis: Farm Land Suitability Analysis in Groton, MA
 Vector Analysis: Farm Land Suitability Analysis in Groton, MA Written by Adrienne Goldsberry, revised by Carolyn Talmadge 10/9/2018 Introduction In this assignment, you will help to identify potentially
Getting Started with Military Analyst for ArcGIS 9.2
 Getting Started with Military Analyst for ArcGIS 9.2 Copyright 2006 ESRI All rights reserved. Printed in the United States of America. The information contained in this document is the exclusive property
Exercise 4. Watershed and Stream Network Delineation
 Exercise 4. Watershed and Stream Network Delineation GIS in Water Resources, Fall 2016 Prepared by David G Tarboton and David R. Maidment Updated to ArcGIS Pro by Paul Ruess [9/29/16 Further updated to