Spatial Analyst: Multiple Criteria Evaluation Material adapted from FOR 4114 developed by Forestry Associate Professor Steve Prisley
|
|
|
- Francis Cole
- 6 years ago
- Views:
Transcription
1 Spatial Analyst: Multiple Criteria Evaluation Material adapted from FOR 4114 developed by Forestry Associate Professor Steve Prisley Section 1: Data In this exercise we will be working with several types of raster data for the Eggleston quad in Giles County, Virginia. We will be doing a raster analysis in this area to find locations meeting a combination of criteria including elevation, slope, aspect, and National Forest ownership. Your data include: NFOwn 37080C5 Egg30 Eggleston Shapefile of USFS ownership boundaries (from GW-Jeff National Forest) USGS DRG of Eggleston Quad, Virginia 30m DEM of Eggleston, Virginia 10m DEM of Eggleston, Virginia Section 2: Overview We are going to use raster data to find areas that meet a combination of criteria: 1. Within National Forest Ownership; 2. Elevations greater than 600 m 3. Slopes greater than 30% 4. Southern and southwestern aspects. To do this, we will create slope and aspect rasters and convert a vector layer to raster format. Prior to doing all this, we will become familiar with raster data and learn to enhance the display of topographic raster data. Along the way, we will examine the impact of spatial resolution (grid cell size) on our output products. Section 3: Examining properties of raster data First, we will examine the characteristics of two DEM datasets that cover the same area. All of the digital elevation models we are using were downloaded from the web site. 1. Open ArcMap to a new map document and add the Eggleston and Egg30 DEM raster layers. Zoom to the full extent of the map. The Eggleston and Egg30 rasters cover the same geographic area at two different resolutions. 2. Make sure the Spatial Analyst Extension is turned on: from the Customize menu, select Extensions and make sure Spatial Analyst is checked. If the Spatial Analyst toolbar is not displayed, activate it by going to the Spatial Analyst: MCE Page 1
2 Tools menu, Customize option, and checking Spatial Analyst on the Toolbars tab. 3. Record the following information (Layer properties, Source Tab): Cellsize (X, Y) Pixel Type Pixel Depth (bits) Number of Columns Number of Rows Egg30 Eggleston 4. As in our work with images, raster file size is a function of data depth (how many bits or bytes per cell or pixel) and image size (numbers of rows and columns). If we estimate raster file size as: (Number of rows) x (Number of columns) x (Data depth in bytes) Then estimate raster file size for each of these (important: recall that there are 8 bits in a byte). Egg30 Eggleston Raster file size (bytes) Key Point: As with images, DEM s involve a tradeoff between spatial resolution (cell size) and file size. High resolution DEM s have smaller cells but many more of them. With smaller cells we may get a more precise sense of landform. But with higher file size comes greater storage requirements, longer processing times, etc. 5. There is another significant difference between the Egg30 and Eggleston DEM s. Using the layer properties again, complete the following: Minimum Elev. Value Maximum Elev. Value Egg30 Eggleston Spatial Analyst: MCE Page 2
3 6. What is going on here? Because these datasets cover the same geographic area, one might expect them to have approximately the same elevations. Using the Egg30.txt and Eggleston.txt metadata files, find and explain these elevation differences [Hint: elevation values are often referred to as Z values, as in a three-dimensional system of coordinate axes, where X is east-west, Y is north-south, and Z is elevation]. Key Point: Unfortunately, this is exactly the way this data came from USGS through GISDataDepot. There is no standard for elevation units for DEM s; they may come in either feet or meters. NEVER ASSUME that all data files will be consistent. What would be the implication of calculating slope (rise/run) if you ignored units and the run (X & Y) units were meters and the rise (Z) units were feet? Would the calculated slope be correct? 7. Before doing further analysis with these datasets, we want to make sure the elevation units for both of these are in meters. We can use Raster Calculator to convert a grid with values in feet to values in meters: a. In the Search Window, type in Raster Calculator b. Select Raster Calculator (Spatial Analyst) tool c. Double-click on the name of the layer that has elevations in feet; it will appear in the expression area in brackets. d. Complete the expression to divide by (feet per meter): layername / e. Select your output location and name the file Egg30m (since it will now be in meters). f. Click OK. g. Examine the layer properties of this new layer and compare the data range to the numbers you recorded in step 5; record for the new layer (to the nearest 0.1 m): i. Minimum Elevation value: ii. Maximum Elevation value: 8. Important: remove the Egg30 DEM from your map; in all further work in this lab, use the Egg30m raster in place of Egg30. Key Point: Many raster GIS operations involve calculations based on the cell values. For example, dividing an elevation in feet by a constant conversion factor can produce elevations in meters. Other times, we will perform mathematical operations involving multiple raster datasets as if they were variables in an equation; this is what the raster calculator is all about! Spatial Analyst: MCE Page 3
4 Section 4. Vector to Raster Conversion We now want to use a vector layer of national forest ownership to create a raster file for our study area. We will use this later to determine what areas within the Eggleston quadrangle are owned by the US Forest Service. When we convert vector data to raster format, we must specify things like the extent (what area should be covered by the raster), the cell size, the coordinate system, etc. 9. Add the NFOwn.shp shapefile to your map. This data contains National Forest ownership boundaries for the George Washington-Jefferson National Forest (downloaded from Zoom in to the extent of the NFOwn layer; note that it goes well beyond the extent of our study area. Do we want to create a 10m raster that large? 11. Zoom back to the extent of Egg30m. 12. We need to specify some options for our vector-raster conversion: a. From the Geoprocessing menu, select "Environments". b. Specify a workspace: this will be the location where all temporary raster files will be created unless you dictate otherwise; your analyses will operate faster if this is on the computer's hard drive and not on an external drive! Make sure that the location you specify does not have a space in any folder name (such as Documents and Settings )! c. Specify that you want your analysis output in the same coordinate system as the data frame: Output Coordinates > Same as Input d. Within Processing Extent set the Extent to "Same as layer Egg30m" this limits the processing area to just the area of Egg30m, no data will be processed outside of the raster. e. Within Raster Analysis : i. Set your Cell Size to "Same as layer Egg30m" ii. Set your Mask to be the "Same as layer Egg30m". f. Click OK to close the options dialog. Now, any new raster file you create should match your Egg30m layer by default. 13. In the Search Window, type in Feature to Raster, select "Feature to Raster (Conversion)". a. The input features should be the NFOwn shapefile. b. The field to use for values in the output should be the "NFOWN_ID" code. (This is an ID number for each unique polygon in the ownership shapefile). c. Specify an output raster with name NFOwn30 (indicating 30m resolution). d. Output cell size should be set to Egg30m (you may have to Browse to the data set and select it). e. Click OK to perform the conversion. Spatial Analyst: MCE Page 4
5 14. Examine your results: a. Set transparency on your vector layer (NFOwn) to 60%, and zoom way in to some ownership edges to see how closely the raster and vector boundaries are. b. Open the attribute table for NFOwn30 and note the numbers in the Count column. These are counts of the numbers of grid cells for each attribute value (in this case, the attribute value is the ID number of the polygons; you specified that NFOWN_ID was to be used as the attribute value). Note that using the cell counts, you can determine area (each cell is 30m by 30m or 900 m 2, correct?). Record your counts and compute area: Attribute Value: Count Area (m 2 ) Area (ha) Total: c. If this raster matches the extent and cell size of the Egg30m raster, why is the total number of cells recorded above much less than the total number of cells you observed in steps 3 and 4? d. Use the Identify tool and click in your map to obtain values from the raster ownership layer. What happens when you click outside a forest boundary? What value is displayed? e. Go to the Symbology tab of the layer properties for the raster ownership layer. Note that you can change the colors displayed for the forest categories. Note also that you can set a color to be displayed where the layer has "No Data" (see the button next to "Display NoData as" in the lower right corner). Try it, setting a color for "NoData". 15. Now you see that grids (rasters) can contain areas without data; voids. These areas are treated differently in many calculations and operations; you should be aware of them!! 16. Now, repeat steps using the Eggleston raster as a template (matching the Processing Extent and cell size of Eggleston instead of Egg30m). Call the output NFOwn10. We might expect forest area to vary slightly if we use different grid cells sizes; the boundary will not be the same as when we used 30m cells. Record the total National Forest cell count and area from this new 10m raster. (Remember that these cells are no longer 900m 2, right?) a. Total count: b. Area (hectares): Spatial Analyst: MCE Page 5
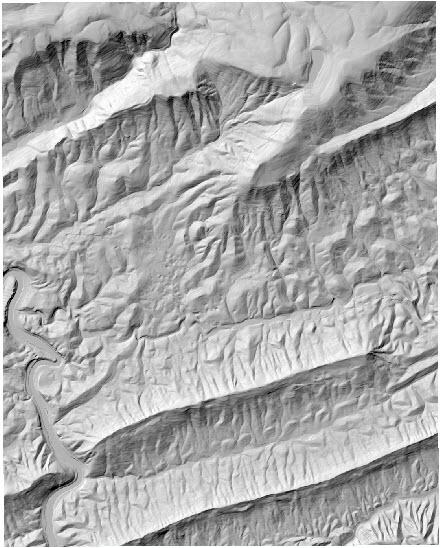
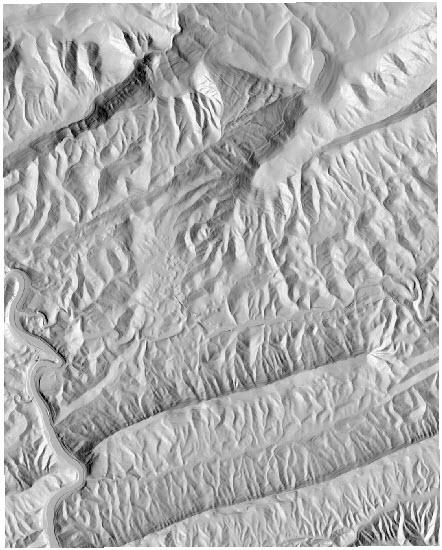
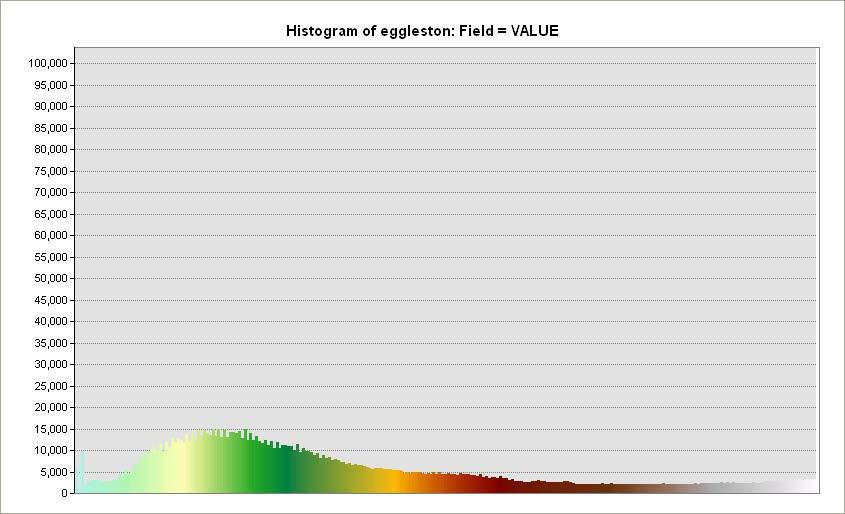
6 How well does the total hectares of National Forest from your 10m grid match the total from your 30m grid found in 14.b.? 17. You may remove the vector ownership layer (NFOwn), the NFOwn30 raster ownership layer created above, and turn off the display of (uncheck) the 10m raster ownership layer; you won't be needing it for a while. Section 5. Creating a shaded-relief map Now, we will create a shaded-relied map to better visualize the topography. 18. In the Search Window type in Hillshade, select Hillshade (Spatial Analyst). Create a Hillshade of both of the DEM s (Egg30m and Eggleston), using default values for azimuth, altitude, etc. Each time you create a hillshade, click on the Environments button and make sure your cell size (within Raster Analysis) and Processing Extent matches the input surface ; this field usually defaults to the last raster created. a. You should now have two hillshade rasters covering the same area. Zoom in to a scale of 1:20,000. By turning on and off the top layer, you should be able to go back and forth viewing the two versions. b. Which is more detailed? 19. Next, experiment with creating additional hillshade rasters of Eggleston, using different values for azimuth and altitude. Which one looks correct to you? Why? 20. Now we will experiment with color symbology for the elevation layer: a. Open the Symbology dialog for Eggleston (layer properties) b. Under Show, set to Classified. c. Right-click on the color ramp, and uncheck the Graphic View selection. This will now display names of the color ramps. d. Scroll down and select the color ramp named Elevation #1. This is a common color ramp showing lower elevations in blue, then greens, and higher elevations in orange, red, brown and finally white. e. Click the Classify button to specify a classification using 10 equal interval classes. f. Click OK to close the Symbology dialog. g. Now we have a graduated color map of elevations. h. Experiment also with the same color ramp applied to a Stretched rather than Classified symbology. Which provides more detail? 21. Note that Spatial Analyst provides a quick way to get a histogram of your data: a. In the Spatial Analyst toolbar, set the Layer to be Eggleston. b. At the right end of the toolbar, click the Histogram icon. c. A histogram of the values contained in the raster is displayed. You may need to make the histogram window bigger to see it all. Spatial Analyst: MCE Page 6
7 d. Now, in the symbology dialog, note that the default stretch type is Standard Deviations. Try different stretch types, each time creating a histogram of the values. Note that the histogram changes when you change the stretch type. 22. Now we can add a shaded-relief effect. i. Create a hillshade raster of the Eggleston layer, using default values for azimuth and altitude, and an output cell size of 10m. ii. Move this hillshade raster down in the Table of Contents until it is beneath your Eggleston layer. iii. Bring up the layer properties of your Eggleston layer. iv. Select the Display tab and set transparency to 60%. v. Now, you have the color elevation gradient from one layer and the shaded relief effect from another. Key Point: Shaded relief maps are a very effective means of visualizing topography. A shaded relief map can be created using an elevation layer, with graduated color symbology (using any color ramp you wish; it doesn t have to be Elevation #1 ), and a hillshade layer. 23. Finally, we will overlay detail on the map from the DRG s of this area. a. Add the Eggleston DRG to your map (37080c5.tif). i. The "color table" (list of values and associated colors) in this type of image can be manipulated in ArcGIS to change the colors displayed. b. We can make use of this capability to enable DRG's to be overlaid onto other images, lending annotation and context as well as being able to see the underlying shaded relief map: i. Turn on one of the DOQQ images and zoom to its extent. ii. Make sure the DRG image is higher in the table of contents (displayed over top of the DOQQ). iii. Open the Symbology tab of the layer properties dialog for the DRG layer, it should be on Colormap under Show. iv. Now, double click the color symbol associated with each of the following values and set it to "No Color": a. 1 (white) b. 5 (green) c. 9 (pink) d. 10 (lavender) e. 11 (gray) f. 12 (light brown) g. 255 (white) c. This DRG overlay is not very helpful at small scales. Note that at small scales (numbers like 1:100,000), all detail from the DRG is lost. At extremely large scales (like 1:1,000) the individual image pixels from the DRG become more distracting than helpful. d. Determine, in your own judgment, for what range of scales the DRG overlay seems helpful: Spatial Analyst: MCE Page 7
8 i. Largest scale: 1:. ii. Smallest scale: 1:. e. Now, set the display range for the DRG so that it will only display when the map scale is within this range: i. From the layer properties for the DRG, go to the General tab. ii. Click the radio button for Don t show layer when zoomed: iii. Specify the minimum and maximum scales you selected above. Key Point: Note the checkbox in the Table of Contents. It has changed to show that the display of this layer is now dependent on the map scale. 24. Use the Go To XY tool to zoom in to the area around the Cascades (set units to Meters; UTM Coordinates X: , Y: ). Zoom to a scale such that the Cascades location is visible, and the DRG is displayed over your shaded-relief map. Section 6. Creating slope and aspect rasters and reclassifying data Now, we will use Spatial Analyst to derive rasters of terrain slope gradient and slope direction (aspect). These variables are used in a wide variety of analyses in areas with topographic relief. For example, in the northern hemisphere, southern and western aspects receive sunlight later in the day and are consequently much warmer and dryer; this often results in different vegetation and physical conditions. 25. In the Search Window type Slope, select Slope (Spatial Analyst). a. We want to create a percent_rise slope raster based on the eggleston dem (make sure your environment settings match your inputs!) b. Name the raster Slope. 26. Now search for Aspect in the Search Window, select Aspect (Spatial Analyst). a. We want to create an aspect raster from the eggleston dem. b. Name the raster Aspect. 27. We need to reclass our rasters of slope class and aspect class for further analysis. We will use the class definitions in the box below. (When you reclassify, you will assign class numbers. The meanings are simply how we will refer to these classes by a name). Spatial Analyst: MCE Page 8
9 Slope Classes: Aspect Classes: Slope Value (%) Class Number Class Meaning N Low Moderate W Xeric Mesic E Steep Very Steep S Aspect Classes: Aspect value ( ) Class Number Class Meaning Flat Mesic Intermediate Xeric Intermediate Mesic 28. To reclassify your Slope and Aspect rasters, type Reclassify into the Search Window and select Reclassify (Spatial Analyst) a. Your input will either be your slope or aspect raster b. The reclass field should automatically be set to the Value field c. Click on the Classify button, change the Method to Equal Interval, set the Class number to match either the Slope or Aspect Classes listed in Step 27 Spatial Analyst: MCE Page 9
10 d. Manual type in the Break Values on the right, each break value is the highest value for a class (e.g. the break value for Aspect class 1 is 0) e. Click OK f. Change the New Values in the Reclassification to match Step 27 values for Class Number g. Name your output rasters either AspClass10 or SlpClass When you are done, complete the following table; enter the count of cells in each class for each raster. Then, multiply the count times the cell size to get area in each class; record area in hectares to the nearest tenth (1 m 2 = ha). Slope Aspect Class Count Hectares Class Count Hectares Low Flat Moderate Mesic Steep Intermediate Very Steep Xeric Section 7. Putting it together: raster selection (query) Now, we have developed raster datasets that correspond to the criteria we are interested in: elevation, slope, aspect, and Forest Service ownership. We can combine these layers to find areas of interest. For the sake of example, we'll assume we're looking for likely areas in which to find the mythical endangered fritillated lousewort (Pedicularis fictionalis). It grows on dry, steep slopes at high elevations. We want to know how many hectares of this type of land are within our study area, and how much of that is on national forest land. 30. Locate the Raster Calculator by searching for it in the Search Window. It is best to use the buttons provided on Raster Calculator versus typing in an expression as it is very particular about syntax. Use the raster calculator to locate areas within the Eggleston quadrangle that meet the following criteria: a. Elevation must be at least (>=) 600m. b. Slope class is Steep or Very Steep. c. Aspect class is Xeric. Spatial Analyst: MCE Page 10
11 Caution: Review your Spatial Analyst options- we want 10m cells! An example expression for Raster Calculator to locate all elevation over 600m is: eggleston >= 600 *Remember to use the raster values not their meanings in your expressions in raster calculator. 31. The result should be a raster containing just 0 and 1 values; 0 means the cell did not meet the criteria, 1 means it did. The most effective display of this type or result may be to set the 0 values to "No Color" and set the 1 values to a bright, contrasting color and display it over your shaded relief map with no other layers displayed. Then, the bright colored areas represent likely locations for sites favorable for the fritillated lousewort. 32. Now, turn on the Forest Service ownership raster in the map so that you can visually locate areas outside of forest service ownership that might be favorable to the lousewort. If large areas favorable to the lousewort are located within Forest Service ownership, the agency can manage the land to promote the species. If large areas exist outside federal ownership, it might be useful to pursue conservation easements or buy land for protection of the lousewort. To determine areas within national forests favorable to lousewort, you will need to perform another selection in raster calculator, using the previous selection (calculation) and the national forest ownership raster. Complete the following table summarizing areas (report areas in hectares to the nearest hectare): Within NF Outside NF Total: Favorable Unfavorable Total: Hint: You may encounter difficulty summarizing areas based on the national forest ownership, due to the large areas in that raster with NoData. You can reclassify a raster such that NoData cells are assigned a numeric value. Key Point: The Raster Calculator is an immensely powerful tool. You can use it to query a single raster layer, multiple raster layers, to perform arithmetic expressions on combinations of rasters, etc. You should get familiar with the Raster Calculator functionality if you anticipate doing much raster analysis in ArcGIS. Spatial Analyst: MCE Page 11
12
13
14

15 Example Shaded relief map with DRG overlay
Tutorial 8 Raster Data Analysis
 Objectives Tutorial 8 Raster Data Analysis This tutorial is designed to introduce you to a basic set of raster-based analyses including: 1. Displaying Digital Elevation Model (DEM) 2. Slope calculations
The Geodatabase Working with Spatial Analyst. Calculating Elevation and Slope Values for Forested Roads, Streams, and Stands.
 GIS LAB 7 The Geodatabase Working with Spatial Analyst. Calculating Elevation and Slope Values for Forested Roads, Streams, and Stands. This lab will ask you to work with the Spatial Analyst extension.
Data Structures & Database Queries in GIS
 Data Structures & Database Queries in GIS Objective In this lab we will show you how to use ArcGIS for analysis of digital elevation models (DEM s), in relationship to Rocky Mountain bighorn sheep (Ovis
GIS IN ECOLOGY: ANALYZING RASTER DATA
 GIS IN ECOLOGY: ANALYZING RASTER DATA Contents Introduction... 2 Raster Tools and Functionality... 2 Data Sources... 3 Tasks... 4 Getting Started... 4 Creating Raster Data... 5 Statistics... 8 Surface
Working with Digital Elevation Models in ArcGIS 8.3
 Working with Digital Elevation Models in ArcGIS 8.3 The homework that you need to turn in is found at the end of this document. This lab continues your introduction to using the Spatial Analyst Extension
GIS IN ECOLOGY: ANALYZING RASTER DATA
 GIS IN ECOLOGY: ANALYZING RASTER DATA Contents Introduction... 2 Tools and Functionality for Raster Data... 2 Data Sources... 3 Tasks... 4 Getting Started... 4 Creating Raster Data... 5 Summary Statistics...
Lab 7: Cell, Neighborhood, and Zonal Statistics
 Lab 7: Cell, Neighborhood, and Zonal Statistics Exercise 1: Use the Cell Statistics function to detect change In this exercise, you will use the Spatial Analyst Cell Statistics function to compare the
WORKING WITH DMTI DIGITAL ELEVATION MODELS (DEM)
") WORKING WITH DMTI DIGITAL ELEVATION MODELS (DEM) Contents (Ctrl-Click to jump to a specific page) Manipulating the DEM Step 1: Finding the DEM Tiles You Need... 2 Step 2: Importing the DEM Tiles into ArcMap...
WORKING WITH DMTI DIGITAL ELEVATION MODELS (DEM) Contents (Ctrl-Click to jump to a specific page) Manipulating the DEM Step 1: Finding the DEM Tiles You Need... 2 Step 2: Importing the DEM Tiles into ArcMap...
Overlay Analysis II: Using Zonal and Extract Tools to Transfer Raster Values in ArcMap
 Overlay Analysis II: Using Zonal and Extract Tools to Transfer Raster Values in ArcMap Created by Patrick Florance and Jonathan Gale, Edited by Catherine Ressijac on March 26, 2018 If you have raster data
Exercise 6: Working with Raster Data in ArcGIS 9.3
 Exercise 6: Working with Raster Data in ArcGIS 9.3 Why Spatial Analyst? Grid query Grid algebra Grid statistics Summary by zone Proximity mapping Reclassification Histograms Surface analysis Slope, aspect,
In this exercise we will learn how to use the analysis tools in ArcGIS with vector and raster data to further examine potential building sites.
 GIS Level 2 In the Introduction to GIS workshop we filtered data and visually examined it to determine where to potentially build a new mixed use facility. In order to get a low interest loan, the building
Global Atmospheric Circulation Patterns Analyzing TRMM data Background Objectives: Overview of Tasks must read Turn in Step 1.
 Global Atmospheric Circulation Patterns Analyzing TRMM data Eugenio Arima arima@hws.edu Hobart and William Smith Colleges Department of Environmental Studies Background: Have you ever wondered why rainforests
Geo 327G Semester Project. Landslide Suitability Assessment of Olympic National Park, WA. Fall Shane Lewis
 Geo 327G Semester Project Landslide Suitability Assessment of Olympic National Park, WA Fall 2011 Shane Lewis 1 I. Problem Landslides cause millions of dollars of damage nationally every year, and are
Creating Watersheds from a DEM
 Creating Watersheds from a DEM These instructions enable you to create watersheds of specified area using a good quality Digital Elevation Model (DEM) in ArcGIS 8.1. The modeling is performed in ArcMap
Displaying and Rotating WindNinja-Derived Wind Vectors in ArcMap 10.5
 Displaying and Rotating WindNinja-Derived Wind Vectors in ArcMap 10.5 Chuck McHugh RMRS, Fire Sciences Lab, Missoula, MT, 406-829-6953, cmchugh@fs.fed.us 08/01/2018 Displaying WindNinja-generated gridded
Creating Watersheds from a DEM in ArcGIS 9.x
 Creating Watersheds from a DEM in ArcGIS 9.x These instructions enable you to create watersheds (a.k.a. catchments or basins) using a good quality Digital Elevation Model (DEM) in ArcGIS 9.1. The modeling
Learning Unit Student Guide. Title: Estimating Areas of Suitable Grazing Land Using GPS, GIS, and Remote Sensing
 Learning Unit Student Guide Name of Creator: Jeff Sun Institution: Casper College Email: jsun@caspercollege.edu Phone: Office (307) 268-3560 Cell (307) 277-9766 Title: Estimating Areas of Suitable Grazing
Getting Started. Start ArcMap by opening up a new map.
 Start ArcMap by opening up a new map. Getting Started We now need to set up ArcMap to do some analysis using the Spatial Analyst extension. You will need to activate the Spatial Analyst extension by selecting
MERGING (MERGE / MOSAIC) GEOSPATIAL DATA
 GEOSPATIAL DATA") This help guide describes how to merge two or more feature classes (vector) or rasters into one single feature class or raster dataset. The Merge Tool The Merge Tool combines input features from input
This help guide describes how to merge two or more feature classes (vector) or rasters into one single feature class or raster dataset. The Merge Tool The Merge Tool combines input features from input
Conservation Applications of LiDAR Data
 Program: Funding: Conservation Applications of LiDAR Data http://tsp.umn.edu/lidar Environment and Natural Resources Trust Fund Module: Instructor: Exercise: Hydrologic Applications Sean Vaughn, DNR GIS
Using the Stock Hydrology Tools in ArcGIS
 Using the Stock Hydrology Tools in ArcGIS This lab exercise contains a homework assignment, detailed at the bottom, which is due Wednesday, October 6th. Several hydrology tools are part of the basic ArcGIS
Spatial Data Analysis in Archaeology Anthropology 589b. Kriging Artifact Density Surfaces in ArcGIS
 Spatial Data Analysis in Archaeology Anthropology 589b Fraser D. Neiman University of Virginia 2.19.07 Spring 2007 Kriging Artifact Density Surfaces in ArcGIS 1. The ingredients. -A data file -- in.dbf
Task 1: Open ArcMap and activate the Spatial Analyst extension.
 Exercise 10 Spatial Analyst The following steps describe the general process that you will follow to complete the exercise. Specific steps will be provided later in the step-by-step instructions component
Handling Raster Data for Hydrologic Applications
 Handling Raster Data for Hydrologic Applications Prepared by Venkatesh Merwade Lyles School of Civil Engineering, Purdue University vmerwade@purdue.edu January 2018 Objective The objective of this exercise
Outcrop suitability analysis of blueschists within the Dry Lakes region of the Condrey Mountain Window, North-central Klamaths, Northern California
 Outcrop suitability analysis of blueschists within the Dry Lakes region of the Condrey Mountain Window, North-central Klamaths, Northern California (1) Introduction: This project proposes to assess the
GIS Workshop UCLS_Fall Forum 2014 Sowmya Selvarajan, PhD TABLE OF CONTENTS
 TABLE OF CONTENTS TITLE PAGE NO. 1. ArcGIS Basics I 2 a. Open and Save a Map Document 2 b. Work with Map Layers 2 c. Navigate in a Map Document 4 d. Measure Distances 4 2. ArcGIS Basics II 5 a. Work with
DEMs Downloading and projecting and using Digital Elevation Models (DEM)
") DEMs Downloading and projecting and using Digital Elevation Models (DEM) Introduction In this exercise, you will work with Digital Elevation Models (DEM). You will download a DEM in geographic coordinates
DEMs Downloading and projecting and using Digital Elevation Models (DEM) Introduction In this exercise, you will work with Digital Elevation Models (DEM). You will download a DEM in geographic coordinates
GEOG4017 Geographical Information Systems Lab 8 Spatial Analysis and Digital Terrain Modeling
 DEPARTMENT OF GEOGRAPHY HONG KONG BAPTIST UNIVERSITY Prof. Q. Zhou GEOG4017 Geographical Information Systems Lab 8 Spatial Analysis and Digital Terrain Modeling Objectives The exercise is designed to familiarize
Lab 1: Landuse and Hydrology, learning ArcGIS II. MANIPULATING DATA
 Lab 1: Landuse and Hydrology, learning ArcGIS II. MANIPULATING DATA As you experienced in the first lab session when you created a hillshade, high resolution data can be unwieldy if you are trying to perform
Exercise 6: Using Burn Severity Data to Model Erosion Risk
 Exercise 6: Using Burn Severity Data to Model Erosion Risk Document Updated: November 2009 Software Versions: ERDAS Imagine 9.3 and ArcGIS 9.3, Microsoft Office 2007 Introduction A common use of burn severity
Determining the Location of the Simav Fault
 Lindsey German May 3, 2012 Determining the Location of the Simav Fault 1. Introduction and Problem Formulation: The issue I will be focusing on involves interpreting the location of the Simav fault in
EXERCISE 12: IMPORTING LIDAR DATA INTO ARCGIS AND USING SPATIAL ANALYST TO MODEL FOREST STRUCTURE
 EXERCISE 12: IMPORTING LIDAR DATA INTO ARCGIS AND USING SPATIAL ANALYST TO MODEL FOREST STRUCTURE Document Updated: December, 2007 Introduction This exercise is designed to provide you with possible silvicultural
Within this document, the term NHDPlus is used when referring to NHDPlus Version 2.1 (unless otherwise noted).
.") Exercise 7 Watershed Delineation Using ArcGIS Spatial Analyst Last Updated 4/6/2017 Within this document, the term NHDPlus is used when referring to NHDPlus Version 2.1 (unless otherwise noted). There
Exercise 7 Watershed Delineation Using ArcGIS Spatial Analyst Last Updated 4/6/2017 Within this document, the term NHDPlus is used when referring to NHDPlus Version 2.1 (unless otherwise noted). There
Automatic Watershed Delineation using ArcSWAT/Arc GIS
 Automatic Watershed Delineation using ArcSWAT/Arc GIS By: - Endager G. and Yalelet.F 1. Watershed Delineation This tool allows the user to delineate sub watersheds based on an automatic procedure using
Task 1: Start ArcMap and add the county boundary data from your downloaded dataset to the data frame.
 Exercise 6 Coordinate Systems and Map Projections The following steps describe the general process that you will follow to complete the exercise. Specific steps will be provided later in the step-by-step
Watershed Delineation
 Watershed Delineation Jessica L. Watkins, University of Georgia 2 April 2009 Updated by KC Love February 25, 2011 PURPOSE For this project, I delineated watersheds for the Coweeta synoptic sampling area
Outline Anatomy of ArcGIS Metadata Data Types Vector Raster Conversion Adding Data Navigation Symbolization Methods Layer Files Editing Help Files
 UPlan Training Lab Exercise: Introduction to ArcGIS Outline Anatomy of ArcGIS Metadata Data Types Vector Raster Conversion Adding Data Navigation Symbolization Methods Layer Files Editing Help Files Anatomy
(THIS IS AN OPTIONAL BUT WORTHWHILE EXERCISE)
") PART 2: Analysis in ArcGIS (THIS IS AN OPTIONAL BUT WORTHWHILE EXERCISE) Step 1: Start ArcCatalog and open a geodatabase If you have a shortcut icon for ArcCatalog on your desktop, double-click it to start
PART 2: Analysis in ArcGIS (THIS IS AN OPTIONAL BUT WORTHWHILE EXERCISE) Step 1: Start ArcCatalog and open a geodatabase If you have a shortcut icon for ArcCatalog on your desktop, double-click it to start
Delineation of Watersheds
 Delineation of Watersheds Adirondack Park, New York by Introduction Problem Watershed boundaries are increasingly being used in land and water management, separating the direction of water flow such that
How to Create Stream Networks using DEM and TauDEM
 How to Create Stream Networks using DEM and TauDEM Take note: These procedures do not describe all steps. Knowledge of ArcGIS, DEMs, and TauDEM is required. TauDEM software ( http://hydrology.neng.usu.edu/taudem/
Outline. ArcGIS? ArcMap? I Understanding ArcMap. ArcMap GIS & GWR GEOGRAPHICALLY WEIGHTED REGRESSION. (Brief) Overview of ArcMap
 Overview of ArcMap") GEOGRAPHICALLY WEIGHTED REGRESSION Outline GWR 3.0 Software for GWR (Brief) Overview of ArcMap Displaying GWR results in ArcMap stewart.fotheringham@nuim.ie http://ncg.nuim.ie ncg.nuim.ie/gwr/ ArcGIS?
GEOGRAPHICALLY WEIGHTED REGRESSION Outline GWR 3.0 Software for GWR (Brief) Overview of ArcMap Displaying GWR results in ArcMap stewart.fotheringham@nuim.ie http://ncg.nuim.ie ncg.nuim.ie/gwr/ ArcGIS?
Learning ArcGIS: Introduction to ArcCatalog 10.1
 Learning ArcGIS: Introduction to ArcCatalog 10.1 Estimated Time: 1 Hour Information systems help us to manage what we know by making it easier to organize, access, manipulate, and apply knowledge to the
GeoWEPP Tutorial Appendix
 GeoWEPP Tutorial Appendix Chris S. Renschler University at Buffalo - The State University of New York Department of Geography, 116 Wilkeson Quad Buffalo, New York 14261, USA Prepared for use at the WEPP/GeoWEPP
Exercise 5e: Estimating the impact of sea level rise in coastal areas of the United States and comparing to the impact in coastal Asia
 Exercise 5e: Estimating the impact of sea level rise in coastal areas of the United States and comparing to the impact in coastal Asia Data sets (downloaded in previous homework from the National Geophysical
Projection and Reprojection
 Using Quantum GIS Tutorial ID: IGET_GIS_002 This tutorial has been developed by BVIEER as part of the IGET web portal intended to provide easy access to geospatial education. This tutorial is released
An Overview of Digital Terrain Modelling and Multi-Criteria Analysis
 Introduction An Overview of Digital Terrain Modelling and Multi-Criteria Analysis BC EnviroConsultants was recently awarded a contract from Environment Canada to produce a report on a rare plant species
Studying Topography, Orographic Rainfall, and Ecosystems (STORE)
") Introduction Studying Topography, Orographic Rainfall, and Ecosystems (STORE) Lesson: Using ArcGIS Explorer to Analyze the Connection between Topography, Tectonics, and Rainfall GIS-intensive Lesson This
Introduction Studying Topography, Orographic Rainfall, and Ecosystems (STORE) Lesson: Using ArcGIS Explorer to Analyze the Connection between Topography, Tectonics, and Rainfall GIS-intensive Lesson This
Introduction To Raster Based GIS Dr. Zhang GISC 1421 Fall 2016, 10/19
 Introduction To Raster Based GIS Dr. Zhang GISC 1421 Fall 2016, 10/19 Model of the course Using and making maps Navigating GIS maps Map design Working with spatial data Geoprocessing Spatial data infrastructure
Watershed Modeling Orange County Hydrology Using GIS Data
 v. 10.0 WMS 10.0 Tutorial Watershed Modeling Orange County Hydrology Using GIS Data Learn how to delineate sub-basins and compute soil losses for Orange County (California) hydrologic modeling Objectives
GIS Semester Project Working With Water Well Data in Irion County, Texas
 GIS Semester Project Working With Water Well Data in Irion County, Texas Grant Hawkins Question for the Project Upon picking a random point in Irion county, Texas, to what depth would I have to drill a
11. Kriging. ACE 492 SA - Spatial Analysis Fall 2003
 11. Kriging ACE 492 SA - Spatial Analysis Fall 2003 c 2003 by Luc Anselin, All Rights Reserved 1 Objectives The goal of this lab is to further familiarize yourself with ESRI s Geostatistical Analyst, extending
Exercise 2: Working with Vector Data in ArcGIS 9.3
 Exercise 2: Working with Vector Data in ArcGIS 9.3 There are several tools in ArcGIS 9.3 used for GIS operations on vector data. In this exercise we will use: Analysis Tools in ArcToolbox Overlay Analysis
Lab 5 - Introduction to the Geodatabase
 Lab 5 - Introduction to the Geodatabase 1. Design Process GIS is becoming an increasingly accessible and important tool for land managers. In this exercise you will begin creating a Personal Geodatabase
ISU GIS CENTER S ARCSDE USER'S GUIDE AND DATA CATALOG
 ISU GIS CENTER S ARCSDE USER'S GUIDE AND DATA CATALOG 2 TABLE OF CONTENTS 1) INTRODUCTION TO ARCSDE............. 3 2) CONNECTING TO ARCSDE.............. 5 3) ARCSDE LAYERS...................... 9 4) LAYER
Delineation of high landslide risk areas as a result of land cover, slope, and geology in San Mateo County, California
 Delineation of high landslide risk areas as a result of land cover, slope, and geology in San Mateo County, California Introduction Problem Overview This project attempts to delineate the high-risk areas
Exercise 6: Coordinate Systems
 Exercise 6: Coordinate Systems This exercise will teach you the fundamentals of Coordinate Systems within QGIS. In this exercise you will learn: How to determine the coordinate system of a layer How the
Introduction to Coastal GIS
 Introduction to Coastal GIS Event was held on Tues, 1/8/13 - Thurs, 1/10/13 Time: 9:00 am to 5:00 pm Location: Roger Williams University, Bristol, RI Audience: The intended audiences for this course are
v WMS Tutorials GIS Module Importing, displaying, and converting shapefiles Required Components Time minutes
 v. 11.0 WMS 11.0 Tutorial Importing, displaying, and converting shapefiles Objectives This tutorial demonstrates how to import GIS data, visualize it, and convert it into WMS coverage data that could be
Understanding elevation and derivative layers
 Understanding elevation and derivative layers ArcGIS makes it easy to work with elevation data by offering a dynamic world elevation service (TopoBathy) and a specific land elevation (Terrain). These services
Hot Spot / Kernel Density Analysis: Calculating the Change in Uganda Conflict Zones
 Hot Spot / Kernel Density Analysis: Calculating the Change in Uganda Conflict Zones Created by Patrick Florance; revised by Carolyn Talmadge, Madeline Wrable, Kyle Monahan on March 28, 2017 OVERVIEW...
Trouble-Shooting Coordinate System Problems
 Trouble-Shooting Coordinate System Problems Written by Barbara M. Parmenter. Revised on October 2, 2018 OVERVIEW OF THE EXERCISE... 1 COPYING THE MAP PROJECTION EXERCISE FOLDER TO YOUR H: DRIVE OR DESKTOP...
Working with ArcGIS: Classification
 Working with ArcGIS: Classification 2 Abbreviations D-click R-click TOC Double Click Right Click Table of Content Introduction The benefit from the use of geographic information system (GIS) software is
ArcGIS 9 ArcGIS StreetMap Tutorial
 ArcGIS 9 ArcGIS StreetMap Tutorial Copyright 2001 2008 ESRI All Rights Reserved. Printed in the United States of America. The information contained in this document is the exclusive property of ESRI. This
EnvSci 360 Computer and Analytical Cartography
 EnvSci 360 Computer and Analytical Cartography Lecture 7 Mapping Images, Surfaces, and 3-D Data Brief Overview of Imagery What is Imagery? A spatial data model that defines space as an array of equally
Land Cover Data Processing Land cover data source Description and documentation Download Use Use
 Land Cover Data Processing This document provides a step by step procedure on how to build the land cover data required by EnSim. The steps provided here my be long and there may be short cuts (like using
Watershed Analysis of the Blue Ridge Mountains in Northwestern Virginia
 Watershed Analysis of the Blue Ridge Mountains in Northwestern Virginia Mason Fredericks December 6, 2018 Purpose The Blue Ridge Mountain range is one of the most popular mountain ranges in the United
Geography 281 Map Making with GIS Project Eight: Comparing Map Projections
 Geography 281 Map Making with GIS Project Eight: Comparing Map Projections In this activity, you will do a series of projection comparisons using maps at different scales and geographic extents. In this
NR402 GIS Applications in Natural Resources
 NR402 GIS Applications in Natural Resources Lesson 1 Introduction to GIS Eva Strand, University of Idaho Map of the Pacific Northwest from http://www.or.blm.gov/gis/ Welcome to NR402 GIS Applications in
Trouble-Shooting Coordinate System Problems
 Trouble-Shooting Coordinate System Problems Written by Barbara M. Parmenter, revised 2/25/2014 OVERVIEW OF THE EXERCISE... 1 COPYING THE MAP PROJECTION EXERCISE FOLDER TO YOUR H: DRIVE OR DESKTOP... 2
GEOG 487 Lesson 7: Step-by-Step Activity
 GEOG 487 Lesson 7: Step-by-Step Activity Part I: Review the Relevant Data Layers and Organize the Map Document In Part I, we will review the data and organize the map document for analysis. 1. Unzip the
caused displacement of ocean water resulting in a massive tsunami. II. Purpose
 I. Introduction The Great Sumatra Earthquake event took place on December 26, 2004, and was one of the most notable and devastating natural disasters of the decade. The event consisted of a major initial
Key Processes
 Data Manipulation and Extraction Key Processes Key Processes Re-Projecting Data Selecting by Attributes Exporting Data Hillshade Reclassification Conversion of Raster to Vector Re-Projecting Data Purpose
Part 1: GIS Data from the Web: Downloading and Projecting Digital Elevation Models (DEM) and BTS Road data
 and BTS Road data") Field Geology I Hometown GIS, Part 1 October 03, 2005 Lab Exercise 2.1 Part 1: GIS Data from the Web: Downloading and Projecting Digital Elevation Models (DEM) and BTS Road data 1. Introduction a. GIS
Field Geology I Hometown GIS, Part 1 October 03, 2005 Lab Exercise 2.1 Part 1: GIS Data from the Web: Downloading and Projecting Digital Elevation Models (DEM) and BTS Road data 1. Introduction a. GIS
Exercise 4 Estimating the effects of sea level rise on coastlines by reclassification
 Exercise 4 Estimating the effects of sea level rise on coastlines by reclassification Due: Thursday February 1; at the start of class Goal: Get familiar with symbolizing and making time-series maps of
Hydrology and Watershed Analysis
 Hydrology and Watershed Analysis Manual By: Elyse Maurer Reference Map Figure 1. This map provides context to the area of Washington State that is being focused on. The red outline indicates the boundary
How might you use visibility to map an ancient civilization's political landscape?
 Analyzing Ancient Political Power and Urbanization Patterns by Introduction Problem How might you use visibility to map an ancient civilization's political landscape? The Yoruba civilization, one of the
Lab 1: Importing Data, Rectification, Datums, Projections, and Coordinate Systems
 Lab 1: Importing Data, Rectification, Datums, Projections, and Coordinate Systems Topics covered in this lab: i. Importing spatial data to TAS ii. Rectification iii. Conversion from latitude/longitude
Vector Analysis: Farm Land Suitability Analysis in Groton, MA
 Vector Analysis: Farm Land Suitability Analysis in Groton, MA Written by Adrienne Goldsberry, revised by Carolyn Talmadge 10/9/2018 Introduction In this assignment, you will help to identify potentially
Geography 281 Map Making with GIS Project Four: Comparing Classification Methods
 Geography 281 Map Making with GIS Project Four: Comparing Classification Methods Thematic maps commonly deal with either of two kinds of data: Qualitative Data showing differences in kind or type (e.g.,
Popular Mechanics, 1954
 Introduction to GIS Popular Mechanics, 1954 1986 $2,599 1 MB of RAM 2017, $750, 128 GB memory, 2 GB of RAM Computing power has increased exponentially over the past 30 years, Allowing the existence of
How to create a new geodatabase using the extract data wizard. 1. How to Extract the Schema to create a Geodatabase using an existing design.
 How to create a new geodatabase using the extract data wizard The Extract Data Wizard can be used to create a new database based on an existing geodatabase. This tool may be used in the following cases:
Using Web GIS to Build Consensus and Combat Wildland Fire Threats
 Using Web GIS to Build Consensus and Combat Wildland Fire Threats By Mike Price, Entrada/San Juan, Inc. What You Will Need ArcGIS 10.3 for Desktop (any license level) An ArcGIS Online account (one comes
IMPERIAL COUNTY PLANNING AND DEVELOPMENT
 IMPERIAL COUNTY PLANNING AND DEVELOPMENT GEODATABASE USER MANUAL FOR COUNTY BUSINESS DEVELOPMENT GIS June 2010 Prepared for: Prepared by: County of Imperial Planning and Development 801 Main Street El
Lecture 2. A Review: Geographic Information Systems & ArcGIS Basics
 Lecture 2 A Review: Geographic Information Systems & ArcGIS Basics GIS Overview Types of Maps Symbolization & Classification Map Elements GIS Data Models Coordinate Systems and Projections Scale Geodatabases
Outline. Chapter 1. A history of products. What is ArcGIS? What is GIS? Some GIS applications Introducing the ArcGIS products How does GIS work?
 Outline Chapter 1 Introducing ArcGIS What is GIS? Some GIS applications Introducing the ArcGIS products How does GIS work? Basic data formats The ArcCatalog interface 1-1 1-2 A history of products Arc/Info
Week 7 Last week: This week s topics. GIS and Forest Engineering Applications. FE 257. GIS and Forest Engineering Applications.
 FE 257. GIS and Forest Engineering Applications Week 7 Week 7 Last week: Spatial Projections Questions? Next week- read: Chapter 10: Updating GIS Databases Chapter 12: Synthesis of Techniques Applied to
Exercise 12 Spatial Analysis on Antarctica
 Exercise 12 Spatial Analysis on Antarctica Due: Tuesday, March 6 Goal: Using ArcMap s Spatial Analyst tools for digital elevation models and rasters. Datasets: Bed elevation Ice thickness Surface elevation
RiparianZone = buffer( River, 100 Feet )
") GIS Analysts perform spatial analysis when they need to derive new data from existing data. In GIS I, for example, you used the vector approach to derive a riparian buffer feature (output polygon) around
GIS Analysts perform spatial analysis when they need to derive new data from existing data. In GIS I, for example, you used the vector approach to derive a riparian buffer feature (output polygon) around
GIS 2010: Coastal Erosion in Mississippi Delta
 1) Introduction Problem overview To what extent do large storm events play in coastal erosion rates, and what is the rate at which coastal erosion is occurring in sediment starved portions of the Mississippi
ArcHYDRO: GIS for Water Resources
 SOCRATES ERASMUS Intensive Programme ArcHYDRO: GIS for Water Resources Source: Center for Research in Water Resources, University of Texas at Austin Tutorial: Watershed and Stream Network Delineation Goals
Using Earthscope and B4 LiDAR data to analyze Southern California s active faults
 Using Earthscope and B4 LiDAR data to analyze Southern California s active faults Exercise 8: Simple landscape morphometry and stream network delineation Introduction This exercise covers sample activities
Visual Studies Exercise, Assignment 07 (Architectural Paleontology) Geographic Information Systems (GIS), Part II
 Geographic Information Systems (GIS), Part II") ARCH1291 Visual Studies II Week 8, Spring 2013 Assignment 7 GIS I Prof. Alihan Polat Visual Studies Exercise, Assignment 07 (Architectural Paleontology) Geographic Information Systems (GIS), Part II Medium:
ARCH1291 Visual Studies II Week 8, Spring 2013 Assignment 7 GIS I Prof. Alihan Polat Visual Studies Exercise, Assignment 07 (Architectural Paleontology) Geographic Information Systems (GIS), Part II Medium:
The data for this lab comes from McDonald Forest. We will be working with spatial data representing the forest boundary, streams, roads, and stands.
 GIS LAB 6 Using the Projection Utility. Converting Data to Oregon s Approved Lambert Projection. Determining Stand Size, Stand Types, Road Length, and Stream Length. This lab will ask you to work with
Exercise 3: GIS data on the World Wide Web
 Exercise 3: GIS data on the World Wide Web These web sites are a few examples of sites that are serving free GIS data. Many other sites exist. Search in Google or other search engine to find GIS data for
Display data in a map-like format so that geographic patterns and interrelationships are visible
 Vilmaliz Rodríguez Guzmán M.S. Student, Department of Geology University of Puerto Rico at Mayagüez Remote Sensing and Geographic Information Systems (GIS) Reference: James B. Campbell. Introduction to
Hot Spot / Point Density Analysis: Kernel Smoothing
 Hot Spot / Point Density Analysis: Kernel Smoothing Revised by Carolyn Talmadge on January 15, 2016 SETTING UP... 1 ENABLING THE SPATIAL ANALYST EXTENSION... 1 SET UP YOUR ANALYSIS OPTIONS IN ENVIRONMENTS...
Exercise 2: Working with Vector Data in ArcGIS 9.3
 Exercise 2: Working with Vector Data in ArcGIS 9.3 There are several tools in ArcGIS 9.3 used for GIS operations on vector data. In this exercise we will use: Analysis Tools in ArcToolbox Overlay Analysis
Displaying Latitude & Longitude Data (XY Data) in ArcGIS
 in ArcGIS") Displaying Latitude & Longitude Data (XY Data) in ArcGIS Created by Barbara Parmenter and updated on 2/15/2018 If you have a table of data that has longitude and latitude, or XY coordinates, you can view
Displaying Latitude & Longitude Data (XY Data) in ArcGIS Created by Barbara Parmenter and updated on 2/15/2018 If you have a table of data that has longitude and latitude, or XY coordinates, you can view
Open ArcToolbox Spatial Analyst Tools Hydrology. This should display the tools shown at the right:
 Project 2: Watershed Functions Save and close your project, above, if you haven t done so already. Then, open a new project, and add the driftless DEM. We ll be using ArcToolbox for this new project, but
Exercise 4. Watershed and Stream Network Delineation
 Exercise 4. Watershed and Stream Network Delineation GIS in Water Resources, Fall 2014 Prepared by David G Tarboton and David R. Maidment Purpose The purpose of this exercise is to illustrate watershed