Gravity and Magnetic Anomalies Compared to Moho Depth throughout the State of Texas
|
|
|
- Mercy Cole
- 6 years ago
- Views:
Transcription
1 Gravity and Magnetic Anomalies Compared to Moho Depth throughout the State of Texas Taylor Borgfeldt Introduction My Master s thesis is to improve and create additional crustal seismic velocity models of Texas. A crucial step in creating the 1D and initial 3D model is to know where major units lie in the subsurface. The Ellenburger formation, a karstic limestone, and the Precambrian igneous basement are the most widespread units in Texas and extend, generally, from the Panhandle to Balcones Fault. By importing surfaces of both units, I can find the thickness of the Ellenburger Formation to use in the velocity models. Because the Moho is such a large velocity contrast in comparison to the crust above, mapping the surface of the Moho is a crucial step. I used this project as an opportunity to create the best Moho surface from receiver function data, comparing multiple tools in ArcMap. Aside from my thesis work, I nor Dr. Helper were aware of any basic studies analyzing general tectonic structures represented in the gravity and magnetic anomaly studies that covered Texas. In this project, I conduct a general observational study mapping out highs and lows in the gravity maps in relation to tectonic regimes and geologic units. Data Collection Working from the surface down, I downloaded and collected the data sets from various sources. I downloaded the geologic units shapefile from the USGS Mineral Resources On-Line Spatial Data page for Texas ( I also downloaded the ArcMap style file for the lithology colors. The hillshade DEM shapefile for the state of Texas was available on the Texas Water Development Board s GIS Data site ( Cari Breton at the BEG gave me access to the digitized files for the Tectonic Framework of Texas by T. E. Ewing. I received the files for depth to top of the Ellenburger formation from Eric Potter and colleagues at the BEG who various studies to create a statewide surface map of the formation. The contours were originally created in regional studies by the Texas Water Development Board, ISPB, BEG and Ruppel. The files were in the NAD 1927 Texas Statewide Mapping System projected coordinate system and North American 1927 geographic coordinate system. For the Precambrian basement, Cari Breton digitized Peter Flawn s Basement Rocks of Texas and Southeast New Mexico (Flawn, 1956) maps of depth to basement and rock samples. The files were originally in the North American 1983 geographic coordinate system. Moving to the Moho, I downloaded the EarthScope Automated Receiver Survey (EARS) data ( for all of the US Transportable Array stations in Texas when the USArray rolled across Texas from 2008 to EARS calculates the receiver functions for 1
, which were in.e00 format and covered Texas and parts of surrounding states (Fig. 1).")
2 each TA station using teleseismic earthquake data to measure the thickness of the crust above the Moho. I downloaded the gravity and magnetic anomaly maps from the USGS ( which were in.e00 format and covered Texas and parts of surrounding states (Fig. 1). Figure 1: Image of USGS site with gravity and magnetic data The state boundary was downloaded from TIGER shapefile page on Data.gov ( Original projected coordinate system is NAD 1983 Albers. Data Pre-processing Geologic Units, Faults and Tectonics I used Project to transform from NAD27 to NAD 1983 UTM Zone 14N for both faults and geology. For geologic units, I had to Match to Symbols in a Style in the symbology and used the style file from USGS to color the units properly. 2
3 Ellenburger To create a single surface for the Ellenburger, I began by importing all the shapefiles and related files for each study of the Ellenburger into ArcMap (Fig. 2). Figure 2: Screenshot of original contours, breaks and polygons for all Ellenburger studies I then individually converted each set of contours to rasters using Topo to Raster with the Field set to value and Type set to contour (Fig. 3). 3

.")
4 Figure 3: Screenshot of contours converted to raster but not clipped I also added the boundary file for each set of contours and set their Type to cliff. This stopped the interpolation of the raster at the boundaries of each study area (Fig. 4). Figure 4: Screenshot of Ellenburger raster clipped at boundaries with contours overlaying raster 4
.")
5 At this point, I had 4 rasters that overlapped and covered various parts of Texas but all represented the same geologic unit. To merge the rasters, I used Mosaic to New Raster with the Mosaic Operator set to MEAN to average the value of cells that have overlapping rasters (Fig. 5). Precambrian Basement Figure 5: Raster of complete Ellenburger surface I repeated the same process for the Precambrian igneous basement in Texas with the only difference that I had only one set of contours, so I did not have to merge or average cell values. As part of my thesis work, I need to know the thickness of the Ellenburger formation. To calculate the thickness, I used the Raster Calculator to subtract the Ellenburger mosaic raster from the Precambrian raster (reversed because of negative depths) to find the thickness of the Ellenburger everywhere the Precambrian underlies it. Moho To create a shapefile of the top of the Moho boundary, I first had to export the data from the EARS site for all TA stations within the latitude and longitude limits (-107 W to -93 W and 26 N to 36 N) of Texas. This included stations in surrounding states, but I will later fix that by clipping the Moho shapefile (Fig. 6). I used a Bash shell script to remove the latitude, longitude and depth (km) from the downloaded data, and then imported it into Excel. I then added the Excel file to ArcMap, selected Display XY Data, set X Field to Longitude, Y Field to Latitude, Z Field to Depth (km) and set the coordinate system to the geographic coordinate system NAD I then exported the data to a shapefile and set the Data Frame Properties to NAD
6 UTM Zone 14N. To ensure the XYZ points overlapped other rasters and shapefiles, I used the Project tool to change from GCS NAD 1983 to projected coordinate system NAD 1983 UTM Zone 14N to match the data frame. Gravity and Magnetic Figure 6: All EARS stations plotted on top of the geology shapefile as reference for viewer I downloaded the isostatic and Bouguer gravity maps and the magnetic anomaly map in the.e00 format and used the Import from E00 tool. ArcGIS Processing Geology, Faults, and Tectonic Boundaries I clipped the tectonic boundary shapefile to the state boundary shapefile. Hillshade There was a discrepancy between the outline for the hillshade and the state boundary along the Gulf. I believe the difference is due to the state boundary inlet traces while the hillshade is a smooth and constant trace of the coastline. I therefore used Extract by Mask to clip the hillshade to the state boundary to keep all files consistent. Ellenburger and Precambrian basement Processing was completed in pre-processing. 6
 Used Extract by Mask after each tool with the state boundary Changed Symbology to inverted partial spectrum To interpolate a surface from the EARS data points, I used various tools (IDW,")
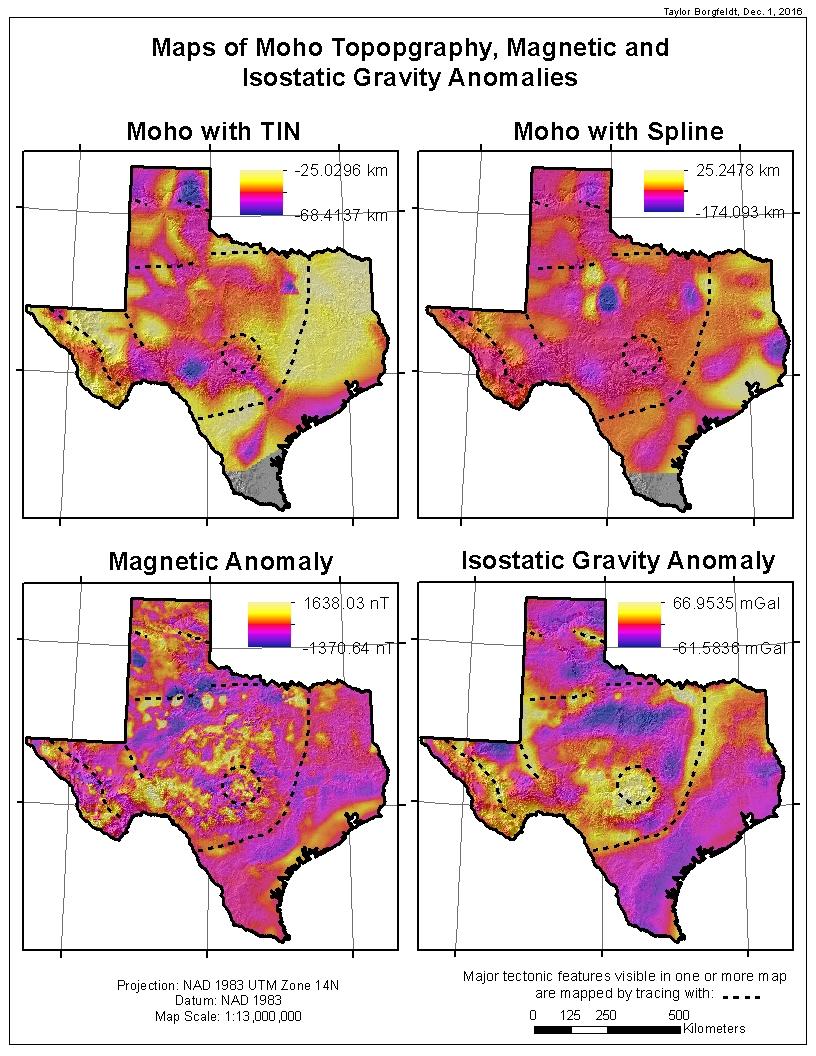
7 Moho Used IDW, Spline, Tin, Topo to Raster, Trend to interpolate the surface (Fig. 7-12) Used Extract by Mask after each tool with the state boundary Changed Symbology to inverted partial spectrum To interpolate a surface from the EARS data points, I used various tools (IDW, Spline, Tin, Topo to Raster, Trend) to see the differences in the interpolated surfaces created. For all surfaces created, the interpolation can only reach as far as the furthest data point in each direction. Therefore, the surfaces do not extend to the southernmost part of Texas. Figure 7: Moho surface using IDW tool 7
8 Figure 8: Moho surface using Spline tool and 8 points per region Figure 9: Moho surface using TIN tool with linear method 8
9 Figure 10: Moho surface using Topo to Raster tool Figure 11: Moho surface using Trend tool with polynomial order of 3 9
.")
10 Figure 12: Moho surface using Trend tool with polynomial order of 12 Gravity and Magnetic After the files were imported with the Import from E00 tool, the individual maps covered Texas and part of surrounding states. I then used the correctly projected Texas boundary shapefile in Extract by Mask to clip the three files to Texas (Fig ). 10
11 Figure 13: Screenshot of clipped Bouguer anomaly raster Figure 14: Screenshot of isostatic gravity anomaly raster 11
12 Discussion Figure 15: Screenshot of clipped magnetic anomaly raster This project initially began as a step toward creating surfaces that are indicative of seismic velocity contrasts in the subsurface of Texas. As I began working with the data points from the EARS receiver functions, I realized the Moho topography is highly dependent on the tools used to interpolate the XYZ points. Therefore, I conducted a qualitative analysis on the surfaces produced from various interpolation tools in Arc. I then compared the topography of the Moho to the Bouguer and Isostatic Anomaly. The surfaces created for Ellenburger and Precambrian basement did not have any similarities to the Bouguer, isostatic or magnetic anomalies. Inverse Distance Weighting (IDW) (Fig. 7) IDW is an exact, deterministic method of interpolation, so the surface passes through measured data points. No values of the surface exceed the minimum or maximum measured values, but the IDW surface is considered rough and not the best method for data sets that do not decrease as a function of distance. The surface created with the IDW tool has quite a few (>10) peaks and pits. Because this is supposed to be representative of the Moho, I determined this tool to be unfit for Moho surface interpolation with the given data set. Spline (Fig. 8) The spline tool creates a minimum curvature surface that passes through data points but can exceed maximum and minimum measured values. It is supposed to create a smoother surface than IDW and be a better fit for topography. A parameter that is able to be set in the spline tool is 12
13 the number of points per region used for local approximation. The most realistic (smooth with enough representation of topography changes) surface I could create was with 8 points per region (Fig. 8). The EARS Moho depths range from -69 km to -25 km, but the spline surface extends from -174 to +25 km. Obviously, the Moho is not above the earth s surface and does not have pits of -174 km in isolated areas. However, compared to the gravity anomalies, some of the same general trends are found in highs and lows. Therefore, the spline tool is also an inaccurate representation of the Moho in regards to accurate depths, but can be a good smooth surface to examine gross trends in the surface. Triangular Irregular Network (TIN) (Fig. 9) I used Create Tin and then TIN to Raster to create a TIN surface from the EARS data. I used a float output data type, linear method, and OBSERVATIONS250 sampling distance. This tool does not create an interpolated surface that exceeds the minimum and maximum measured data points. It uses Delaunay triangles (vertices are data points with the goal of creating the most equilateral triangles), which takes advantage of non-gridded data points with variable levels of detail across the study area. The surface rendered is reasonably variable without peaks or pits, follows similar trends to the isostatic gravity anomaly and does not exceed measured data points; therefore, it is the best tool available to create a surface from variably spaced XYZ points that represent a smooth topography. Topo to Raster (Fig. 10) This tool is recommended for the creation of hydrologically correct digital elevation models (DEMs). 1 The tool ensures connected drainages and accurate representation of ridges and streams. It has been modified to allow the fitted DEM to follow abrupt changes in terrain, such as streams, ridges and cliffs 1. This surface does not exceed the measured data points and is reasonably smooth. But, due to the hydrology application, the tools appears to interpolate more trenches than possibly exist between higher values. The interpolated surface is very similar to the TIN surface (Fig. 9), but I think TIN is still more appropriate. Trend (Fig. 11 and 12) The Trend tool is an inexact, deterministic method of interpolation. Because it is inexact, the surface does not need to pass through measured data points. This allowed one surface to start just below the surface (unrealistic) and extend to -100 km depth (unrealistic). The surface is created by setting the order of polynomial to increase complexity of the surface. I used a polynomial order of 3 and 12 (Fig. 11 and 12) to compare the possible surfaces, but neither appear to be similar to the gravity surfaces, or any other interpolated surfaces. I do not think trend is a reasonable tool to use. Structure and Tectonics in the Moho, Gravity, Magnetics The final maps show a few plots of the Moho surface interpolated by various tools and the gravity and magnetic anomalies. Some of the figures have the tectonic boundary shapefile
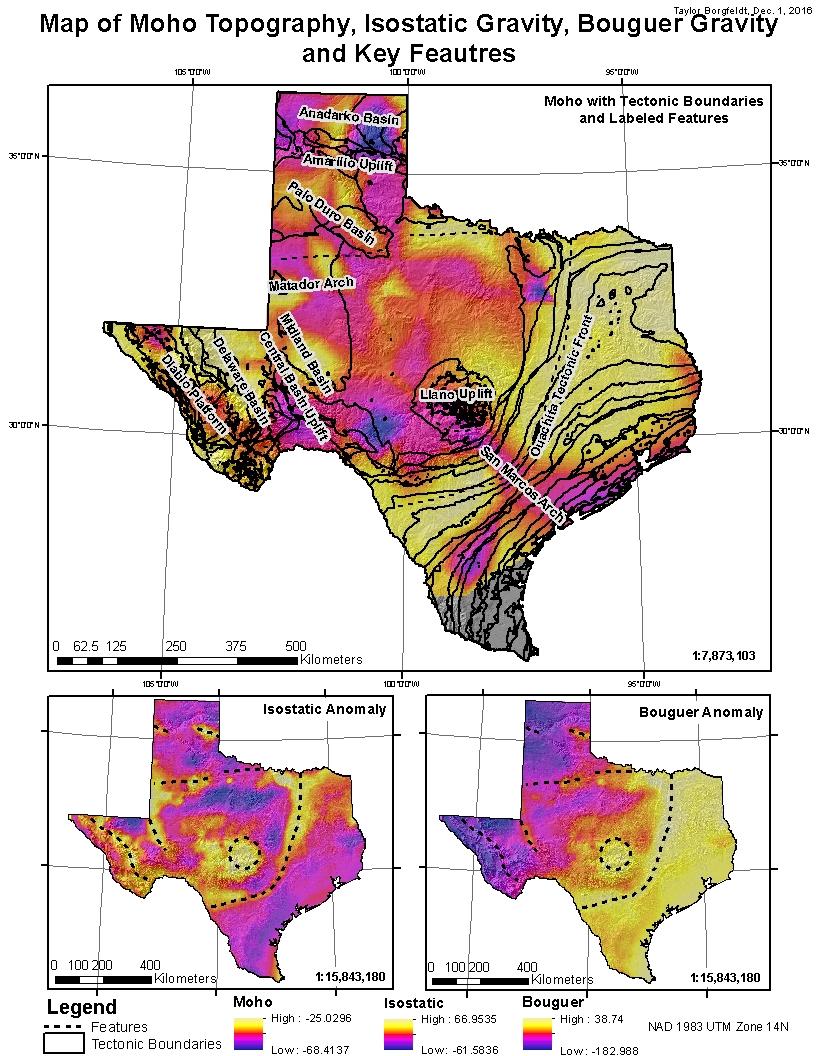
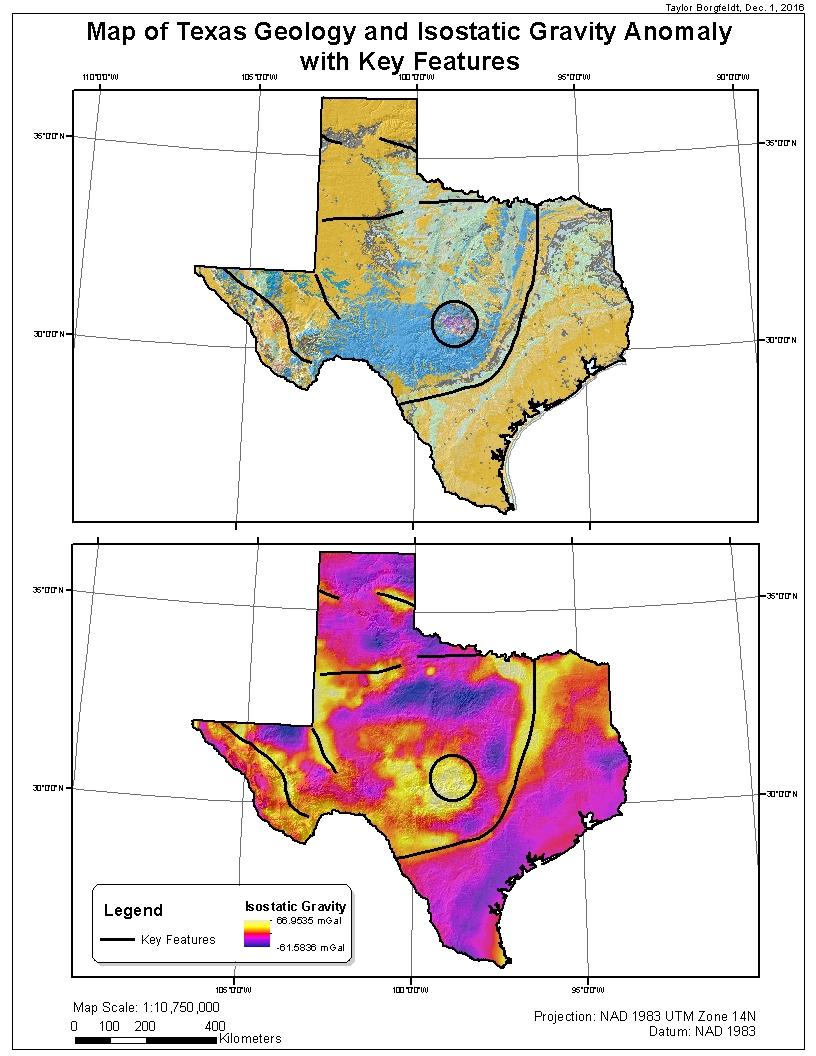
14 overlaying the surface (Moho, anomaly) and others have polylines drawn to show where key features plot on the various figures. Overall, large tectonic features are visible in the Moho TIN surface, Bouguer and isostatic gravity anomalies and the magnetic anomaly. As seen in the Map of Moho Topography, Isostatic Gravity, Bouguer Gravity and Key Features, the San Marcos Arch, Ouachita Tectonic Front, Llano Uplift, Midland Basin, Central Basin Uplift, Delaware Basin, Diablo Platform, Anadarko Basin, Amarillo Uplift and Matador Arch are all topographic and/or gravity highs or lows. Because there is strong correlation between tectonic features in the gravity anomaly maps with the TIN surface, I will continue to use TIN as the tool to create interpolated surfaces from EARS data. In the future, I need to incorporate station elevation into the EARS Moho depths and investigate other studies to increase the data set. The station elevations are already available, but I did not include them in order to create a simpler, smoother surface that would be easier to test. 14
15 15
16 16
17 17
Predictive Modelling of Ag, Au, U, and Hg Ore Deposits in West Texas Carl R. Stockmeyer. December 5, GEO 327G
 Predictive Modelling of Ag, Au, U, and Hg Ore Deposits in West Texas Carl R. Stockmeyer December 5, 2013 - GEO 327G Objectives and Motivations The goal of this project is to use ArcGIS to create models
Determining the Location of the Simav Fault
 Lindsey German May 3, 2012 Determining the Location of the Simav Fault 1. Introduction and Problem Formulation: The issue I will be focusing on involves interpreting the location of the Simav fault in
caused displacement of ocean water resulting in a massive tsunami. II. Purpose
 I. Introduction The Great Sumatra Earthquake event took place on December 26, 2004, and was one of the most notable and devastating natural disasters of the decade. The event consisted of a major initial
Lauren Jacob May 6, Tectonics of the Northern Menderes Massif: The Simav Detachment and its relationship to three granite plutons
 Lauren Jacob May 6, 2010 Tectonics of the Northern Menderes Massif: The Simav Detachment and its relationship to three granite plutons I. Introduction: Purpose: While reading through the literature regarding
Outcrop suitability analysis of blueschists within the Dry Lakes region of the Condrey Mountain Window, North-central Klamaths, Northern California
 Outcrop suitability analysis of blueschists within the Dry Lakes region of the Condrey Mountain Window, North-central Klamaths, Northern California (1) Introduction: This project proposes to assess the
Creating Watersheds from a DEM
 Creating Watersheds from a DEM These instructions enable you to create watersheds of specified area using a good quality Digital Elevation Model (DEM) in ArcGIS 8.1. The modeling is performed in ArcMap
Watershed Analysis of the Blue Ridge Mountains in Northwestern Virginia
 Watershed Analysis of the Blue Ridge Mountains in Northwestern Virginia Mason Fredericks December 6, 2018 Purpose The Blue Ridge Mountain range is one of the most popular mountain ranges in the United
Geo 327G Semester Project. Landslide Suitability Assessment of Olympic National Park, WA. Fall Shane Lewis
 Geo 327G Semester Project Landslide Suitability Assessment of Olympic National Park, WA Fall 2011 Shane Lewis 1 I. Problem Landslides cause millions of dollars of damage nationally every year, and are
GIS Project: Study on Gulf of Mexico basin provenance in Lower Miocene
 GIS Project: Study on Gulf of Mexico basin provenance in Lower Miocene Introduction Background: The Lower Miocene of the Gulf of Mexico (GOM) Basin is a transitional unit from many respects. It is a time
Final Project: Geodatabase of Mule Mountains Area, southeastern Arizona
 R. Aisner 11/24/09 GEO 386G Final Project: Geodatabase of Mule Mountains Area, southeastern Arizona Project goal: Develop a geodatabase with vector and raster data for future data organization and analysis.
Designing a Dam for Blockhouse Ranch. Haley Born
 Designing a Dam for Blockhouse Ranch Haley Born CE 394K GIS in Water Resources Term Paper Fall 2011 Table of Contents Introduction... 1 Data Sources... 2 Precipitation Data... 2 Elevation Data... 3 Geographic
Watershed Delineation
 Watershed Delineation Jessica L. Watkins, University of Georgia 2 April 2009 Updated by KC Love February 25, 2011 PURPOSE For this project, I delineated watersheds for the Coweeta synoptic sampling area
Sea Level Scare in South Carolina. by William Witmer GEO 327G 5 December 2016
 Sea Level Scare in South Carolina by William Witmer GEO 327G 5 December 2016 Problem Hilton Head Island in South Carolina attracts 2.5 million tourists every year. This popular locale features endangered
LANDSLIDE HAZARD ANALYSIS AND ITS EFFECT ON ENDANGERED SPECIES HABITATS, GRAND COUNTY, UTAH
 12/5/2016 LANDSLIDE HAZARD ANALYSIS AND ITS EFFECT ON ENDANGERED SPECIES HABITATS, GRAND COUNTY, UTAH GIS Final Project Ashlyn Murphy Fall 2016 1. Introduction and Problem A well-known geologic hazard
Using Earthscope and B4 LiDAR data to analyze Southern California s active faults
 Using Earthscope and B4 LiDAR data to analyze Southern California s active faults Exercise 8: Simple landscape morphometry and stream network delineation Introduction This exercise covers sample activities
Handling Raster Data for Hydrologic Applications
 Handling Raster Data for Hydrologic Applications Prepared by Venkatesh Merwade Lyles School of Civil Engineering, Purdue University vmerwade@purdue.edu January 2018 Objective The objective of this exercise
Trail Flow: Analysis of Drainage Patterns Affecting a Mountain Bike Trail
 Andy Belcher BAE 590 Professor Huffman 12.9.11 Location Trail Flow: Analysis of Drainage Patterns Affecting a Mountain Bike Trail The location of the project area rests in the Cary area of Wake County,
Water Volume Calculation of Hill Country Trinity Aquifer Blanco, Hays, and Travis Counties, Central Texas
 Water Volume Calculation of Hill Country Trinity Aquifer Blanco, Hays, and Travis Counties, Central Texas GIS and GPS Applications in Earth Science Saya Ahmed December, 2010 1 Introduction: Trinity Aquifer
The Looming Threat of Rising Sea Levels to the Florida Keys
 The Looming Threat of Rising Sea Levels to the Florida Keys 1. Introduction Sea levels are rising, and possibly faster than we thought before. In a recent report in 2017 by the National Oceanic and Atmospheric
Hydrology and Watershed Analysis
 Hydrology and Watershed Analysis Manual By: Elyse Maurer Reference Map Figure 1. This map provides context to the area of Washington State that is being focused on. The red outline indicates the boundary
Spatial analysis. 0 move the objects and the results change
 0 Outline: Roadmap 0 What is spatial analysis? 0 Transformations 0 Introduction to spatial interpolation 0 Classification of spatial interpolation methods 0 Interpolation methods 0 Areal interpolation
Overview key concepts and terms (based on the textbook Chang 2006 and the practical manual)
") Introduction Geo-information Science (GRS-10306) Overview key concepts and terms (based on the textbook 2006 and the practical manual) Introduction Chapter 1 Geographic information system (GIS) Geographically
Introduction Geo-information Science (GRS-10306) Overview key concepts and terms (based on the textbook 2006 and the practical manual) Introduction Chapter 1 Geographic information system (GIS) Geographically
How to Create Stream Networks using DEM and TauDEM
 How to Create Stream Networks using DEM and TauDEM Take note: These procedures do not describe all steps. Knowledge of ArcGIS, DEMs, and TauDEM is required. TauDEM software ( http://hydrology.neng.usu.edu/taudem/
Delineation of Watersheds
 Delineation of Watersheds Adirondack Park, New York by Introduction Problem Watershed boundaries are increasingly being used in land and water management, separating the direction of water flow such that
NWT Open Report Delineation of Watersheds in the Mackenzie Mountains
 NWT Open Report 2015-007 Delineation of Watersheds in the Mackenzie Mountains K.L. Pierce and H. Falck Recommended Citation: Pierce, K.L. and Falck, H., 2015. Delineation of watersheds in the Mackenzie
Volcanic Hazards of Mt Shasta
 Volcanic Hazards of Mt Shasta Introduction Mt Shasta is a volcano in the northern part of California. Although it has been recently inactive for over 10,000 years. However, its eruption would cause damage
Analysis of Sulfate and Chloride Concentrations
 Brazoria County, Texas Analysis of Sulfate and Chloride Concentrations By Agueda Matano GIS & GPS Applications in Earth Sciences December 1, 2012 I. Goal Analysis of sulfate and Chloride concentrations
Raster Data Enhancement and Tectonic Element Interpretation in ArcMap
 Raster Data Enhancement and Tectonic Element Interpretation in ArcMap Vsevolod Egorov ESRI Petroleum User Group Conference Houston, TX 2005 Abstract ArcMap Spatial Analyst provides quick, but powerful
Display data in a map-like format so that geographic patterns and interrelationships are visible
 Vilmaliz Rodríguez Guzmán M.S. Student, Department of Geology University of Puerto Rico at Mayagüez Remote Sensing and Geographic Information Systems (GIS) Reference: James B. Campbell. Introduction to
Using Ice Thickness and Bed Topography to Pick Field Sites Near Swiss Camp, Greenland
 Lauren Andrews 6 May 2010 GEO 386G: GIS final project Using Ice Thickness and Bed Topography to Pick Field Sites Near Swiss Camp, Greenland Problem Formulation My primary goal for this project is to map
ARCGIS PRO COURSE, APPLIED TO ENVIROMENTAL MANAGEMENT GIS. Course. Training. .com
 ARC PRO COURSE, APPLIED TO ENVIROMENTAL MANAGEMENT TYC Training Course.com TRAINING OVERVIEW This Arc Pro online course will provide a great deal of information about the link between earth s ecosystems
Terms GIS GPS Vector Data Model Raster Data Model Feature Attribute Table Point Line Polygon Pixel RGB Overlay Function
 FINAL REVIEW FOR GIS (2016) PRACTICAL COMPONENT The first 40 mins of the exam will be open book and will require you to make a map using all the techniques learned over the semester. This map will be e-mailed
Topographic Maps and Landforms Geology Lab
 Topographic Maps and Landforms Geology Lab Ray Rector: Instructor Today s Lab Activities 1) Discussion of Last Week s Lab 2) Lecture on Topo Maps and Elevation Contours 3) Construct Topographic Maps and
Effects of Rising Sea Levels on Coral Reef and Mangrove Distributions along the Great Barrier Reef in Australia
 Effects of Rising Sea Levels on Coral Reef and Mangrove Distributions along the Great Barrier Reef in Australia Sarah Barfield Graduate Student Department of Integrative Biology University of Texas, Austin
Delineation of high landslide risk areas as a result of land cover, slope, and geology in San Mateo County, California
 Delineation of high landslide risk areas as a result of land cover, slope, and geology in San Mateo County, California Introduction Problem Overview This project attempts to delineate the high-risk areas
Digital Elevation Models (DEM)
") Digital Elevation Models (DEM) Digital representation of the terrain surface enable 2.5 / 3D views Rule #1: they are models, not reality Rule #2: they always include some errors (subject to scale and data
Digital Elevation Models (DEM) Digital representation of the terrain surface enable 2.5 / 3D views Rule #1: they are models, not reality Rule #2: they always include some errors (subject to scale and data
Spatial Analysis II. Spatial data analysis Spatial analysis and inference
 Spatial Analysis II Spatial data analysis Spatial analysis and inference Roadmap Spatial Analysis I Outline: What is spatial analysis? Spatial Joins Step 1: Analysis of attributes Step 2: Preparing for
Hydrology and Floodplain Analysis, Chapter 10
 Hydrology and Floodplain Analysis, Chapter 10 Hydrology and Floodplain Analysis, Chapter 10.1 Introduction to GIS GIS Geographical Information System Spatial Data Data linked with geographical location
Using ArcGIS for Hydrology and Watershed Analysis:
 Using ArcGIS 10.2.2 for Hydrology and Watershed Analysis: A guide for running hydrologic analysis using elevation and a suite of ArcGIS tools Anna Nakae Feb. 10, 2015 Introduction Hydrology and watershed
PROANA A USEFUL SOFTWARE FOR TERRAIN ANALYSIS AND GEOENVIRONMENTAL APPLICATIONS STUDY CASE ON THE GEODYNAMIC EVOLUTION OF ARGOLIS PENINSULA, GREECE.
 PROANA A USEFUL SOFTWARE FOR TERRAIN ANALYSIS AND GEOENVIRONMENTAL APPLICATIONS STUDY CASE ON THE GEODYNAMIC EVOLUTION OF ARGOLIS PENINSULA, GREECE. Spyridoula Vassilopoulou * Institute of Cartography
Exercise 4. Watershed and Stream Network Delineation
 Exercise 4. Watershed and Stream Network Delineation GIS in Water Resources, Fall 2018 Prepared by David G Tarboton and David R. Maidment Revised 9 October, 2018 Purpose The purpose of this exercise is
Popular Mechanics, 1954
 Introduction to GIS Popular Mechanics, 1954 1986 $2,599 1 MB of RAM 2017, $750, 128 GB memory, 2 GB of RAM Computing power has increased exponentially over the past 30 years, Allowing the existence of
Raster Analysis: An Example
 Raster Analysis: An Example Fires (1 or 4) Slope (1-4) + Geology (1-4) Erosion Ranking (3-12) 1 Typical Raster Model Types: Suitability Modeling: Where is optimum location? Distance Modeling: What is the
GIS in Water Resources Fall 2015 CE 394K.3
 GIS in Water Resources Fall 2015 CE 394K.3 Term Project: Using GIS to apply Paramelle s method for finding ground water in karst terrain Patricia Bobeck December 4, 2015 1 Introduction and Background Jean-Baptiste
Introduction. Purpose
 Introduction The Edwards Aquifer is a karst aquifer in Central Texas whose hydrogeological properties are not fully understood. This is due to exaggerated heterogeneity of properties, high anisotropy due
OZ SEEBASE TM. Datasets. Digital Elevation Model
 Digital Elevation Model 10 Digital Elevation Models (DEM s) often show the youngest structures, and any active geological structures. They are widely used for neotectonic analysis. The composition of eroding
ADVANCE GIS ANALYSIS ON ZONAL URBAN PLAN PROJECT
 Journal of Young Scientist, Volume II, 2014 ISSN 2344-1283; ISSN CD-ROM 2344-1291; ISSN Online 2344-1305; ISSN-L 2344 1283 ADVANCE GIS ANALYSIS ON ZONAL URBAN PLAN PROJECT Andrei-Șerban TOMPEA 1 Scientific
Data Structures & Database Queries in GIS
 Data Structures & Database Queries in GIS Objective In this lab we will show you how to use ArcGIS for analysis of digital elevation models (DEM s), in relationship to Rocky Mountain bighorn sheep (Ovis
Natalie Cabrera GSP 370 Assignment 5.5 March 1, 2018
 Network Analysis: Modeling Overland Paths Using a Least-cost Path Model to Track Migrations of the Wolpertinger of Bavarian Folklore in Redwood National Park, Northern California Natalie Cabrera GSP 370
Applied Cartography and Introduction to GIS GEOG 2017 EL. Lecture-2 Chapters 3 and 4
 Applied Cartography and Introduction to GIS GEOG 2017 EL Lecture-2 Chapters 3 and 4 Vector Data Modeling To prepare spatial data for computer processing: Use x,y coordinates to represent spatial features
Hydrologic Engineering Applications of Geographic Information Systems
 Hydrologic Engineering Applications of Geographic Information Systems Davis, California Objectives: The participant will acquire practical knowledge and skills in the application of GIS technologies for
Raster Analysis; A Yellowstone Example 3/29/2018
 Fires (1 or 4) Typical Raster Model Types: Raster Analysis: An Example Suitability Modeling: Where is optimum location? Distance Modeling: What is the most efficient path from A to B? + Slope (1-4) Geology
Raster Analysis; A Yellowstone Example 10/24/2013. M. Helper GEO327G/386G, UT Austin 2. M. Helper GEO327G/386G, UT Austin 4
 + Fires (1 or 4) Slope (1-4) Geology (1-4) Erosion Ranking (3-12) Raster Analysis: An Example Typical Raster Model Types: Suitability Modeling: Where is optimum location? Distance Modeling: What is the
ArcGIS Pro: Essential Workflows STUDENT EDITION
 ArcGIS Pro: Essential Workflows STUDENT EDITION Copyright 2018 Esri All rights reserved. Course version 6.0. Version release date August 2018. Printed in the United States of America. The information contained
Effects of sea level rise on shallow atolls in the South Pacific
 Tuvalu 2100 Effects of sea level rise on shallow atolls in the South Pacific Kristin Vollmann GEO 327GG December 3, 20100 INTRODUCTION Residents of the tiny island nation of Tuvalu, withh a maximumm elevation
Title of Paper: Computational grid generation modeling transport of pathogens in Lake Michigan
 Title of Paper: Computational grid generation modeling transport of pathogens in Lake Michigan Authors Names: Peter N. Shedivy, Hector Bravo PhD Abstract: An estimated 1.2 million people, mostly young
Key Processes
 Data Manipulation and Extraction Key Processes Key Processes Re-Projecting Data Selecting by Attributes Exporting Data Hillshade Reclassification Conversion of Raster to Vector Re-Projecting Data Purpose
Volumes of Yellowstone s Rhyolite Lava Flows
 Volumes of Yellowstone s Rhyolite Lava Flows An ArcGIS Study of Pitchstone Plateau, Solfatara Plateau and Douglas Knob Dome Matt Williams December 2, 2011 GEO 327G Dr. Mark Helper Williams 1 I. Introduction
JJ Munoz. Explanation of the Project/Outline
 JJ Munoz Helper GEO 386G 1 December, 2016 GIS Project: Using ArcHydro and Surface Roughness tools to Determine Alluvial Fan Catchment Area Morphology Statistics from 1-meter resolution LiDAR DEM s. Explanation
Raster Analysis: An Example
 Raster Analysis: An Example Fires (1 or 4) Slope (1-4) + Geology (1-4) Erosion Ranking (3-12) 11/8/2016 GEO327G/386G, UT Austin 1 Typical Raster Model Types: Suitability Modeling: Where is optimum location?
Enhanced Subsurface Interpolation by Geological Cross-Sections by SangGi Hwang, PaiChai University, Korea
 Enhanced Subsurface Interpolation by Geological Cross-Sections by SangGi Hwang, PaiChai University, Korea Abstract Subsurface geological structures, such as bedding, fault planes and ore body, are disturbed
A GIS-based Approach to Watershed Analysis in Texas Author: Allison Guettner
 Texas A&M University Zachry Department of Civil Engineering CVEN 658 Civil Engineering Applications of GIS Instructor: Dr. Francisco Olivera A GIS-based Approach to Watershed Analysis in Texas Author:
Erosion Susceptibility in the area Around the Okanogan Fire Complex, Washington, US
 Erosion Susceptibility in the area Around the Okanogan Fire Complex, Washington, US 1. Problem Construct a raster that represents susceptibility to erosion based on lithology, slope, cover type, burned
ENGRG Introduction to GIS
 ENGRG 59910 Introduction to GIS Michael Piasecki March 17, 2014 Lecture 08: Terrain Analysis Outline: Terrain Analysis Earth Surface Representation Contour TIN Mass Points Digital Elevation Models Slope
Introduction to GIS - 2
 Introduction to GIS - 2 Outline Using GIS Representation of spatial objects in GIS Prof. D. Nagesh Kumar Department of Civil Engineering Indian Institute of Science Bangalore 560 012, India http://www.civil.iisc.ernet.in/~nagesh
MAPPING POTENTIAL LAND DEGRADATION IN BHUTAN
 MAPPING POTENTIAL LAND DEGRADATION IN BHUTAN Moe Myint, Geoinformatics Consultant Rue du Midi-8, CH-1196, Gland, Switzerland moemyint@bluewin.ch Pema Thinley, GIS Analyst Renewable Natural Resources Research
These modules are covered with a brief information and practical in ArcGIS Software and open source software also like QGIS, ILWIS.
 Online GIS Training and training modules covered are: 1. ArcGIS, Analysis, Fundamentals and Implementation 2. ArcGIS Web Data Sharing 3. ArcGIS for Desktop 4. ArcGIS for Server These modules are covered
Classification of Erosion Susceptibility
 GEO327G: GIS & GPS Applications in Earth Sciences Classification of Erosion Susceptibility Denali National Park, Alaska Zehao Xue 12 3 2015 2 TABLE OF CONTENTS 1 Abstract... 3 2 Introduction... 3 2.1 Universal
ENGRG Introduction to GIS
 ENGRG 59910 Introduction to GIS Michael Piasecki November 17, 2017 Lecture 11: Terrain Analysis Outline: Terrain Analysis Earth Surface Representation Contour TIN Mass Points Digital Elevation Models Slope
DEMs Downloading and projecting and using Digital Elevation Models (DEM)
") DEMs Downloading and projecting and using Digital Elevation Models (DEM) Introduction In this exercise, you will work with Digital Elevation Models (DEM). You will download a DEM in geographic coordinates
DEMs Downloading and projecting and using Digital Elevation Models (DEM) Introduction In this exercise, you will work with Digital Elevation Models (DEM). You will download a DEM in geographic coordinates
Measuring earthquake-generated surface offsets from high-resolution digital topography
 Measuring earthquake-generated surface offsets from high-resolution digital topography July 19, 2011 David E. Haddad david.e.haddad@asu.edu Active Tectonics, Quantitative Structural Geology, and Geomorphology
GIS in Water Resources Midterm Exam Fall 2008 There are 4 questions on this exam. Please do all 4.
 Page 1 of 8 Name: GIS in Water Resources Midterm Exam Fall 2008 There are 4 questions on this exam. Please do all 4. 1. Basic Concepts [20 points] Find the letter with the best answer for each term: 1.
Structure contours on Bone Spring Formation (Lower Permian), Delaware Basin
, Delaware Basin") Structure contours on Bone Spring Formation (Lower Permian), Delaware Basin By Ronald F. Broadhead and Lewis Gillard New Mexico Bureau of Geology and Mineral Resources, a division of New Mexico Tech, Socorro
Structure contours on Bone Spring Formation (Lower Permian), Delaware Basin By Ronald F. Broadhead and Lewis Gillard New Mexico Bureau of Geology and Mineral Resources, a division of New Mexico Tech, Socorro
Calhoun County, Texas Under 5 Meter Sea Level Rise
 Kyle Kacal GEO 327G Calhoun County, Texas Under 5 Meter Sea Level Rise PROBLEM AND PURPOSE: Sea level rise is threat to all coastal areas. Although natural sea level rise happens at a very slow rate, hurricanes
C5 Magnetic exploration methods data analysis techniques
 C5 Magnetic exploration methods data analysis techniques C5.1 Data processing and corrections After magnetic field data have been collected a number of corrections are applied to simplify the interpretation.
KEYSTONE PROPERTY GRAVITY GIS DATABASE. Residual Gravity Looking Down to Northwest
 KEYSTONE PROPERTY GRAVITY - 2018 GIS DATABASE Residual Gravity Looking Down to Northwest James L. Wright M.Sc. May 11, 2018 TABLE OF CONTENTS INTRODUCTION......................... 2 SURVEY PROCEDURE......................
LANDSLIDE RISK ASSESSMENT IN YOSEMITE NATIONAL PARK. Edna Rodriguez December 1 st, 2016 Final Project
 LANDSLIDE RISK ASSESSMENT IN YOSEMITE NATIONAL PARK Edna Rodriguez December 1 st, 2016 Final Project Table of Contents Introduction... 2 Data Collection... 2 Data Preprocessing... 3 ArcGIS Processing...
Case Study: Automated Knickpoint Identification in the Waipaoa River, North Island, New Zealand
 Case Study: Automated Knickpoint Identification in the Waipaoa River, North Island, New Zealand Introduction Knickpoints are a geomorphological phenomenon wherein the slope of a river changes dramatically
Geographic Information Systems. Introduction to Data and Data Sources
 Geographic Information Systems Introduction to Data and Data Sources Presented by John Showler, NJDA-SSCC NJ SCD GIS Training Session December 10, 209 The Objectives of this session are 3-fold: 1. Introduce
Exercise 4. Watershed and Stream Network Delineation
 Exercise 4. Watershed and Stream Network Delineation GIS in Water Resources, Fall 2014 Prepared by David G Tarboton and David R. Maidment Purpose The purpose of this exercise is to illustrate watershed
Goodbye Galveston. The Effects of Rising Sea Level on the. Coast of Galveston, TX. Maria Reistroffer GEO 327G
 Goodbye The Effects of Rising Sea Level on the Coast of, TX Maria Reistroffer GEO 327G 12/3/2015 Problem: Greenhouse gases contribute to global sea level rise and threaten human life, property, wildlife
Spatial Analyst. By Sumita Rai
 ArcGIS Extentions Spatial Analyst By Sumita Rai Overview What does GIS do? How does GIS work data models Extension to GIS Spatial Analyst Spatial Analyst Tasks & Tools Surface Analysis Surface Creation
Outline. Chapter 1. A history of products. What is ArcGIS? What is GIS? Some GIS applications Introducing the ArcGIS products How does GIS work?
 Outline Chapter 1 Introducing ArcGIS What is GIS? Some GIS applications Introducing the ArcGIS products How does GIS work? Basic data formats The ArcCatalog interface 1-1 1-2 A history of products Arc/Info
Applying GIS to Hydraulic Analysis
 Texas A&M University Department of Civil Engineering CVEN689 Applications of GIS to Civil Engineering Instructor: Francisco Olivera, Ph.D., P.E. Applying GIS to Hydraulic Analysis Lim, Chae Kwan April
Landslide & Debris Flow Hazard Assessment for Los Alamos County Following the Cerro Grande Fire, May 2000
 Landslide & Debris Flow Hazard Assessment for Los Alamos County Following the Cerro Grande Fire, May 2000 Will Woodruff GEO 386G: GIS & GPS Applications in the Earth Sciences Fall 2009 Introduction The
Intro to GIS In Review
 Intro to GIS In Review GIS Analysis Winter 2016 GIS A quarter in review Geographic data types Acquiring GIS data Projections / Coordinate systems Working with attribute tables Data classification Map design
What s New in Topographic Information - USGS National Map
 + What s New in Topographic Information - USGS National Map SARGIS Workshop November 14, 2016 Rob Dollison, 703-648-5724 rdollison@usgs.gov + USGS 2 National Geospatial Program The National Geospatial
Exercise 12 Spatial Analysis on Antarctica
 Exercise 12 Spatial Analysis on Antarctica Due: Tuesday, March 6 Goal: Using ArcMap s Spatial Analyst tools for digital elevation models and rasters. Datasets: Bed elevation Ice thickness Surface elevation
IMPERIAL COUNTY PLANNING AND DEVELOPMENT
 IMPERIAL COUNTY PLANNING AND DEVELOPMENT GEODATABASE USER MANUAL FOR COUNTY BUSINESS DEVELOPMENT GIS June 2010 Prepared for: Prepared by: County of Imperial Planning and Development 801 Main Street El
Task 1: Start ArcMap and add the county boundary data from your downloaded dataset to the data frame.
 Exercise 6 Coordinate Systems and Map Projections The following steps describe the general process that you will follow to complete the exercise. Specific steps will be provided later in the step-by-step
Tutorial 8 Raster Data Analysis
 Objectives Tutorial 8 Raster Data Analysis This tutorial is designed to introduce you to a basic set of raster-based analyses including: 1. Displaying Digital Elevation Model (DEM) 2. Slope calculations
Georeferencing the Lackawanna Synclinorium using GIS
 Georeferencing the Lackawanna Synclinorium using GIS Conservation Services, LLC 2/20/2010 Contact: Philip Pass 570.510.1758 Rick Marquardt 570-335-7525 Managing Partners: Conservation Services LLC Author:
Spatial Data Analysis in Archaeology Anthropology 589b. Kriging Artifact Density Surfaces in ArcGIS
 Spatial Data Analysis in Archaeology Anthropology 589b Fraser D. Neiman University of Virginia 2.19.07 Spring 2007 Kriging Artifact Density Surfaces in ArcGIS 1. The ingredients. -A data file -- in.dbf
GIS Quick Facts. CIVL 1101 GIS Quick Facts 1/5.
 CIVL 1101 1/5 What is GIS? Geographic Information Systems (GIS) provide a platform for displaying and analyzing spatial data. GIS systems allow you to view multiple layers of data simultaneously. GIS is
Mapping Sinkhole Susceptibility of Northwestern Arkansas
 Riley Winebarger May 1, 2018 Problem Statement Mapping Sinkhole Susceptibility of Northwestern Arkansas How accurate is digitally mapping sinkhole susceptibility, and how do different methods compare?
Working with Digital Elevation Models and Digital Terrain Models in ArcMap 9
 Working with Digital Elevation Models and Digital Terrain Models in ArcMap 9 1 TABLE OF CONTENTS INTRODUCTION...3 WORKING WITH DIGITAL TERRAIN MODEL (DTM) DATA FROM NRVIS, CITY OF KITCHENER, AND CITY OF
REMOTE SENSING AND GEOSPATIAL APPLICATIONS FOR WATERSHED DELINEATION
 REMOTE SENSING AND GEOSPATIAL APPLICATIONS FOR WATERSHED DELINEATION Gaurav Savant (gaurav@engr.msstate.edu) Research Assistant, Department of Civil Engineering, Lei Wang (lw4@ra.msstate.edu) Research
Creating Faulted Geologic Surfaces with ArcGIS
 What You Will Need ArcGIS 10.2 for Desktop (Basic, Standard, or Advanced license level) ArcGIS Geostatistical Analyst extension ArcGIS Spatial Analyst extension Sample dataset downloaded from esri.com/arcuser
GIS in Water Resources Midterm Exam Fall 2016 There are four questions on this exam. Please do all four. They are not all of equal weight.
 Page 1 of 7 Name: GIS in Water Resources Midterm Exam Fall 2016 There are four questions on this exam. Please do all four. They are not all of equal weight. Question 1. (20%) (a) Three key functions of
ArcHYDRO: GIS for Water Resources
 SOCRATES ERASMUS Intensive Programme ArcHYDRO: GIS for Water Resources Source: Center for Research in Water Resources, University of Texas at Austin Tutorial: Watershed and Stream Network Delineation Goals