Did Severe Rains and Flooding in May 2015 Affect Texas Poison Center Call Patterns?
|
|
|
- Alfred Hall
- 5 years ago
- Views:
Transcription
1 Did Severe Rains and Flooding in May 2015 Affect Texas Poison Center Call Patterns? Mathias Forrester Epidemiologist Texas Department of State Health Services (DSHS)
2 Background May 2015: Texas experienced torrential rains and widespread flooding, particularly over Memorial Day weekend More than 37 trillion gallons of water fell on the state Statewide average of 8.81 inches Wettest single month on record in Texas Tornado activity in a number of areas Resulting death toll of at least 31

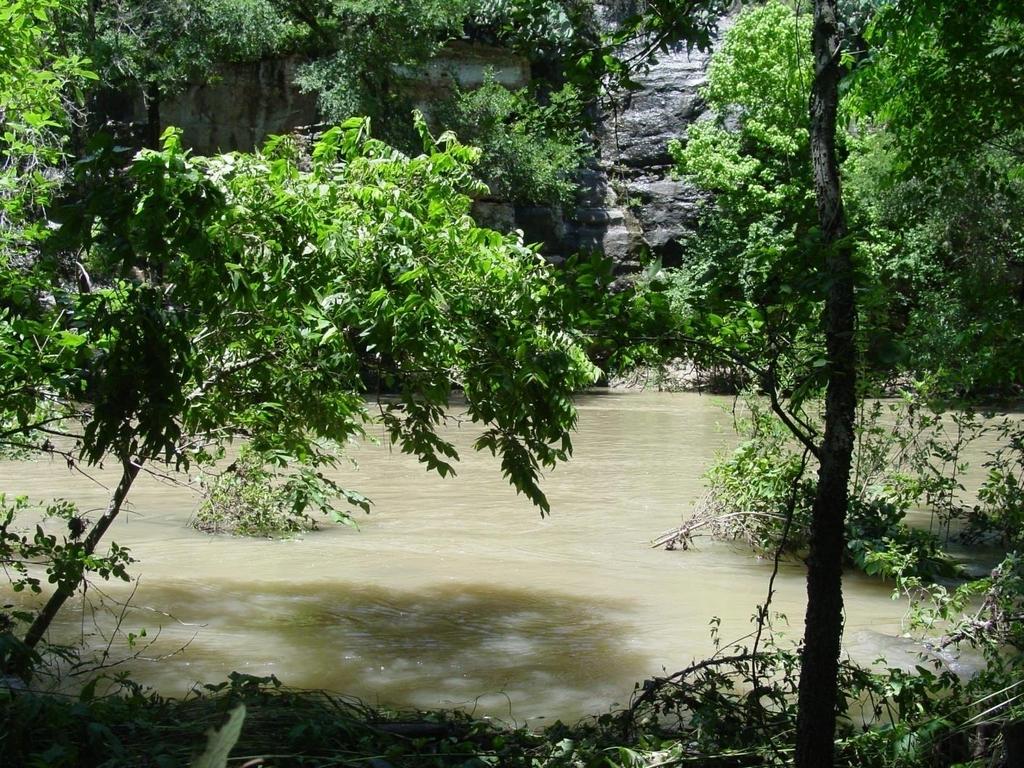
3 Background Blanco River

4 Background Austin
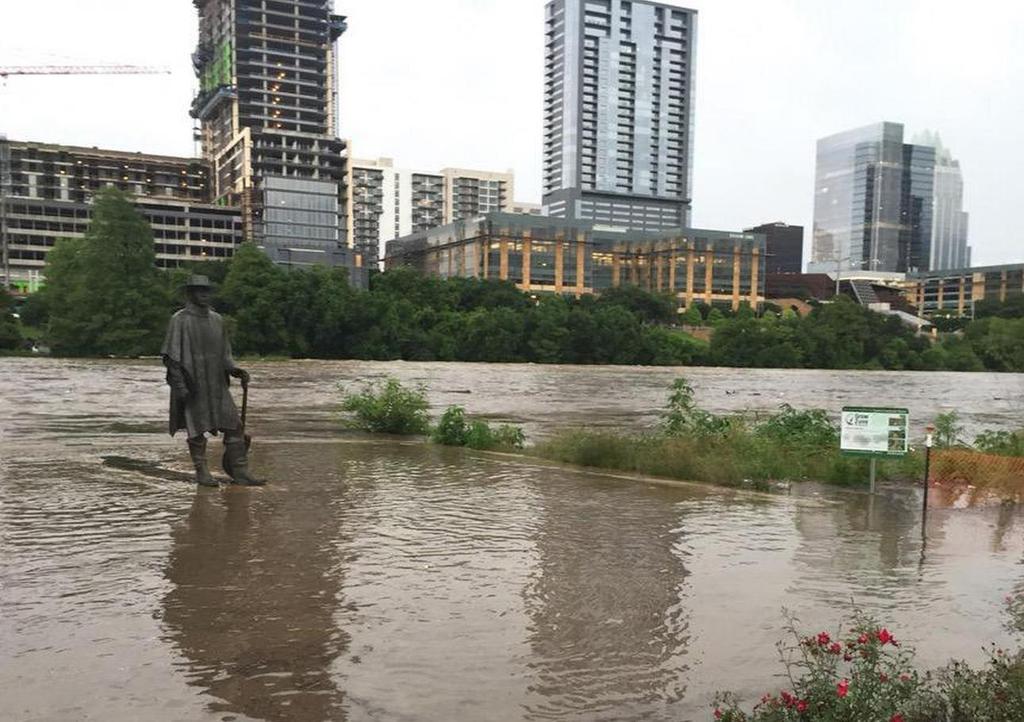
5 Background Austin
6 Background Austin

7 Background Houston
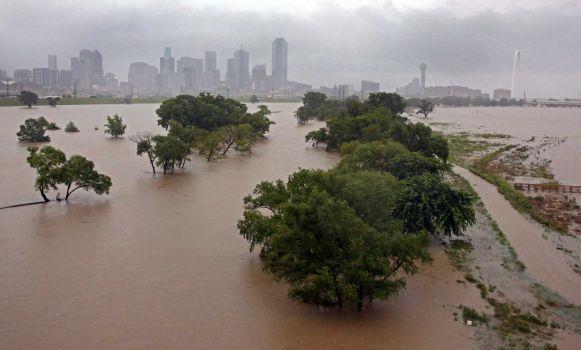
8 Background Dallas

9 Background San Antonio
10 Background May 2015 serious rains and flooding As of July 22, 2015, Governor Greg Abbott declared a disaster in 121 Texas counties (77% of Texas population in 2010 Census) As of July 31, 2015, a federal disaster declaration had been made covering 85 counties (58% of Texas population in 2010 Census)
11 Texas counties declared a state of disaster in response to severe weather, tornado, and flooding that began on May 4, 2015, by Governor (n=121 counties) Website:
12 Federal disaster declaration: Texas severe storms, tornadoes, straightline winds, and flooding, May 4, 2015-June 22, 2015 (n=85 counties) Type of assistance Individual assistance (n=11) Public assistance (n=38) Individual and public assistance (n=36) Website:
13 Background On June 16, 2015, Tropic Storm Bill made landfall on Matagorda Island, Texas, at 11:45am CDT, bringing additional rainfall and flooding

14 Background Tropical Storm Bill
15 Background United States poison centers: Telephone consultation services: provide information on and assist in the management of potentially adverse exposures to various substances Available 24/7/365 ( ) Agents are trained nurses, pharmacists, other healthcare professionals
16 Background Texas Poison Center Network (TPCN) 6 poison centers that service entire state Share a communications system so can answer one another s calls Share a single electronic database for collecting information on calls Database is replicated to DSHS daily
17 Location of 6 poison centers in the Texas Poison Center Network Amarillo! Texas Panhandle Poison Center! El Paso Temple!! Dallas North Texas Poison Center Southeast Texas Poison Center Central Texas Poison Center! San Antonio Galveston! South Texas Poison Center West Texas Regional Poison Center
18 Background Poison centers might experience changes, usually increases, in certain types of calls in relation to heavy rain and flooding Carbon monoxide Gasoline Water contamination Food poisoning Bites and stings
19 Background Changes in certain types of calls in relation to heavy rain and flooding has been observed with Texas Poison Center Network Hurricane Katrina Hurricane Rita Hurricane Ike
20 Background Changes observed by Texas Poison Center network in relation to other weather patterns Drought or high temperatures Heavy rains after dry spells As a consequence, DSHS Poison Control Program epidemiologist conducts environmental surveillance of particular types of calls
21 Background Environmental surveillance: calculation of monthly number of selected types of exposures since January 2000 Total exposures Carbon monoxide Gasoline Water contamination Plants
22 Background Environmental surveillance: calculation of monthly number of selected types of exposures since January 2000 (continued) Bites and stings: total, scorpions, snakes, spiders Pesticides: total, subgroups (insecticides, rodenticides, repellents, etc) Spreadsheet is distributed to select DSHS programs monthly
23 Methods Monthly number of selected environmental exposures reported to Texas Poison Center Network during January-November 2015 from 85 counties in federal disaster declaration was determined Mean monthly number of same environmental exposures determined for January-November for from same counties
24 Methods Centers for Disease Control and Prevention (CDC) conducts surveillance of US poison center data using 3-year period as reference Monthly 2015 data compared to mean monthly data
25 Results
26 Monthly number of carbon monoxide exposures reported to Texas Poison Center Network Number Jan Feb Mar Apr May Jun Jul Aug Sep Oct Nov Month mean 2015
27 Monthly number of gasoline exposures reported to Texas Poison Center Network 60 Number Jan Feb Mar Apr May Jun Jul Aug Sep Oct Nov Month mean 2015
28 Monthly number of plant exposures reported to Texas Poison Center Network Number Jan Feb Mar Apr May Jun Jul Aug Sep Oct Nov Month mean 2015
29 Monthly number of total bites and stings reported to Texas Poison Center Network Number Jan Feb Mar Apr May Jun Jul Aug Sep Oct Nov Month mean 2015
30 Monthly number of native venomous snake bites reported to Texas Poison Center Network 60 Number Jan Feb Mar Apr May Jun Jul Aug Sep Oct Nov Month mean 2015 Copperhead, rattlesnake, coral snake, cottonmouth
31 Monthly number of spider bites reported to Texas Poison Center Network 60 Number Jan Feb Mar Apr May Jun Jul Aug Sep Oct Nov Month mean 2015
32 Monthly number of total pesticide exposures reported to Texas Poison Center Network Number Jan Feb Mar Apr May Jun Jul Aug Sep Oct Nov Month mean 2015
33 Monthly number of insecticide exposures reported to Texas Poison Center Network 300 Number Jan Feb Mar Apr May Jun Jul Aug Sep Oct Nov Month mean 2015
34 Monthly number of rodenticide exposures reported to Texas Poison Center Network Number Jan Feb Mar Apr May Jun Jul Aug Sep Oct Nov Month mean 2015
35 Monthly number of animal repellent exposures reported to Texas Poison Center Network Number Jan Feb Mar Apr May Jun Jul Aug Sep Oct Nov Month mean 2015
36 Monthly number of insect repellent exposures reported to Texas Poison Center Network Number Jan Feb Mar Apr May Jun Jul Aug Sep Oct Nov Month mean 2015
37 Discussion Severe rains and flooding did not cause an increase in Texas poison center calls about exposures to carbon monoxide or gasoline, something that has been observed with tropical storms Storms had no clear impact on reported plant exposures
38 Discussion Total reported bites and stings were 38% lower in May 2015 than mean for May Lower than for any May going back to 2000 However, 2015 exposures were lower for every month except November, although percent difference was greatest for May Native venomous snake bites were 31% lower in May 2015 than for mean for corresponding month
39 Discussion Bites and stings (continued) Contrasts with news media that reported an increase in venomous snake bites seen at North Texas hospitals Spider bites lower in May 2015 than for corresponding month mean, but also lower for June-October
40 Discussion Total pesticide exposures were 12% higher in May 2015 than mean for May No clear increase for insecticides and rodenticides Animal repellents were 75% higher in May 2015 than mean for corresponding month for Corresponding increase was seen for insect repellents Increase was observed for April and June
41 Discussion Limitations Reporting these exposures to Texas Poison Center Network is voluntary Reporting may vary from year to year Relatively small monthly numbers for some of the exposures studied: a single multipleperson exposure can skew results Counties in federal declaration and not state declaration used: 20% population difference
42 Conclusions The heavy rains and flooding in May 2015 appear to have affected: The number of reported bites and stings, particularly native venomous snakes The number of reported pesticide exposures, particularly animal repellents
Monthly Long Range Weather Commentary Issued: May 15, 2014 Steven A. Root, CCM, President/CEO
 Monthly Long Range Weather Commentary Issued: May 15, 2014 Steven A. Root, CCM, President/CEO sroot@weatherbank.com APRIL 2014 REVIEW Climate Highlights The Month in Review The average temperature for
Monthly Long Range Weather Commentary Issued: SEPTEMBER 19, 2016 Steven A. Root, CCM, Chief Analytics Officer, Sr. VP,
 Monthly Long Range Weather Commentary Issued: SEPTEMBER 19, 2016 Steven A. Root, CCM, Chief Analytics Officer, Sr. VP, sroot@weatherbank.com SEPTEMBER 2016 Climate Highlights The Month in Review The contiguous
WHEN IS IT EVER GOING TO RAIN? Table of Average Annual Rainfall and Rainfall For Selected Arizona Cities
 WHEN IS IT EVER GOING TO RAIN? Table of Average Annual Rainfall and 2001-2002 Rainfall For Selected Arizona Cities Phoenix Tucson Flagstaff Avg. 2001-2002 Avg. 2001-2002 Avg. 2001-2002 October 0.7 0.0
Three main areas of work:
 Task 2: Climate Information 1 Task 2: Climate Information Three main areas of work: Collect historical and projected weather and climate data Conduct storm surge and wave modeling, sea-level rise (SLR)
Jackson County 2013 Weather Data
 Jackson County 2013 Weather Data 61 Years of Weather Data Recorded at the UF/IFAS Marianna North Florida Research and Education Center Doug Mayo Jackson County Extension Director 1952-2008 Rainfall Data
Champaign-Urbana 1998 Annual Weather Summary
 Champaign-Urbana 1998 Annual Weather Summary ILLINOIS STATE WATER SURVEY Audrey Bryan, Weather Observer 2204 Griffith Dr. Champaign, IL 61820 wxobsrvr@sparc.sws.uiuc.edu The development of the El Nìno
Short-Term Job Growth Impacts of Hurricane Harvey on the Gulf Coast and Texas
 Short-Term Job Growth Impacts of Hurricane Harvey on the Gulf Coast and Texas Keith Phillips & Christopher Slijk Federal Reserve Bank of Dallas San Antonio Branch The views expressed in this presentation
GAMINGRE 8/1/ of 7
 FYE 09/30/92 JULY 92 0.00 254,550.00 0.00 0 0 0 0 0 0 0 0 0 254,550.00 0.00 0.00 0.00 0.00 254,550.00 AUG 10,616,710.31 5,299.95 845,656.83 84,565.68 61,084.86 23,480.82 339,734.73 135,893.89 67,946.95
The Climate of Payne County
 The Climate of Payne County Payne County is part of the Central Great Plains in the west, encompassing some of the best agricultural land in Oklahoma. Payne County is also part of the Crosstimbers in the
The Climate of Bryan County
 The Climate of Bryan County Bryan County is part of the Crosstimbers throughout most of the county. The extreme eastern portions of Bryan County are part of the Cypress Swamp and Forest. Average annual
The Climate of Marshall County
 The Climate of Marshall County Marshall County is part of the Crosstimbers. This region is a transition region from the Central Great Plains to the more irregular terrain of southeastern Oklahoma. Average
The Climate of Texas County
 The Climate of Texas County Texas County is part of the Western High Plains in the north and west and the Southwestern Tablelands in the east. The Western High Plains are characterized by abundant cropland
Drought in Southeast Colorado
 Drought in Southeast Colorado Nolan Doesken and Roger Pielke, Sr. Colorado Climate Center Prepared by Tara Green and Odie Bliss http://climate.atmos.colostate.edu 1 Historical Perspective on Drought Tourism
Chiang Rai Province CC Threat overview AAS1109 Mekong ARCC
 Chiang Rai Province CC Threat overview AAS1109 Mekong ARCC This threat overview relies on projections of future climate change in the Mekong Basin for the period 2045-2069 compared to a baseline of 1980-2005.
Rainfall Observations in the Loxahatchee River Watershed
 Rainfall Observations in the Loxahatchee River Watershed Richard C. Dent Loxahatchee River District September 1997 Introduction Rain is a common occurrence in south Florida, yet its presence or absence
Champaign-Urbana 2001 Annual Weather Summary
 Champaign-Urbana 2001 Annual Weather Summary ILLINOIS STATE WATER SURVEY 2204 Griffith Dr. Champaign, IL 61820 wxobsrvr@sws.uiuc.edu Maria Peters, Weather Observer January: After a cold and snowy December,
The Climate of Pontotoc County
 The Climate of Pontotoc County Pontotoc County is part of the Crosstimbers. This region is a transition region from the Central Great Plains to the more irregular terrain of southeast Oklahoma. Average
Champaign-Urbana 2000 Annual Weather Summary
 Champaign-Urbana 2000 Annual Weather Summary ILLINOIS STATE WATER SURVEY 2204 Griffith Dr. Champaign, IL 61820 wxobsrvr@sws.uiuc.edu Maria Peters, Weather Observer January: January started on a mild note,
Jackson County 2018 Weather Data 67 Years of Weather Data Recorded at the UF/IFAS Marianna North Florida Research and Education Center
 Jackson County 2018 Weather Data 67 Years of Weather Data Recorded at the UF/IFAS Marianna North Florida Research and Education Center Doug Mayo Jackson County Extension Director 1952-2008 Rainfall Data
Texas Statewide Mesonet Network (TexMesonet) Dr. Kantave Greene 11/15/17
 Dr. Kantave Greene 11/15/17") Texas Statewide Mesonet Network (TexMesonet) Dr. Kantave Greene 11/15/17 1 Observe weather features Why Mesonets? Thunderstorms Squall lines Dry-lines Sea breezes Improve weather & flood forecasts Drought
Texas Statewide Mesonet Network (TexMesonet) Dr. Kantave Greene 11/15/17 1 Observe weather features Why Mesonets? Thunderstorms Squall lines Dry-lines Sea breezes Improve weather & flood forecasts Drought
The Climate of Kiowa County
 The Climate of Kiowa County Kiowa County is part of the Central Great Plains, encompassing some of the best agricultural land in Oklahoma. Average annual precipitation ranges from about 24 inches in northwestern
Monthly Long Range Weather Commentary Issued: NOVEMBER 16, 2015 Steven A. Root, CCM, Chief Analytics Officer, Sr. VP, sales
 Monthly Long Range Weather Commentary Issued: NOVEMBER 16, 2015 Steven A. Root, CCM, Chief Analytics Officer, Sr. VP, sales sroot@weatherbank.com OCTOBER 2015 Climate Highlights The Month in Review The
The Climate of Seminole County
 The Climate of Seminole County Seminole County is part of the Crosstimbers. This region is a transition region from the Central Great Plains to the more irregular terrain of southeastern Oklahoma. Average
The Climate of Haskell County
 The Climate of Haskell County Haskell County is part of the Hardwood Forest. The Hardwood Forest is characterized by its irregular landscape and the largest lake in Oklahoma, Lake Eufaula. Average annual
The Climate of Murray County
 The Climate of Murray County Murray County is part of the Crosstimbers. This region is a transition between prairies and the mountains of southeastern Oklahoma. Average annual precipitation ranges from
Current Climate Trends and Implications
 Current Climate Trends and Implications Dr. Mark Seeley Professor emeritus Department of Soil, Water, and Climate University of Minnesota St Paul, MN 55108 Crop Insurance Conference September 12, 2018
The Climate of Grady County
 The Climate of Grady County Grady County is part of the Central Great Plains, encompassing some of the best agricultural land in Oklahoma. Average annual precipitation ranges from about 33 inches in northern
Monthly Long Range Weather Commentary Issued: February 15, 2015 Steven A. Root, CCM, President/CEO
 Monthly Long Range Weather Commentary Issued: February 15, 2015 Steven A. Root, CCM, President/CEO sroot@weatherbank.com JANUARY 2015 Climate Highlights The Month in Review During January, the average
Local Ctimatotogical Data Summary White Hall, Illinois
 SWS Miscellaneous Publication 98-5 STATE OF ILLINOIS DEPARTMENT OF ENERGY AND NATURAL RESOURCES Local Ctimatotogical Data Summary White Hall, Illinois 1901-1990 by Audrey A. Bryan and Wayne Armstrong Illinois
Memo. I. Executive Summary. II. ALERT Data Source. III. General System-Wide Reporting Summary. Date: January 26, 2009 To: From: Subject:
 Memo Date: January 26, 2009 To: From: Subject: Kevin Stewart Markus Ritsch 2010 Annual Legacy ALERT Data Analysis Summary Report I. Executive Summary The Urban Drainage and Flood Control District (District)
Mountain View Community Shuttle Monthly Operations Report
 Mountain View Community Shuttle Monthly Operations Report December 6, 2018 Contents Passengers per Day, Table...- 3 - Passengers per Day, Chart...- 3 - Ridership Year-To-Date...- 4 - Average Daily Ridership
Monthly Long Range Weather Commentary Issued: APRIL 18, 2017 Steven A. Root, CCM, Chief Analytics Officer, Sr. VP,
 Monthly Long Range Weather Commentary Issued: APRIL 18, 2017 Steven A. Root, CCM, Chief Analytics Officer, Sr. VP, sroot@weatherbank.com MARCH 2017 Climate Highlights The Month in Review The average contiguous
ARUBA CLIMATOLOGICAL SUMMARY 2017 PRECIPITATION
 ARUBA CLIMATOLOGICAL SUMMARY 2017 PRECIPITATION The total amount of rainfall recorded at Reina Beatrix International Airport for the year 2017 was 391.0 mm. This is 17.1 % below normal ( Figure 1 ). During
2003 Water Year Wrap-Up and Look Ahead
 2003 Water Year Wrap-Up and Look Ahead Nolan Doesken Colorado Climate Center Prepared by Odie Bliss http://ccc.atmos.colostate.edu Colorado Average Annual Precipitation Map South Platte Average Precipitation
The Pennsylvania Observer
 The Pennsylvania Observer May 31, 2012 May 2012 - Pennsylvania Weather Recap By: Paul Knight The majority of the fifth month had temperatures averaging well above seasonal levels with two distinct hot
Champaign-Urbana 1999 Annual Weather Summary
 Champaign-Urbana 1999 Annual Weather Summary ILLINOIS STATE WATER SURVEY 2204 Griffith Dr. Champaign, IL 61820 wxobsrvr@sws.uiuc.edu Maria Peters, Weather Observer A major snowstorm kicked off the new
Jackson County 2014 Weather Data
 Jackson County 2014 Weather Data 62 Years of Weather Data Recorded at the UF/IFAS Marianna North Florida Research and Education Center Doug Mayo Jackson County Extension Director 1952-2008 Rainfall Data
Daily Operations Briefing December 25, 2012 As of 6:30 a.m. EST
 Daily Operations Briefing December 25, 2012 As of 6:30 a.m. EST 1 Significant Activity: Dec 24-25 Significant Events: Possible Severe thunderstorms - Gulf Coast Sandy/Nor easter recovery Significant Weather:
Colorado s 2003 Moisture Outlook
 Colorado s 2003 Moisture Outlook Nolan Doesken and Roger Pielke, Sr. Colorado Climate Center Prepared by Tara Green and Odie Bliss http://climate.atmos.colostate.edu How we got into this drought! Fort
Final Report. COMET Partner's Project. University of Texas at San Antonio
 Final Report COMET Partner's Project University: Name of University Researcher Preparing Report: University of Texas at San Antonio Dr. Hongjie Xie National Weather Service Office: Name of National Weather
Drought. Jeffrey Lindner Meteorologist Harris County Flood Control District September 20, 2011
 2010-2011 Drought Jeffrey Lindner Meteorologist Harris County Flood Control District September 20, 2011 Texas Annual Rainfall Texas Annual Rainfall 1895-2010 Texas Annual Temperature 1895-2010 Notice Any
Multi-Jurisdictional Hazard Mitigation Plan. Table C.17 Disaster Declarations or Proclamations Affecting Perry County Presidential & Gubernatorial
 Severe Weather General Severe weather affects the entire Commonwealth and can be expected any time of the year. Severe weather for Perry County is considered to include: blizzards and/or heavy snowfall,
What Does It Take to Get Out of Drought?
 What Does It Take to Get Out of Drought? Nolan J. Doesken Colorado Climate Center Colorado State University http://ccc.atmos.colostate.edu Presented at the Insects, Diseases and Drought Workshop, May 19,
A Preliminary Severe Winter Storms Climatology for Missouri from
 A Preliminary Severe Winter Storms Climatology for Missouri from 1960-2010 K.L. Crandall and P.S Market University of Missouri Department of Soil, Environmental and Atmospheric Sciences Introduction The
2003 Moisture Outlook
 2003 Moisture Outlook Nolan Doesken and Roger Pielke, Sr. Colorado Climate Center Prepared by Tara Green and Odie Bliss http://climate.atmos.colostate.edu Through 1999 Through 1999 Fort Collins Total Water
January 25, Summary
 January 25, 2013 Summary Precipitation since the December 17, 2012, Drought Update has been slightly below average in parts of central and northern Illinois and above average in southern Illinois. Soil
February 10, Mr. Jeff Smith, Chairman Imperial Valley Water Authority E County Road 1000 N Easton, IL Dear Chairman Smith:
 February 1, 1 Mr. Jeff Smith, Chairman Imperial Valley Water Authority 8 E County Road 1 N Easton, IL Dear Chairman Smith: The Illinois State Water Survey (ISWS), under contract to the Imperial Valley
Public Library Use and Economic Hard Times: Analysis of Recent Data
 Public Library Use and Economic Hard Times: Analysis of Recent Data A Report Prepared for The American Library Association by The Library Research Center University of Illinois at Urbana Champaign April
Monthly Long Range Weather Commentary Issued: SEPTEMBER 19, 2015 Steven A. Root, CCM, Chief Analytics Officer, Sr. VP, sales
 Monthly Long Range Weather Commentary Issued: SEPTEMBER 19, 2015 Steven A. Root, CCM, Chief Analytics Officer, Sr. VP, sales sroot@weatherbank.com AUGUST 2015 Climate Highlights The Month in Review The
Stream Discharge and the Water Budget
 Regents Earth Science Unit 6: Water Cycle & Climate Name: Lab # Stream Discharge and the Water Budget Introduction: The United States Geological Survey (USGS) measures and publishes values for the daily
Significant Rainfall and Peak Sustained Wind Estimates For Downtown San Francisco
 Significant Rainfall and Peak Sustained Wind Estimates For Downtown San Francisco Report Prepared by John P. Monteverdi, PhD, CCM July 30, 1998 Mayacamas Weather Consultants 1. Impact of Location The location
Monthly Long Range Weather Commentary Issued: APRIL 25, 2016 Steven A. Root, CCM, Chief Analytics Officer, Sr. VP, sales
 Monthly Long Range Weather Commentary Issued: APRIL 25, 2016 Steven A. Root, CCM, Chief Analytics Officer, Sr. VP, sales sroot@weatherbank.com MARCH 2016 Climate Highlights The Month in Review The March
What is happening to the Jamaican climate?
 What is happening to the Jamaican climate? Climate Change and Jamaica: Why worry? Climate Studies Group, Mona (CSGM) Department of Physics University of the West Indies, Mona Part 1 RAIN A FALL, BUT DUTTY
National Integrated Drought Information System. Southeast US Pilot for Apalachicola- Flint-Chattahoochee River Basin 20-March-2012
 National Integrated Drought Information System Southeast US Pilot for Apalachicola- Flint-Chattahoochee River Basin 20-March-2012 Current drought status from Drought Monitor http://www.drought.unl.edu/dm/monitor.html
A Review of the 2007 Water Year in Colorado
 A Review of the 2007 Water Year in Colorado Nolan Doesken Colorado Climate Center, CSU Mike Gillespie Snow Survey Division, USDA, NRCS Presented at the 28 th Annual AGU Hydrology Days, March 26, 2008,
2011 Year in Review TORNADOES
 2011 Year in Review The year 2011 had weather events that will be remembered for a long time. Two significant tornado outbreaks in April, widespread damage and power outages from Hurricane Irene in August
2015 Fall Conditions Report
 2015 Fall Conditions Report Prepared by: Hydrologic Forecast Centre Date: December 21 st, 2015 Table of Contents Table of Figures... ii EXECUTIVE SUMMARY... 1 BACKGROUND... 2 SUMMER AND FALL PRECIPITATION...
The Colorado Drought : 2003: A Growing Concern. Roger Pielke, Sr. Colorado Climate Center.
 The Colorado Drought 2001-2003: 2003: A Growing Concern Roger Pielke, Sr. Colorado Climate Center Prepared by Tara Green and Odie Bliss http://climate.atmos.colostate.edu 2 2002 Drought History in Colorado
A Recap of Colorado s Water Year 2018
 A Recap of Colorado s Water Year 2018 For further inquiries, please contact: Russ Schumacher, State Climatologist (970) 491-8084 Becky Bolinger, Assistant State Climatologist (970) 491-8506 Peter Goble,
Extreme Rainfall in the Southeast U.S.
 Extreme Rainfall in the Southeast U.S. David F. Zierden Florida State Climatologist Center for Ocean Atmospheric Prediction Studies The Florida State University March 7, 2016 Causes of Extreme Rainfall
Changing Hydrology under a Changing Climate for a Coastal Plain Watershed
 Changing Hydrology under a Changing Climate for a Coastal Plain Watershed David Bosch USDA-ARS, Tifton, GA Jeff Arnold ARS Temple, TX and Peter Allen Baylor University, TX SEWRU Objectives 1. Project changes
SEPTEMBER 2013 REVIEW
 Monthly Long Range Weather Commentary Issued: October 21, 2013 Steven A. Root, CCM, President/CEO sroot@weatherbank.com SEPTEMBER 2013 REVIEW Climate Highlights The Month in Review The average temperature
Missouri River Basin Water Management
 Missouri River Basin Water Management US Army Corps of Engineers Missouri River Navigator s Meeting February 12, 2014 Bill Doan, P.E. Missouri River Basin Water Management US Army Corps of Engineers BUILDING
CAMARGO RANCH, llc. CRAIG BUFORD BufordResources.com
 CAMARGO RANCH, llc 2897 +/- acre Wheat & Cattle Farm Mangum, greer county, oklahoma CRAIG BUFORD 405-833-9499 BufordResources.com 4101 Perimeter Center Dr., Suite 107 Oklahoma City, OK 73112 405.833.9499
COUNTRY REPORT. Jakarta. July, th National Directorate of Meteorology and Geophysics of Timor-Leste (DNMG)
") The Southeastern Asia-Oceania Flash Flood COUNTRY REPORT Jakarta. July, 10-12 th 2017 National Directorate of Meteorology and Geophysics of Timor-Leste (DNMG) Carla Feritas and Crisostimo Lobato Democratic
The Southeastern Asia-Oceania Flash Flood COUNTRY REPORT Jakarta. July, 10-12 th 2017 National Directorate of Meteorology and Geophysics of Timor-Leste (DNMG) Carla Feritas and Crisostimo Lobato Democratic
Tornado Hazard Risk Analysis: A Report for Rutherford County Emergency Management Agency
 Tornado Hazard Risk Analysis: A Report for Rutherford County Emergency Management Agency by Middle Tennessee State University Faculty Lisa Bloomer, Curtis Church, James Henry, Ahmad Khansari, Tom Nolan,
PROJECT REPORT (ASL 720) CLOUD CLASSIFICATION
 CLOUD CLASSIFICATION") PROJECT REPORT (ASL 720) CLOUD CLASSIFICATION SUBMITTED BY- PRIYANKA GUPTA 2011CH70177 RINI KAPOOR 2011CH70179 INDIVIDUAL CONTRIBUTION- Priyanka Gupta- analysed data of region considered in India (West:80,
PROJECT REPORT (ASL 720) CLOUD CLASSIFICATION SUBMITTED BY- PRIYANKA GUPTA 2011CH70177 RINI KAPOOR 2011CH70179 INDIVIDUAL CONTRIBUTION- Priyanka Gupta- analysed data of region considered in India (West:80,
PROGRESS ACCOMPLISHED THIS PERIOD
 Semi-Annual Report Period Covered: September 1, 21 through February 28, 217 Prepared By: Richard Radigan Title: Monitoring of a Constructed Oyster Reef in the St. Lucie Estuary Agency: Florida Fish & Wildlife
Average 175, , , , , , ,046 YTD Total 1,098,649 1,509,593 1,868,795 1,418, ,169 1,977,225 2,065,321
 AGRICULTURE 01-Agriculture JUL 2,944-4,465 1,783-146 102 AUG 2,753 6,497 5,321 1,233 1,678 744 1,469 SEP - 4,274 4,183 1,596 - - 238 OCT 2,694 - - 1,032 340-276 NOV 1,979-5,822 637 3,221 1,923 1,532 DEC
Average 175, , , , , , ,940 YTD Total 944,460 1,284,944 1,635,177 1,183, ,954 1,744,134 1,565,640
 AGRICULTURE 01-Agriculture JUL 2,944-4,465 1,783-146 102 AUG 2,753 6,497 5,321 1,233 1,678 744 1,469 SEP - 4,274 4,183 1,596 - - 238 OCT 2,694 - - 1,032 340-276 NOV 1,979-5,822 637 3,221 1,923 1,532 DEC
Jackson County 2019 Weather Data 68 Years of Weather Data Recorded at the UF/IFAS Marianna North Florida Research and Education Center
 Jackson County 2019 Weather Data 68 Years of Weather Data Recorded at the UF/IFAS Marianna North Florida Research and Education Center Doug Mayo Jackson County Extension Director 1952-2008 Rainfall Data
National Integrated Drought Information System Southeast US Pilot for Apalachicola- Flint-Chattahoochee River Basin. 22 May 2012
 National Integrated Drought Information System Southeast US Pilot for Apalachicola- Flint-Chattahoochee River Basin 22 May 2012 Outline Welcome Keith Ingram, UF, Southeast Climate Consortium Current drought
Monthly Long Range Weather Commentary Issued: APRIL 1, 2015 Steven A. Root, CCM, President/CEO
 Monthly Long Range Weather Commentary Issued: APRIL 1, 2015 Steven A. Root, CCM, President/CEO sroot@weatherbank.com FEBRUARY 2015 Climate Highlights The Month in Review The February contiguous U.S. temperature
Florida Courts E-Filing Authority Board. Service Desk Report March 2019
 Florida Courts E-Filing Authority Board Service Desk Report March 219 Customer Service Incidents March 219 Status January 219 February 219 March 219 Incidents Received 3,261 3,51 3,118 Incidents Worked
Climate Change and Water Supply Research. Drought Response Workshop October 8, 2013
 Climate Change and Water Supply Research Drought Response Workshop October 8, 2013 DWR Photo Oroville Reservoir, 2009 Talk Overview Expectations History Atmospheric Rivers and Water Supply Current Research
ACCUMULATED PRECIPITATION IN INCHES
 CUMULATIVE PRECIPITATION WATER YEAR 9 COLUMBIA BASIN ABOVE GRAND COULEE 87% of Normal 1971- Average ACCUMULATED PRECIPITATION IN INCHES 8 6 97% of Normal 94% of Normal 77% of Normal SNAKE RIVER BASIN ABOVE
NOAA National Centers for Environmental Information State Summaries 149-TX. Observed and Projected Temperature Change
 19-TX TEXAS Key Messages Mean annual temperature has increased by approximately 1 F since the first half of the th century. Under a higher emissions pathway, historically unprecedented warming is projected
ENGINE SERIAL NUMBERS
 ENGINE SERIAL NUMBERS The engine number was also the serial number of the car. Engines were numbered when they were completed, and for the most part went into a chassis within a day or so. However, some
MISSION DEBRIEFING: Teacher Guide
 Activity 2: It s Raining Again?! Using real data from one particular location, students will interpret a graph that relates rainfall to the number of cases of malaria. Background The relationship between
Weather and Climate of the Rogue Valley By Gregory V. Jones, Ph.D., Southern Oregon University
 Weather and Climate of the Rogue Valley By Gregory V. Jones, Ph.D., Southern Oregon University The Rogue Valley region is one of many intermountain valley areas along the west coast of the United States.
Tropical Cyclone Warning System in the Philippines
 Republic of the Philippines Department of Science and Technology PHILIPPINE ATMOSPHERIC GEOPHYSICAL AND ASTRONOMICAL SERVICES ADMINISTRAION (PAGASA) Science Garden Compound, Agham Road, Diliman, Quezon
NatGasWeather.com Daily Report
 NatGasWeather.com Daily Report Issue Time: 5:15 pm EST Sunday, February 28 th, 2016 for Monday, Feb 29 th 7-Day Weather Summary (February 28 th March 5 th ): High pressure will dominate much of the US
ACCUMULATED PRECIPITATION IN INCHES
 4 3 CUMULATIVE PRECIPITATION WATER YEAR 7 COLUMBIA BASIN ABOVE GRAND COULEE 18% of Normal 1971- Average ACCUMULATED PRECIPITATION IN INCHES 1 3 1 4 3 1 8 6 4 94% of Normal 17% of Normal 118% of Normal
Hydrologic Conditions in the Delaware River Basin
 Hydrologic Conditions in the Delaware River Basin April : Flooding in Lambertville, New Jersey Aerial photo used with permission of www.elevated-images.com Annual Report Prepared by Operations Staff June
Over the course of this unit, you have learned about different
 70 People and Weather TA L K I N G I T O V E R Over the course of this unit, you have learned about different aspects of earth s weather and atmosphere. Atmospheric scientists, climatologists, hydrologists,
UPDATE OF REGIONAL WEATHER AND SMOKE HAZE (December 2017)
") UPDATE OF REGIONAL WEATHER AND SMOKE HAZE (December 2017) 1. Review of Regional Weather Conditions for November 2017 1.1 In November 2017, Southeast Asia experienced inter-monsoon conditions in the first
UPDATE OF REGIONAL WEATHER AND SMOKE HAZE (December 2017) 1. Review of Regional Weather Conditions for November 2017 1.1 In November 2017, Southeast Asia experienced inter-monsoon conditions in the first
Saudi Arabia. July present. Desert Locust Information Service FAO, Rome Red Sea coast outbreak
 Saudi Arabia July 2016 - present coast outbreak Desert Locust Information Service FAO, Rome www.fao.org/ag/locusts Keith Cressman (Senior Locust Forecasting Officer) updated: 24 January 2017 undetected
ovember 2008 Antigua and Barbuda Meteorological Service
 ovember 2008 Antigua and Barbuda Meteorological Service The Atlantic Hurricane Season Summary 2008 Special Focus on Antigua and Barbuda The Season in Brief Sixteen (16) named storms formed in the Atlantic
Minnesota s Climatic Conditions, Outlook, and Impacts on Agriculture. Today. 1. The weather and climate of 2017 to date
 Minnesota s Climatic Conditions, Outlook, and Impacts on Agriculture Kenny Blumenfeld, State Climatology Office Crop Insurance Conference, Sep 13, 2017 Today 1. The weather and climate of 2017 to date
KANSAS CLIMATE SUMMARY October 2016
 KANSAS CLIMATE SUMMARY October 2016 Record warmth Temperatures continued the warmer than normal pattern through much of October. The state-wide average temperature was 60.9 of, or 5.6 degrees warmer than
Local Precipitation Variability
 Local Precipitation Variability Precipitation from one storm can vary from neighborhood to neighborhood. What falls in your yard may not fall in the next. The next time it rains see how the precipitation
Hurricane Harvey: SE Texas Impacts. 10 AM CDT UPDATE Saturday, August 26, 2017 Prepared by: Dan Reilly, Brian Kyle
 Hurricane Harvey: SE Texas Impacts 10 AM CDT UPDATE Saturday, August 26, 2017 Prepared by: Dan Reilly, Brian Kyle Latest Observations and Radar Hurricane Harvey centered near Victoria and weakening Wind
October Precipitation Statistics (124 Years) Rank: Figure 2: Historical October precipitation time series for Maryland.
 Rank: Figure 2: Historical October precipitation time series for Maryland.") PRECIPITATION Based on the National Centers for Environmental Information (NCEI), Office of the Maryland State the statewide total October precipitation was 3.88 inches, which was 1.01 inches less than
PRECIPITATION Based on the National Centers for Environmental Information (NCEI), Office of the Maryland State the statewide total October precipitation was 3.88 inches, which was 1.01 inches less than
Climate Change and Climate Trends in Our Own Backyard
 Climate Change and Climate Trends in Our Own Backyard Dr. Mark Seeley Department of Soil, Water, and Climate University of Minnesota St Paul, MN 55108 For IATP: Rural Climate Dialogue Grand Rapids, MN
Midwest and Great Plains Climate and Drought Update
 Midwest and Great Plains Climate and Drought Update June 20,2013 Laura Edwards Climate Field Specialist Laura.edwards@sdstate.edu 605-626-2870 2012 Board of Regents, South Dakota State University General
GTR # VLTs GTR/VLT/Day %Δ:
 MARYLAND CASINOS: MONTHLY REVENUES TOTAL REVENUE, GROSS TERMINAL REVENUE, WIN/UNIT/DAY, TABLE DATA, AND MARKET SHARE CENTER FOR GAMING RESEARCH, DECEMBER 2017 Executive Summary Since its 2010 casino debut,
Daily Operations Briefing Tuesday, November 5, :30 a.m. EST
 Daily Operations Briefing Tuesday, November 5, 2013 8:30 a.m. EST 1 Significant Activity: Nov 4 5 Significant Events: None Tropical Activity: Atlantic No tropical cyclone activity expected next 48 hours
UNDERSTANDING STORM TIDES
 UNDERSTANDING STORM TIDES Run from the water, hide from the wind.. CATEGORY CATEGORY CATEGORY CATEGORY CATEGORY 1 2 3 4 5 WIND 74-95 mph 64-82 knots 96-110 mph 83-95 knots 111-130 mph 96-113 knots 131-155
Severe Weather Potential for Southeast Texas
 Severe Weather Potential for Southeast Texas Dan Reilly, Kent Prochazka, Scott Overpeck National Weather Service Houston/Galveston 10 am Synopsis Storm to likely bring severe weather to Southeast Texas
Hurricanes in the Gulf of Mexico: The History and Future of the Texas Coast
 # 82 Hurricanes in the Gulf of Mexico: The History and Future of the Texas Coast Dr. Kerry Emanuel January 8, 2013 Produced by and for Hot Science - Cool Talks by the Environmental Science Institute. We