RGB Products: an easy and practical way to display multispectral satellite data (in combination with derived products)
|
|
|
- Heather Hensley
- 6 years ago
- Views:
Transcription


1 RGB Products: an easy and practical way to display multispectral satellite data (in combination with derived products) Dr. Jochen Kerkmann Training Officer EUMETSAT
 Met-10 (0) Met-08 (41.")
2 Multi-channel GEO satellites today Him-08 (140.7 E) GOES-16 (89.5 W) Met-10 (0) Met-08 (41.5 E) Credits: HP Roesli 20 March 2017, First Global Airmass RGB Composite
3 How to display multispectral data? Why do we need RGB products, when we have derived (cloud) products?


4 Multispectral view of tomatoes & clouds No rain Rain Credits: Prof. Danny Rosenfeld, Jerusalem (HUJ)

5 MODIS Airborne Simulator-L1B Jul :44 GMT Caribbean Sea Flight level 20 km Resolution 50 m at NADIR Swath ± 45, With=37 km Red: 0.63 mm Green: 2.06 mm Blue: 2.11/2.21 mm Credits: Prof. Danny Rosenfeld, Jerusalem (HUJ) 12/20/2017

6 Cloud Properties seen in Day Microphysics RGB Cirrus with large crystals Nimbus Layer clouds of large water drops Dissipating Nimbus warm large ice particles snow surface Mixed phase layer clouds Snow in the air downhill the stau cloud after its supercooled cloud drops evaporated 8 October 2003, 12:00 UTC Source: D. Rosenfeld


7 Comparison 1: RGBs vs Cloud Type Product 2 1 Cloud Type Product Texture gets lost, no cloud phase info Met-8, 21 March 2007, 12:00 UTC Day Microphysics RGB
 overlaid on Ash RGB 15 April 2010, 09:00-15:00 UTC Source: M.")
8 Comparison 2: RGBs + Ash Product Best use: RGBs + Derived Product Derived product (ash mask) overlaid on Ash RGB 15 April 2010, 09:00-15:00 UTC Source: M. Pavolonis
9 Main Improvements from multi-channel (GEO) Imagers


10 New Generation Improvements: Clouds at Night India Fog/Low Stratus (night) AHI IR10.4 Channel AHI Night Micro RGB

11 New Generation Improvements: Vegetation Grassland Rice Fields MFG VIS Channel MSG Natural Colours RGB


12 New Generation Improvements: Cloud / Snow Discrimination Fog MFG VIS Channel MSG RGB NIR1.6, HRV, HRV


13 New Generation Improvements: Haze, Dust, Ash, Smoke Dust Cloud MFG IR Channel MSG Dust RGB

14 New Generation Improvements: Cloud Particle Size Small Ice Particles MFG IR Channel MSG Convection RGB


15 New Generation Improvements: Thin Clouds Thin Ci Clouds GOES-16 Nat. Colour RGB (non-operational data) GOES-16 Dust RGB

 GOES-16")
16 New Generation Improvements: Cloud Classification Thin High Clouds Thick High Clouds Low Clouds GOES-16 Cloud Type RGB (non-operational data) GOES-16 Dust RGB

17 New Generation Improvements: Moisture Boundaries Diurnal development of the sea-breeze front in Yemen

 MTSAT images courtesy JMA/BOM")


18 New Generation Improvements: Wind Shear Observation Himawari-8 product courtesy JMA/CIMSS Ash RGB Himawari-8 data (2km resolution) MTSAT images courtesy JMA/BOM 11 micron IR MTSAT data (4km resolution) Klyuchevskoy 3.7 micron NIR MTSAT data (4km resolution) micron IR MTSAT data (4km resolution) Raung Plume, Java (10 th July 2015)
19 GUIDELINES FOR CREATING RGBs
20 Rules for Creating Good RGB Products Channel Select three channels or channel differences that represent three different physical properties!!! Example: MSG Window Channels Main Cloud Physical Properties (clouds, NADIR viewing) 01 (VIS 0.6) optical thickness, amount of cloud water and ice 02 (VIS 0.8) optical thickness, amount of cloud water and ice 03 (NIR 1.6) optical thickness, particle size & shape, phase 04 (MIR 3.9) Day-time: top temperature, particle size & shape, phase Night-time: top temperature (very noisy below -50 C) 07 (IR 8.7) top temperature 09 (IR 10.8) top temperature 10 (IR 12.0) top temperature

21 Not Recommended RGB IR8.7, IR10.8, IR /12/ MSG-1, 21 January 2005, 12:00 UTC

22 Recommended RGB VIS0.8, IR3.9r, IR /12/ MSG-1, 21 January 2005, 12:00 UTC
23 RGB PRODUCTS FOR OPERATIONAL FORECASTING
 24-h")

24 Most important RGBs (for Operational Forecasting) 24-h Microphysics (Dust) RGB Airmass RGB 28 January 2013, 12:00 UTC


25 High PV Anomaly Deformation Zone Jet (polar) Jet (subtropical)

26 Example: Jet Streaks Him-08, 17 October 2017, 12:00 UTC

27 Example: Jet Streaks + Moisture Rivers Him-08, 17 October 2017, 12:00 UTC
28 Example: Deformation Zone
29 Example: Deformation Zone COL X COL X X N X N X N N N N

30 Example: Deformation Zone Ash cloud from Iceland as tracer Source: HP. Roesli
 Met-10, 5-6")
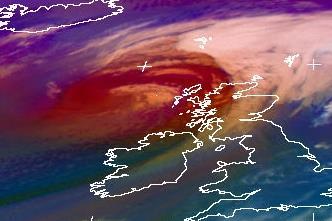
31 Example: Two PV anomalies merge over Europe (Fujiwhara effect) Met-10, 5-6 April 2017

32 Example: Low Clouds Comparison Met-8 vs Met-9 1 May 2007, 14:00 UTC Source: HP. Roesli

33 Example: Dust crosses the Atlantic Ocean Source: HP. Roesli June 2014

34 Example: Volcanic Ash (Etna, Italy) Source: HP. Roesli 12 August 2011, 09:00-13:00 UTC
 MSG-1, 12 November 2006,")
35 Example: Thin Ice Clouds (Lee Clouds) MSG-1, 12 November 2006, 23:00 UTC

36 Example: Cloud Phase 20/12/ Ice Water cloud cloud Met-8, 16 Aug 2006, 04:00 UTC
37 OTHER RGB PRODUCTS

38 Day Microphysics RGB, 19 January 2017, Example of polluted airmasses L H Snow L

 24-h Dust Day")

39 Convection RGB, dust changes cloud microphysics small ice particles (IR3.9r > 10%) 24-h Dust Day Microphysics Convective Storms Met-8, 22 February 2007, 12:00 UTC

40 Night Microphysics RGB, 19 January 2017, snow detection at night Snow Stratus Mid-level water clouds Snow 17 January 2006, 16:00 UTC


41 Convection RGB, small ice particles in severe thunderstorms Multispectral View of Convective Storms HRV Met-8, 29 June 2006 RGB Convective Storms
42 New Developments Presented at 2017 RGB workshop

43 Standard Tropical
 15 October 2015, HIM-08, AHI, Tropical Airmass RGB 2 km / 2.")
44 Tropical Airmass RGB (tuned for OTs) Overshooting Tops in Typhoon Koppu (Pacific) 15 October 2015, HIM-08, AHI, Tropical Airmass RGB 2 km / 2.5 minutes
 IR channels) G B A F A: thick dust B: thin dust C thin Cirrus D: Thick Cirrus E: Mid clouds F: Low clouds G: thin")
45 Tuning of AHI Dust RGB (for dust, cloud phase, moisture) Red: IR12.4 IR10.4, Green: IR11.2 IR8.6, Blue: IR10.4 (uses 4 (not 3) IR channels) G B A F A: thick dust B: thin dust C thin Cirrus D: Thick Cirrus E: Mid clouds F: Low clouds G: thin dust C D E Credits: D. Gencic

46 Him-08 Tuned Dust RGB Convective outflow boundary India
")
47 Him-08 Ash RGB (source: CIRA) Kamchatka

48 Him-08 Ash RGB (source: CIRA) Animation of volcanic plume and contrails

49 Him-08 Tuned Dust RGB moist Australia thin ice dry ice water water ice
 Green : IR11.2-IR8.6 (0, +10 K) Blue: IR10.4 (273, 300 K) AHI, Dust RGB (tuned) Him-08, AHI, Cloud Phase RGB (05-06-02)")
50 New Him-08 RGB: Cloud Phase RGB The dilemma of 4 IR window channels - Tuning of the Dust RGB to ABI / AHI - J. Kerkmann, EUMETSAT Red: IR12.4-IR10.4 (-6, +4 K) Green : IR11.2-IR8.6 (0, +10 K) Blue: IR10.4 (273, 300 K) AHI, Dust RGB (tuned) Him-08, AHI, Cloud Phase RGB ( )

51 Animation Cloud Phase RGB, Australia
 Cloud Phase")

52 GOES-16 Cloud Phase RGB (non-operational data) Cloud Phase RGB Convection RGB Supercell, Texas, 16 May 2017, 21:27 23:02 UTC (5 min intervals)
53 Fires in Australia, AHI, New Fire Temperature RGB October 2017 Temperature Level Credits: CIRA

54 Him-08 True Colour RGB (source: CIRA) A wall of pollution crosses the Sea of Japan May 2017

55 Him-08 True Colour RGB (source: CIRA) Spiegel Online: Smog alarm in India 7 November 2017, 03:20 UTC

56 Smog in India Him-08 Geo Colour RGB (source: CIRA)

57 Him-08 True Colour RGB (source: CIRA) Spiegel Online: Smog alarm in India 7 November 2017, 09:30 UTC
 Jose Maria dust smoke 21 September 2017, 13:45")
58 GOES-16 True Colour RGB (source: CIRA) (non-operational data) Jose Maria dust smoke 21 September 2017, 13:45 UTC


59 MODIS image (NASA) Him-08 Dust RGB (source: eport, EUMeTrain) High level smoke Lake Baikal 23 June 2017, 12:00 UTC
 Very cold land surfaces 27 January 20176,")
60 Him-08 Dust RGB (source: eport, EUMeTrain) Russia (Siberia) Very cold land surfaces 27 January 20176, 06:00 UTC

61 Him-08, Convection RGB (source: JMA) High-base convection India 2 May 2016, 02:30-12:00 UTC

62 Him-08, Convection RGB (source: eport, EUMeTrain) Australia High Supercooled Clouds 28 September 2017, 00:00 UTC
 Thin Dust Senegal Met-08 4 July 2017,")

63 Impact of viewing angle on dust detection Source: eport Pro (EUMeTrain) Thin Dust Senegal Met-08 4 July 2017, 06:00 UTC Met-10 Dust (and smoke) often better detected at high viewing angles (NADIR view is not always the best one)
 when viewed at high viewing")
64 Impact of viewing angle on fog detection Source: eport Pro (EUMeTrain) Qatar Low viewing angle High viewing angle Met-08 Met-10 Thin low clouds look thicker (better contrast) when viewed at high viewing angles!

65 Limb cooling in Airmass RGB India Met-08 5 September 2016, 12:00 UTC Him-08 Bluish limb area In Met-08 on eastern side In Him-08 on western side

66 Summary (Dust RGB Animation, source: CIRA) High winds produce massive dust storm along China-Mongolia border - 3 May
Applications of multi-spectral satellite data
 Applications of multi-spectral satellite data Jochen Kerkmann EUMETSAT, Satellite Meteorologist, Training Officer Adjusted by E de Coning South African Weather Service Content 1. Why should we use RGBs?
Satellite Meteorology. Protecting Life and Property Around the World
 Satellite Meteorology Protecting Life and Property Around the World The Value of Forecasting Severe Weather Flooding events across Europe in August 2002 cost in the region of 20 billion; 20,000 people
How to display RGB imagery by SATAID
 How to display RGB imagery by SATAID Akihiro SHIMIZU Meteorological Satellite Center (MSC), Japan Meteorological Agency (JMA) Ver. 2015110500 RGB imagery on SATAID SATAID software has a function of overlapping
" The usefulness of RGB products: the perspective of the Australian Bureau of Meteorology "
 " The usefulness of RGB products: the perspective of the Australian Bureau of Meteorology " Presenter: Bodo Zeschke. Bureau of Meteorology Training Centre, Australian VLab Centre of Excellence Point of
Day Microphysics RGB Nephanalysis in daytime. Meteorological Satellite Center, JMA
 Day Microphysics RGB Nephanalysis in daytime Meteorological Satellite Center, JMA What s Day Microphysics RGB? R : B04 (N1 0.86) Range : 0~100 [%] Gamma : 1.0 G : B07(I4 3.9) (Solar component) Range :
Introduction of JMA VLab Support Site on RGB Composite Imagery and tentative RGBs
 The Sixth Asia/Oceania Meteorological Satellite Users' Conference 9 13 November 2015, Tokyo/Japan J M A Introduction of JMA VLab Support Site on RGB Composite Imagery and tentative RGBs Akihiro SHIMIZU
RGB Experts and Developers Workshop - Introduction Tokyo, Japan 7-9 Nov 2017
 RGB Experts and Developers Workshop - Introduction Tokyo, Japan 7-9 Nov 2017 Workshop Objectives Review of existing RGB standards Reconfirm and extend existing standards (new multi-spectral imagers) Stimulate
Monitoring Sand and Dust Storms from Space
 Monitoring Sand and Dust Storms from Space for Expert Consultation on Disaster Information and Knowledge, Session 2 ICC 21 for ESCAP s RESAP and CDRR 5 9 12 October, 2017 Toshiyuki KURINO WMO Space Programme
Detection and Monitoring Convective Storms by. Using MSG SEVIRI Image. Aydın Gürol ERTÜRK. Contents
 Detection and Monitoring Convective Storms by 1 Using MSG SEVIRI Image Contents MSGView Software Cold U/V and Ring Shape Storm Tops Case Study, 2nd April 2011 Antalya, Türkiye Conclusion Aydın Gürol ERTÜRK
New capabilities with high resolution cloud micro-structure facilitated by MTG 2.3 um channel
 Slide 19 November 2016, V1.0 New capabilities with high resolution cloud micro-structure facilitated by MTG 2.3 um channel Author: Daniel Rosenfeld The Hebrew University of Jerusalem (HUJ) daniel.rosenfeld@huji.ac.il
AOMSUC-6 Training Event
 Effective use of high temporal and spatial resolution Himawari-8 data AOMSUC-6 Training Event Bodo Zeschke Australian Bureau of Meteorology Training Centre Australian VLab Centre of Excellence Content
Ash RGB Detection of Volcanic Ash
 Copyright, JMA RGB Detection of Volcanic Meteorological Satellite Center, JMA Ver. 20150424 Volcanic Detection by Infrared and Difference Image, and Basis Himawari-8 B15-B13 2015-02-16 06:35 UTC Himawari-8
HARMONISING SEVIRI RGB COMPOSITES FOR OPERATIONAL FORECASTING
 HARMONISING SEVIRI RGB COMPOSITES FOR OPERATIONAL FORECASTING HansPeter Roesli (1), Jochen Kerkmann (1), Daniel Rosenfeld (2) (1) EUMETSAT, Darmstadt DE, (2) The Hebrew University of Jerusalem, Jerusalem
Preparation for Himawari 8
 Preparation for Himawari 8 Japan Meteorological Agency Meteorological Satellite Center Hidehiko MURATA ET SUP 8, WMO HQ, Geneva, 14 17 April 2014 1/18 Introduction Background The Japan Meteorological Agency
4.1 New Generation Satellite Data and Nowcasting Products: Himawari
 4.1 New Generation Satellite Data and Nowcasting Products: Himawari SCOPE-Nowcasting-EP 18-20 September 2017 Koji Yamashita kobo.yamashita@met.kishou.go.jp Meteorological Satellite Center (MSC) Japan Meteorological
Himawari-8 True Color RGB
 Himawari-8 True Color RGB Meteorological Satellite Center, JMA Ver. 20150519 What s True Color RGB? R : B03(VS 0.64) G : B02(V2 0.51) 2015-03-17 00UTC B : B01(V1 0.46) Components of True Color RGB Channel
MSG/SEVIRI CHANNEL 4 Short-Wave IR 3.9 m IR3.9 Tutorial
 MSG/SEVIRI CHANNEL 4 Short-Wave IR Channel @ 3.9 m IR3.9 Tutorial HansPeter Roesli EUMETSAT satmet.hp@ticino.com Contributions: D Rosenfeld (HUJ) J Kerkmann (EUM), M Koenig (EUM), J Prieto (EUM), HJ Lutz
SATELLITE MONITORING OF THE CONVECTIVE STORMS
 SATELLITE MONITORING OF THE CONVECTIVE STORMS FORECASTERS POINT OF VIEW Michaela Valachová, EUMETSAT Workshop at ECMWF User Meeting Reading, 13 June 2017 Central Forecasting Office, Prague michaela.valachova@chmi.cz
Nowcasting of Severe Weather from Satellite Images (for Southern
 Nowcasting of Severe Weather from Satellite Images (for Southern Europe) Petra Mikuš Jurković Forecasting/ nowcasting of convective storms NWP models cannot well predict the exact location and intesity
MSGVIEW: AN OPERATIONAL AND TRAINING TOOL TO PROCESS, ANALYZE AND VISUALIZATION OF MSG SEVIRI DATA
 MSGVIEW: AN OPERATIONAL AND TRAINING TOOL TO PROCESS, ANALYZE AND VISUALIZATION OF MSG SEVIRI DATA Aydın Gürol Ertürk Turkish State Meteorological Service, Remote Sensing Division, CC 401, Kalaba Ankara,
Day Snow-Fog RGB Detection of low-level clouds and snow/ice covered area
 JMA Day Snow-Fog RGB Detection of low-level clouds and snow/ice covered area Meteorological Satellite Center, JMA What s Day Snow-Fog RGB? R : B04 (N1 0.86) Range : 0~100 [%] Gamma : 1.7 G : B05 (N2 1.6)
Applications of the SEVIRI window channels in the infrared.
 Applications of the SEVIRI window channels in the infrared jose.prieto@eumetsat.int SEVIRI CHANNELS Properties Channel Cloud Gases Application HRV 0.7 Absorption Scattering
Application of Himawari-8 AHI Data to the GOES-R Rainfall Rate Algorithm
 Application of Himawari-8 AHI Data to the GOES-R Rainfall Rate Algorithm Yaping Li 1, Robert Kuligowski 2 and Yan Hao 1 1. IMSG at NOAA/NESDIS/STAR 2. NOAA/NESDIS/STAR, College Park, MD 1 GOES-R Baseline
Satellite data for African applications
 Satellite data for African applications Henk Verschuur, EUMETSAT henk.verschuur@eumetsat.int Introduction Some examples of satellite products which are useful for Africa Satellite products Tropical cyclones
Himawari-8 RGB product use and development amongst Australian / RAV / RAII stakeholders: the Australian VLab Centre of Excellence perspective
 Himawari-8 RGB product use and development amongst Australian / RAV / RAII stakeholders: the Australian VLab Centre of Excellence perspective EUMeTrain Event Week on MTG-I satellite 7-11 November 2016
RGB Experts and Developers Workshop 2017 Tokyo, Japan
 "Application of the Sandwich Product and variations to this as used by Australian Forecasters and as presented during training at the Australian VLab Centre of Excellence". RGB Experts and Developers Workshop
Overview of Himawari-8/9
 Overview of Himawari-8/9 Toshiyuki SAKURAI Meteorological Satellite Center (MSC) Japan Meteorological Agency (JMA) EUMeTrain Event Week on MTG-I Satellite 2016 Session2 - Himawari-8 and Data Applications
The water vapour channels of SEVIRI (Meteosat). An introduction
. An introduction") The water vapour channels of SEVIRI (Meteosat). An introduction jose.prieto@eumetsat.int Cachoeira P. July 2006 Formats 1.5 1 Objectives 2 Describe the characteristics of WV channels on board of SEVIRI
The water vapour channels of SEVIRI (Meteosat). An introduction jose.prieto@eumetsat.int Cachoeira P. July 2006 Formats 1.5 1 Objectives 2 Describe the characteristics of WV channels on board of SEVIRI
NATS 1750 Lecture. Wednesday 28 th November Pearson Education, Inc.
 NATS 1750 Lecture Wednesday 28 th November 2012 Processes that lift air Orographic lifting Elevated terrains act as barriers Result can be a rainshadow desert Frontal wedging Cool air acts as a barrier
Satellite observation of atmospheric dust
 Satellite observation of atmospheric dust Taichu Y. Tanaka Meteorological Research Institute, Japan Meteorological Agency 11 April 2017, SDS WAS: Dust observation and modeling @WMO, Geneva Dust observations
Chapter 8 cont. Clouds and Storms
 Chapter 8 cont. Clouds and Storms Spring 2007 Clouds and Storms Clouds cover ~ 50% of earth at any time. Clouds are linked to a number of condensation processes. Cloud morphology, cloud types, associated
Why There Is Weather?
 Lecture 6: Weather, Music Of Our Sphere Weather and Climate WEATHER The daily fluctuations in atmospheric conditions. The atmosphere on its own can produce weather. (From Understanding Weather & Climate)
Combined and parallel use of MSG composite images and SAFNWC/MSG products at the Hungarian Meteorological Service
 Combined and parallel use of MSG composite images and SAFNWC/MSG products at the Hungarian Meteorological Service Mária Putsay, Kornél Kolláth and Ildikó Szenyán Hungarian Meteorological Service H-1525
Advanced Geostationary Observations for the OzEWEX Community. Leon Majewski Bureau of Meteorology
 Advanced Geostationary Observations for the OzEWEX Community Leon Majewski Bureau of Meteorology Overview Geostationary satellite missions & sensors Meteorological applications Access for OzEWEX researchers
INTERPRETATION OF MSG IMAGES, PRODUCTS AND SAFNWC OUTPUTS FOR DUTY FORECASTERS
 INTERPRETATION OF MSG IMAGES, PRODUCTS AND SAFNWC OUTPUTS FOR DUTY FORECASTERS M. Putsay, M. Rajnai, M. Diószeghy, J. Kerényi, I.G. Szenyán and S. Kertész Hungarian Meteorological Service, H-1525 Budapest,
Convective Cloud Features in typical synoptic situations. Frans Debie
 Convective Cloud Features in typical synoptic situations Frans Debie me SATRAPPERS Henk vesa Frans Veronika ab Teachers classroom Langen Cumulonimbus: Convection Convection, seen from ground 1 2 3 4 Outflow
What a Hurricane Needs to Develop
 Weather Weather is the current atmospheric conditions, such as air temperature, wind speed, wind direction, cloud cover, precipitation, relative humidity, air pressure, etc. 8.10B: global patterns of atmospheric
Usage of McIDAS V with GOES R AWG products
 McIDAS User Group Meeting, October 25-27, 2010, Madison, WI Usage of McIDAS V with GOES R AWG products William Straka III UW/CIMSS Madison, Wisconsin, USA With help from Tom Rink (CIMSS/), Tom Achtor (CIMSS/),
The development and evolution of deep convection and heavy rainfall
 The development and evolution of deep convection and heavy rainfall Unique in spectra, space and time The spatial and temporal domains of the phenomena being investigated drive the satellite s spectral
CASE STUDY OF THE 20 MAY 2008 TORNADIC STORM IN HUNGARY
 CASE STUDY OF THE 20 MAY 2008 TORNADIC STORM IN HUNGARY Mária Putsay 1, Jochen Kerkmann 2 and Ildikó Szenyán 1 1 Hungarian Meteorological Service, H-1525 Budapest, P. O. Box 38, Hungary 2 EUMETSAT, am
A Review of the Australian VLab Centre of Excellence National Himawari-8 Training Campaign. AOMSUC-6 Conference Session
 A Review of the Australian VLab Centre of Excellence National Himawari-8 Training Campaign AOMSUC-6 Conference Session Bodo Zeschke Australian Bureau of Meteorology Training Centre Australian VLab Centre
Weather is the of the Earth s atmosphere at a place and time. It is the movement of through the atmosphere o Energy comes from the
 Weather Notes Weather Weather is the of the Earth s atmosphere at a place and time It is the movement of through the atmosphere o Energy comes from the The sun is the force that weather The sun s energy
MSG FOR NOWCASTING - EXPERIENCES OVER SOUTHERN AFRICA
 MSG FOR NOWCASTING - EXPERIENCES OVER SOUTHERN AFRICA Estelle de Coning and Marianne König South African Weather Service, Private Bag X097, Pretoria 0001, South Africa EUMETSAT, Am Kavalleriesand 31, D-64295
Chapter 8 cont. Clouds and Storms. Spring 2018
 Chapter 8 cont. Clouds and Storms Spring 2018 Clouds and Storms Clouds cover ~ 50% of earth at any time. Clouds are linked to a number of condensation processes. Cloud morphology, cloud types, associated
Weather Notes. Chapter 16, 17, & 18
 Weather Notes Chapter 16, 17, & 18 Weather Weather is the condition of the Earth s atmosphere at a particular place and time Weather It is the movement of energy through the atmosphere Energy comes from
Moisture, Clouds, and Precipitation: Clouds and Precipitation. Dr. Michael J Passow
 Moisture, Clouds, and Precipitation: Clouds and Precipitation Dr. Michael J Passow What Processes Lift Air? Clouds require three things: water vapor, a condensation nucleus, and cooling Cooling usually
Three things necessary for weather are Heat, Air, Moisture (HAM) Weather takes place in the Troposphere (The lower part of the atmosphere).
 Weather takes place in the Troposphere (The lower part of the atmosphere).") Grade 5 SCIENCE WEATHER WATCH Name: STUDY NOTES Weather - The condition of the atmosphere with respect to heat/cold, wetness/dryness, clearness/ cloudiness for a period of time. Weather changes over time
Grade 5 SCIENCE WEATHER WATCH Name: STUDY NOTES Weather - The condition of the atmosphere with respect to heat/cold, wetness/dryness, clearness/ cloudiness for a period of time. Weather changes over time
Country Report - Singapore
 Country Report - Singapore The 5th Meeting of the Coordinating Group Vladivostok city, Russky Island, Russia Far Eastern Federal University of the RA II WIGOS Satellite Project 21 October 2017 Outline
Satellites, Weather and Climate Module 1: Introduction to the Electromagnetic Spectrum
 Satellites, Weather and Climate Module 1: Introduction to the Electromagnetic Spectrum What is remote sensing? = science & art of obtaining information through data analysis, such that the device is not
Ice fog: T~<-10C RHi>100%
 SATELLITE AND RADIOMETER BASED NOWCASTING APPLICATIONS FOR ARCTIC REGIONS Ismail Gultepe 1, Mike Pavolonis 2, Victor Chung 3, Corey Calvert 4, James Gurka 5, Randolf Ware 6, Louis Garand 7 G. Toth Aug
Air Mass Thunderstorms. Air Mass Thunderstorms. Air Mass Thunderstorms. Lecture 26 Air Mass Thunderstorms and Lightning
 Lecture 26 and Lightning Life Cycle Environment Climatology Lightning 1 2 Short-lived, isolated thunderstorms that are not severe are often called air-mass thunderstorms. There are three stages describing
Title Slide: AWIPS screengrab of AVHRR data fog product, cloud products, and POES sounding locations.
 Title Slide: AWIPS screengrab of AVHRR data fog product, cloud products, and POES sounding locations. Slide 2: 3 frames: Global tracks for NOAA19 (frame 1); NOAA-19 tracks over CONUS (frame 2); NOAA-19
Detailed Cloud Motions from Satellite Imagery Taken at Thirty Second One and Three Minute Intervals
 Detailed Cloud Motions from Satellite Imagery Taken at Thirty Second One and Three Minute Intervals James F.W. Purdom NOAA/NESDIS/RAMM Branch CIRA Colorado State University W. Laporte Avenue Fort Collins,
WATER IN THE ATMOSPHERE
 WATER IN THE ATMOSPHERE I. Humidity A. Defined as water vapor or moisture in the air (from evaporation and condensation). B. The atmosphere gains moisture from the evaporation of water from oceans, lakes,
Introduction to the NWC SAF
 Introduction to the NWC SAF NWC SAF Event Week EUMeTrain course 18-22 November, online P. Fernández 1 Where are you listening from? Contents SAF Network scope NWC SAF Overview Products Next versions 2014
AOSC 200 Tim Canty. Class Web Site: Topics for today: Air Masses. Fronts. Lecture 19 Apr
 Air Masses AOSC 200 Tim Canty Class Web Site: http://www.atmos.umd.edu/~tcanty/aosc200 Topics for today: Air Masses Fronts Lecture 19 Apr 11 2019 1 Today s Weather Map http://www.wpc.ncep.noaa.gov/#page=sfc
METEOSAT CONVECTIVE INITIATION PRODUCT WITH AND WITHOUT CLOUD TRACKING - EXPERIENCES
 METEOSAT CONVECTIVE INITIATION PRODUCT WITH AND WITHOUT CLOUD TRACKING - EXPERIENCES Mária Putsay 1, Zsófia Kocsis 1, Marianne König 2, Ildikó Szenyán 1, Márta Diószeghy 1, André Simon 1 and Márk Rajnai
Introduction to African weather
 Introduction to African weather Dr Caroline Bain Met Office, Exeter, UK Overview Convection and general circulation A tour around the seasons: West African Monsoon, AEWs, Short rains East Africa, Low-level
Untitled.notebook May 12, Thunderstorms. Moisture is needed to form clouds and precipitation the lifting of air, or uplift, must be very strong
 Thunderstorms Moisture is needed to form clouds and precipitation the lifting of air, or uplift, must be very strong cold air and warm air must mix; creating an active circulation system that has both
Satellite Constraints on Arctic-region Airborne Particles Ralph Kahn NASA Goddard Space Flight Center
 Satellite Constraints on Arctic-region Airborne Particles Ralph Kahn NASA Goddard Space Flight Center Sea of Okhotsk, MODIS image Feb. 6, 2007, NASA Earth Observatory Arctic Aerosol Remote Sensing Overview
Global Winds AOSC 200 Tim Canty
 Global Winds AOSC 200 Tim Canty Class Web Site: http://www.atmos.umd.edu/~tcanty/aosc200 Topics for today: Air Masses Fronts Lecture 18 Oct 31 2017 1 Air Masses What is an air mass? Large body of air whose
Storm and Storm Systems Related Vocabulary and Definitions. Magnitudes are measured differently for different hazard types:
 Storm and Storm Systems Related Vocabulary and Definitions Magnitude: this is an indication of the scale of an event, often synonymous with intensity or size. In natural systems, magnitude is also related
A Questionnaire on the Utilization of Satellite Data from the New Generation of Geostationary Meteorological Satellites
 3.1 User requirements for satellite data utilization, especially for new-generation satellites A Questionnaire on the Utilization of Satellite Data from the New Generation of Geostationary Meteorological
The importance of satellite data for nowcasting in the WWRP strategy
 The importance of satellite data for nowcasting in the WWRP strategy Estelle de Coning and Paolo Ruti World Weather Research Division Steve Goodman Chief Program Scientist, NOAA WMO definition Nowcasting
Extreme Weather and Climate Change: the big picture Alan K. Betts Atmospheric Research Pittsford, VT NESC, Saratoga, NY
 Extreme Weather and Climate Change: the big picture Alan K. Betts Atmospheric Research Pittsford, VT http://alanbetts.com NESC, Saratoga, NY March 10, 2018 Increases in Extreme Weather Last decade: lack
Rapidly Developing Thunderstorm (RDT)
") Rapidly Developing Thunderstorm (RDT) Jean-Marc Moisselin, Frédéric Autones Météo-France Nowcasting Department 42, av. Gaspard Coriolis 31057 Toulouse France jean-marc.moisselin@meteo.fr EUMETRAIN Convection
Rapidly Developing Thunderstorm (RDT) Jean-Marc Moisselin, Frédéric Autones Météo-France Nowcasting Department 42, av. Gaspard Coriolis 31057 Toulouse France jean-marc.moisselin@meteo.fr EUMETRAIN Convection
Life Cycle of Convective Systems over Western Colombia
 Life Cycle of Convective Systems over Western Colombia Meiry Sakamoto Uiversidade de São Paulo, São Paulo, Brazil Colombia Life Cycle of Convective Systems over Western Colombia Convective System (CS)
ESCI 344 Tropical Meteorology Lesson 7 Temperature, Clouds, and Rain
 ESCI 344 Tropical Meteorology Lesson 7 Temperature, Clouds, and Rain References: Forecaster s Guide to Tropical Meteorology (updated), Ramage Tropical Climatology, McGregor and Nieuwolt Climate and Weather
NWP SAF AMV monitoring: the 7th Analysis Report (AR7)
") Document NWPSAF-MO-TR-032 Version 1.0 24/05/16 NWP SAF AMV monitoring: the 7th Analysis Report (AR7) Francis Warrick Met Office, UK NWP SAF AMV monitoring: the 7th Analysis Report (AR7) Francis Warrick
Document NWPSAF-MO-TR-032 Version 1.0 24/05/16 NWP SAF AMV monitoring: the 7th Analysis Report (AR7) Francis Warrick Met Office, UK NWP SAF AMV monitoring: the 7th Analysis Report (AR7) Francis Warrick
Mechanical Turbulence Wind forms eddies as it blows around hanger, stands of trees or other obstructions
 Turbulence Low-level Turbulence below 15,000 feet consists of Mechanical Turbulence Convective Turbulence Frontal Turbulence Wake Turbulence Mechanical Turbulence Wind forms eddies as it blows around hanger,
WORLD S CHOICE FOR GEO IMAGING. Advanced Baseline Imager (ABI)
") WORLD S CHOICE FOR GEO IMAGING Advanced Baseline Imager (ABI) MARKET-LEADING EXPERTISE DELIVERS BEST-IN-CLASS WEATHER IMAGING In cases of extreme weather such as hurricanes, typhoons, blizzards and tornadoes,
WORLD S CHOICE FOR GEO IMAGING Advanced Baseline Imager (ABI) MARKET-LEADING EXPERTISE DELIVERS BEST-IN-CLASS WEATHER IMAGING In cases of extreme weather such as hurricanes, typhoons, blizzards and tornadoes,
Recent Update on MODIS C6 and VIIRS Deep Blue Aerosol Products
 Recent Update on MODIS C6 and VIIRS Deep Blue Aerosol Products N. Christina Hsu, Photo taken from Space Shuttle: Fierce dust front over Libya Corey Bettenhausen, Andrew M. Sayer, and Rick Hansell Laboratory
Trend of dust storm days and variation in dust and carbon monoxide concentrations during dust storms observed at Cheongwon, Korea
 Korea Centre for Atmospheric Environment Research Trend of dust storm days and variation in dust and carbon monoxide concentrations during dust storms observed at Cheongwon, Korea Yong-Seung CHUNG and
Himawari-8/9 and GCOM-C Non-Meteorological Application Opportunities
 Himawari-8/9 and GCOM-C Non-Meteorological Application Opportunities Alex Held Centre for Australian Weather and Climate Research CAWCR December 2013 Selected materials from C. Down BoM) Non-Meteorological
AIR MASSES. Large bodies of air. SOURCE REGIONS areas where air masses originate
 Large bodies of air AIR MASSES SOURCE REGIONS areas where air masses originate Uniform in composition Light surface winds Dominated by high surface pressure The longer the air mass remains over a region,
Inter-comparison MTSAT-2 & Himawari-8
 Inter-comparison MTSAT-2 & Himawari-8 WMO Volcanic Ash Advisory Centre Best Practice Workshop 2017 Tokyo Volcanic Ash Advisory Centre Japan Meteorological Agency Outline Introduction Method Case study
Answer each section in a separate booklet.
 DURATION: 3 HOURS TOTAL MARKS: 150 Internal Examiners: Dr S Pillay & Mr J Lutchmiah External Examiner: Dr J Odindi NOTE: This paper consists of 8 pages and an MCQ answer sheet. Please ensure that you have
Benefits of the new-generation Himawari-8 geostationary satellite for the Asia-Pacific region. Toshihiko HASHIDA Japan Meteorological Agency (JMA)
") Benefits of the new-generation Himawari-8 geostationary satellite for the Asia-Pacific region Toshihiko HASHIDA Japan Meteorological Agency (JMA) Side Event Ensuring User Readiness to New-Generation Meteorological
Benefits of the new-generation Himawari-8 geostationary satellite for the Asia-Pacific region Toshihiko HASHIDA Japan Meteorological Agency (JMA) Side Event Ensuring User Readiness to New-Generation Meteorological
Ch. 3: Weather Patterns
 Ch. 3: Weather Patterns Sect. 1: Air Mass & Fronts Sect. 2: Storms Sect. 3: Predicting the Weather Sect. 4: Weather forecasters use advanced technologies Ch. 3 Weather Fronts and Storms Objective(s) 7.E.1.3
EOS Direct Broadcast Real-Time Products for the US National Weather Service
 EOS Direct Broadcast Real-Time Products for the US National Weather Service Liam E. Gumley,, K. Strabala, J. Gerth,, S. Bachmeier, R. Dengel,, S. Dutcher, and J. Robaidek Liam.Gumley@ssec.wisc.edu University
Rapidly Developing Cumulus Area RDCA detection using Himawari-8 data
 AOMSUC-7@Incheon Rapidly Developing Cumulus Area RDCA detection using Himawari-8 data Hiroshi SUZUE and Yasuhiko SUMIDA Meteorological Satellite Center Japan Meteorological Agency Contents Ø Outline of
Ch22&23 Test. Multiple Choice Identify the choice that best completes the statement or answers the question.
 Ch22&23 Test Multiple Choice Identify the choice that best completes the statement or answers the question. 1. The two most abundant compounds in the atmosphere are carbon dioxide and a. particulates.
FUTURE PLAN AND RECENT ACTIVITIES FOR THE JAPANESE FOLLOW-ON GEOSTATIONARY METEOROLOGICAL SATELLITE HIMAWARI-8/9
 FUTURE PLAN AND RECENT ACTIVITIES FOR THE JAPANESE FOLLOW-ON GEOSTATIONARY METEOROLOGICAL SATELLITE HIMAWARI-8/9 Toshiyuki Kurino Japan Meteorological Agency, 1-3-4 Otemachi Chiyodaku, Tokyo 100-8122,
SCI-4 Mil-Brock-Weather Exam not valid for Paper Pencil Test Sessions
 SCI-4 Mil-Brock-Weather Exam not valid for Paper Pencil Test Sessions [Exam ID:1TLR5H 1 Warm air rises and cools. Moisture in the air forms clouds that will bring rain. What pressure system is described?
Mr. P s Science Test!
 WEATHER- 2017 Mr. P s Science Test! # Name Date 1. Draw and label a weather station model. (10 pts) 2. The is the layer of the atmosphere with our weather. 3. Meteorologists classify clouds in about different
P3.13 GLOBAL COMPOSITE OF VOLCANIC ASH SPLIT ` WINDOW GEOSTATIONARY SATELLITE IMAGES
 P3.13 GLOBAL COMPOSITE OF VOLCANIC ASH SPLIT ` WINDOW GEOSTATIONARY SATELLITE IMAGES Frederick R. Mosher * Embry-Riddle Aeronautical University Daytona Beach, FL 1.0 Introduction Volcanic ash is exceptionally
Condensation: Dew, Fog, & Clouds. Chapter 5
 Condensation: Dew, Fog, & Clouds Chapter 5 The Formation of Dew & Frost Dew forms on objects near the ground surface when they cool below the dew point temperature. More likely on clear nights due to increased
UPDATE OF REGIONAL WEATHER AND SMOKE HAZE (February 2018)
") UPDATE OF REGIONAL WEATHER AND SMOKE HAZE (February 2018) 1. Review of Regional Weather Conditions for January 2018 1.1 The prevailing Northeast monsoon conditions over Southeast Asia strengthened in January
UPDATE OF REGIONAL WEATHER AND SMOKE HAZE (February 2018) 1. Review of Regional Weather Conditions for January 2018 1.1 The prevailing Northeast monsoon conditions over Southeast Asia strengthened in January
UPDATE OF REGIONAL WEATHER AND SMOKE HAZE (December 2017)
") UPDATE OF REGIONAL WEATHER AND SMOKE HAZE (December 2017) 1. Review of Regional Weather Conditions for November 2017 1.1 In November 2017, Southeast Asia experienced inter-monsoon conditions in the first
UPDATE OF REGIONAL WEATHER AND SMOKE HAZE (December 2017) 1. Review of Regional Weather Conditions for November 2017 1.1 In November 2017, Southeast Asia experienced inter-monsoon conditions in the first
The Transition of Atmospheric Infrared Sounder Total Ozone Products to Operations
 The Transition of Atmospheric Infrared Sounder Total Ozone Products to Operations Emily Berndt 1, Bradley Zavodsky 2, Gary Jedlovec 2 1 NASA Postdoctoral Program Marshall Space Flight Center, Huntsville,
Page 1. Name:
 Name: 1) As the difference between the dewpoint temperature and the air temperature decreases, the probability of precipitation increases remains the same decreases 2) Which statement best explains why
Condensation Nuclei. Condensation Nuclei 2/10/11. Hydrophobic Water-repelling Oils, gasoline, paraffin Resist condensation, even above 100% RH
 Chapter 5 The Formation of Dew & Frost Dew forms on objects near the ground surface when they cool below the dew point temperature. More likely on clear nights due to increased radiative cooling White
REPORT ON THE ACTIVITIES OF THE EUMETSAT-ESSL CONVECTION WORKING GROUP
 REPORT ON THE ACTIVITIES OF THE EUMETSAT-ESSL CONVECTION WORKING GROUP Marianne König EUMETSAT, Eumetsat Allee 1, 64295 Darmstadt, Germany Abstract The focus of the Convection Working Group is to have
The use of Direct Broadcast Processing System in Poland
 The use of Direct Broadcast Processing System in Poland B.Łapeta, P.Struzik Satellite Remote Sensing Department, Institute of Meteortology and Water Management National Reasearch Institute About IMWM-NRI
NOAA/NESDIS Tropical Web Page with LEO Satellite Products and Applications for Forecasters
 NOAA/NESDIS Tropical Web Page with LEO Satellite Products and Applications for Forecasters Sheldon Kusselson National Oceanic and Atmospheric Administration (NOAA) National Environmental Satellite Data
Arctic Weather Every 10 Minutes: Design & Operation of ABI for PCW
 Arctic Weather Every 10 Minutes: Design and Operation of ABI for PCW Dr. Paul C. Griffith and Sue Wirth 31st Space Symposium, Technical Track, Colorado Springs, Colorado This document is not subject to
Atmospheric Motions Derived From Space Based Measurements: A Look To The Near Future. James F.W. Purdom
 Atmospheric Motions Derived From Space Based Measurements: A Look To The Near Future James F.W. Purdom Director, Office of Research and Applications NOAA/NESDIS 1. Introduction This short note addresses
Satellite-based Convection Nowcasting and Aviation Turbulence Applications
 Satellite-based Convection Nowcasting and Aviation Turbulence Applications Kristopher Bedka Cooperative Institute for Meteorological Satellite Studies (CIMSS), University of Wisconsin-Madison In collaboration
YELLOW SPOT IN THE CONVECTIVE STORMS RGB IMAGE CAUSED BY A PILEUS CLOUD
 YELLOW SPOT IN THE CONVECTIVE STORMS RGB IMAGE CAUSED BY A PILEUS CLOUD André Simon, Mária Putsay, Ildikó Szenyán and Ákos Horváth Hungarian Meteorological Service, Kitaibel Pál u. 1, H-1024 Budapest,
A 2016 CEOS Chair Initiative. Non-meteorological Applications for Next Generation Geostationary Satellites
 A 2016 CEOS Chair Initiative Committee on Earth Observation Satellites Non-meteorological Applications for Next Generation Geostationary Satellites Co-chaired by EUMETSAT (Holmlund), CSIRO (Schroeder),