Convective Cloud Features in typical synoptic situations. Frans Debie
|
|
|
- Sharyl Holland
- 5 years ago
- Views:
Transcription


1 Convective Cloud Features in typical synoptic situations Frans Debie

2 me SATRAPPERS Henk vesa Frans Veronika ab Teachers classroom Langen

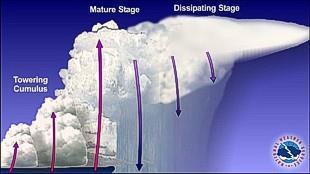
3 Cumulonimbus: Convection


4 Convection, seen from ground

5

6 Outflow boundaries
7 Which features are important for convection? - Humidity (eg. mixing ratio) - Stability (lapse rate, conditional unstable) - Lift (Cape, CIN)
8 Which features are important for convection? - Humidity (eg. mixing ratio) - Stability (lapse rate, conditional unstable) - Lift (Cape, CIN) Necessary, however not always sufficient enough - Shear
9 Features [1] Humidity [2] Stability [3] Lift [4] Shear Evaporation Advection Insolation Change Humidity Cold Advection at higher levels Front PVA (Upper level trough) Jet streaks Outflow boundary Convergence zone Orography Mostly in lowest 6000 ft
10 Lift is vertical motion due to forcing - Convergence lines Fronts Thermal lows / troughs Outflow Boundaries Sea breeze (lakes) front - Upper level forcing Jet streaks Upper level troughs - Other forcing mechanism Low-level jet Orography
 0: free convection 1-30 convection with enough heating/lift 30-100: convection with strong heating / lift CIN >100: convection almost")
11 CAPE and CIN: (convective available potential energy / convective inhibition) Typical values CAPE (J/kg) : Winter : Summer >1500: Spanish plume CAPE Typical values CIN (J/kg) 0: free convection 1-30 convection with enough heating/lift : convection with strong heating / lift CIN >100: convection almost impossible
 (west")
12 (South component) Hodogram Shear in lowest 6000 ft XYZ 0000 UTC 6/15/2002 My Favorite Hodogram 0-10 km Hodograph v (m s -1 ) km 10 SFC 5 2 km 3 km SFC V km RM LM mw V obs 4 km km 5 km -10 wind shear km -20 u (m s -1 ) (west component)
13 Convection spectrum: 4 main types Single cell Pulse storms
14 Convection spectrum: 4 main types Single cell Multicell Pulse storms
15 Convection spectrum: 4 main types Single cell Multicell Squall lines Pulse storms
16 Convection spectrum: 4 main types Single cell Multicell Squall lines Supercell Pulse storms
17 Question: Can we recognize polar air with satellite images? Answer: Yes AIRMASS RGB


18 31 October UTC AIRMASS RGB
19 Convective Cloud Features in Polar Airmass from Cloud Streets to Cb s
20 Schematic drawing of development cloud streets (from satmanu)
21 Schematic drawing transition cloud street to CB (from satmanu)
22 Schematic drawing transition cloud street to CB (from satmanu) transition to CB s

23 Cloud streets above Benelux / France/ Germany/ England 12 april 15 UTC
24 Just info for Liliane Next slide is an animation: file name: Hrvis_Cloudstreets1.gif Delete this sheet!!

25 From Cloud streets to CB s above Netherlands Germany 12 april UTC
26 Info for Liliane Next slide is an animaton file name : cloudstreets.gif Delete this sheet!!

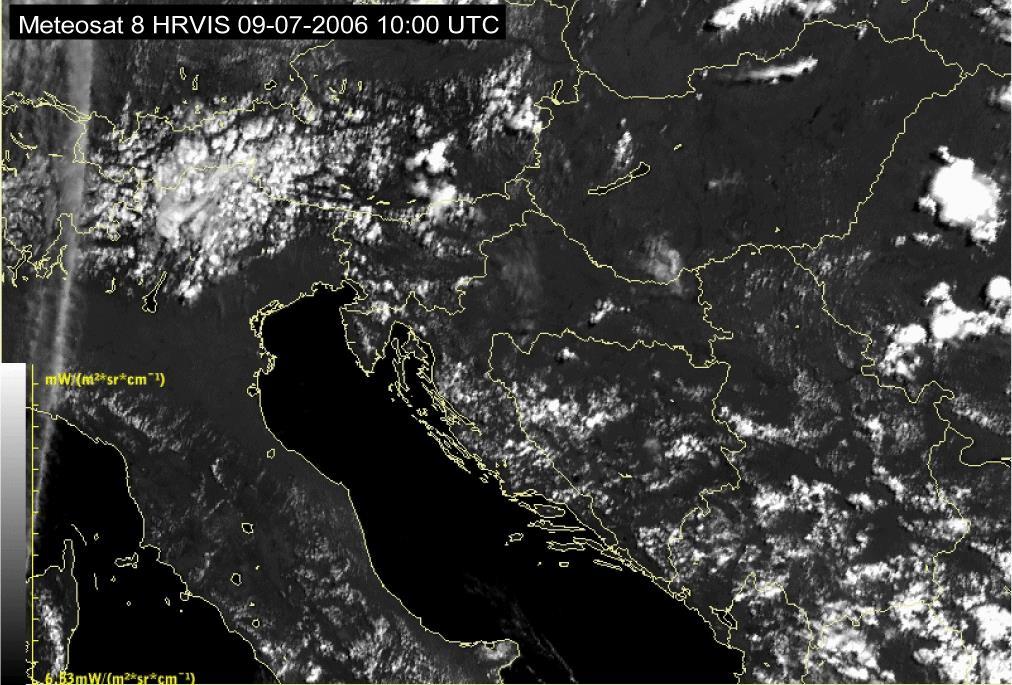
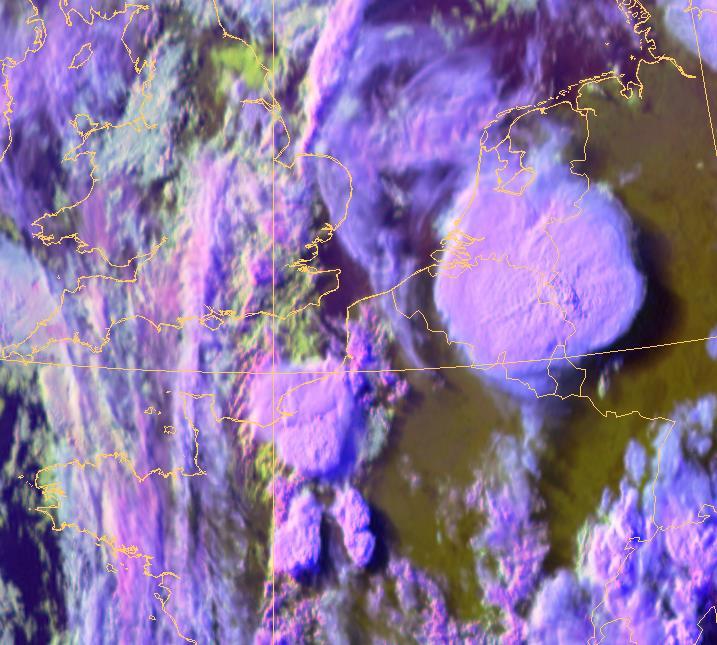
27 Some cloud streets develop into showers (pink tops)
28 Convective Cloud Features in Polar Airmass Enhanced Cumulus (EC)
29 Conceptual model Enhanced Cumulus Definition: Enhanced Cumulus area (EC) consists of a cluster of thicker and larger cloud cells within the usual cold air cloudiness behind frontal cloud bands, but sometimes are also a part of Open Cell Cloudiness
30 There are two main conditions to develop EC : 1. (Increasing) vertical instability in de troposphere, eg: Cold air above warm (sea)water Cold air over relative warm land 2.(Existing of) PVA maxima At leading side of a moving upper level trough, due to advection of curvature vorticity In the left exit region of a jet streak, due to advection of shear vorticity
31 Schematic 1 PVA max, associated with an upper level trough
32 Schematic 2 PVA max, associated with main upper level trough
33 Schematic 3 PVA max, associated with an upper level trough
34 Schematic 4 PVA max, associated with jet streak
35 Schematic 4 transition cloud street to EC (from satmanu) transition
36 Info for Liliane next slide is an animation: file name: airmass_tot.gif Delete this sheet!!

37 Example of EC development Airmass RGB 12 april UTC 12 April 06 UTC
38 Isohypse 300 hpa + IR10.8 μm 12 April 06 UTC
39 Isotachs at 300 hpa 12 April 06 UTC
40 Jet 300 hpa 12 April 06 UTC Model a bit shifted to the South

41 Jet + PVA 300 hpa 12 April 06 UTC
42 Temperature Advection 700 hpa 12 April 06 UTC
43 Info Liliane next slide is an animation: EC_Rapidscan.gif Delete this sheet!!

44 Met 8 Rapid Scan 12 April 05:25-08:35 UTC day/night window: Night: 3.9µm,10.8µm,12.0µm Day: HRvis, 1.6µm,10.8µm
45 Convective Cloud Features in Polar Airmass Open/Closed Cell Convection

46 Open Cell Convectie (OCC) Atmospheric example of Rayleigh-Bénard convection frying pan with heating oil and floating aluminium flakes

47
48 Schematic vertical circulation and cloudiness in Open Cell Convection

49 Cross section A B open to closed cells OCC CCC
50 Cross section E - - A open closed B
51 Cross section E inversion - - A open closed B
52 Cross section E + Temperature Advection A open closed B
53 Info for Liliane Next slide is an animation: file name: OCC_animation.gif Delete this sheet!!

54 Open Cell Convection: Showers over Scotland

55 Convective environment tropical Airmass Cb Clusters (MCS) Fair Weather Conditions Conceptual Models Enhancement of convection by PV Spanish Plume Leading edge front Lia Vergouw
56 CB Clusters

57 WV6.2 -WV7.3, NIR3.9 -IR10.8, NIR1.6 -VIS0.6

58
59 Info for Liliane next slide is an animation: file name: Cb-RGB.gif Delete this sheet!!

60 Cb development Poland France Italy severe storm RGB
61 Key parameters Cb Clusters (Equivalent) Thickness hpa Potential (Wet Bulb) Temperature θ E(w) Indication of warm airmass Low level Convergence: Areas of high convergence are preferable for convective development. Instability indices: CAPE, Boyden index, Showalter index, K index, etc Shear Lowest 6000 ft
62
63
64 Neg.
65
66
67 Info for liliane next slide is an animation: filename: cbclusters.gif DELETE this sheet!!
68
69 Convective Cloud Features In typical synoptic Environments: Fair Weather Conditions
70
71 Dark stripe Dark stripe -
72 WV 6.2 μm 25 August 09 UTC
73 WV 6.2 μm 25 August 09 UTC Old system: developed during the night
74 Info for Liliane next slide is an animation: file name: Airmass_25aug.gif Delete this sheet!!

75 Airmass RGB 25 August UTC
76 Info for Liliane next slide is an animation: file name: HRvis_RGB_25aug.gif Delete this sheet!!

77 Cb development in area of dark stripe HRvis, 1.6µm,10.8µm 25 August UTC


78
79 CONVECTIVE CLOUD FEATURES IN TYPICAL SYNOPTIC ENVIRONMENTS: ENHANCEMENT OF CONVECTION BY Potential Vorticity
80 Ascending / Descending air: Increasing / Decreasing Vorticity
81 Potential Vorticity Definition:
82 Conservation of PV during descent of a vorticity tube along 2 iso Theta surfaces
83
84 Airmass 11 April 00 UTC
85 Airmass 11 April 00 UTC

86 PV 317 K (blue) 06 UTC PVA500 (yellow)

87 SATREP + H500 hpa 11 April 12 UTC
88 WV 6.2 mm 11 April 12 UTC

89 PVA / NVA 500 hpa 11 April 12 UTC
90 Hoogte PV = 1.5
91 Info for Liliane next slide is an animation: file name: ULL_zoom11april.gif Delete this sheet!!

92 Airmass 11 April UTC

93 Global Instability Index 11 April 06 UTC

94 Global Instability Index 11 April 12 UTC

95 11 April 15 UTC
96 CONVECTIVE CLOUD FEATURES IN TYPICAL SYNOPTIC ENVIRONMENTS: Spanish Plume + leading edge of front

97 WV Sflocs 11 April 15 UTC
98
99 Key parameters Stability indices on isobaric surfaces: CAPE, Showalter Index Equivalent potential temperature θ E : Tongue of high values of θ E ; deep convection develops in the area of maximal values. Temperature Advection (TA) Thermal Front Parameter (TFP): TFP associated with the gradually weakening Cold Front, and potential new front development ahead of the original Cold Front. Thickness Equivalent thickness hpa

100

101
102
103

104 Thickness + Showalter index Leading edge of frontal cloud

105 9 June UTC WV 6.2 μm

106 9 June UTC WV 6.2 μm
107 9 June UTC WV 6.2 μm
108 9 June UTC WV 6.2 μm

109 TFP+ Thickness WV 6.2 μm 9 June UTC

110 θ E (500 hpa) WV 6.2 μm 9 June UTC
111 WV 6.2 μm + CAPE 9 June UTC WV 6.2 μm 9 June UTC


112


113 L

114 In 6 hours more than lightnings


115
116 Thx for your attention and Maybe we see each other in Langen
117 Thx for your attention and Maybe we see each other in Langen Questions / Remarks?
118 Recommended Background web addresses Real_Time_Imagery/index.htm
1. COLD FRONT - CLOUD STRUCTURE IN SATELLITE IMAGES
 1. COLD FRONT - CLOUD STRUCTURE IN SATELLITE IMAGES The satellite image shows a cyclonically curved synoptic scale cloud band usually a few hundred kilometres wide; in the VIS image the cloud band mostly
Introduction to Conceptual Models
 Zentralanstalt für Meteorologie und Geodynamik Introduction to Conceptual Models Veronika Zwatz-Meise IR Satellite Images with Satrep From Cloud systems in satellite images to Conceptual Models If we look
Occlusion Cyclogenesis
 Occlusion Cyclogenesis Part I: Occlusion cloud bands in comparison to CF and WFs Concepts for cyclogenesis Different types of cyclogenesis and examples Numerical parameters on isobaric and isentropic surfaces
For the operational forecaster one important precondition for the diagnosis and prediction of
 Initiation of Deep Moist Convection at WV-Boundaries Vienna, Austria For the operational forecaster one important precondition for the diagnosis and prediction of convective activity is the availability
A SEVERE WEATHER EVENT IN ROMANIA DUE TO MEDITERRANEAN CYCLONIC ACTIVITY
 A SEVERE WEATHER EVENT IN ROMANIA DUE TO MEDITERRANEAN CYCLONIC ACTIVITY Florinela Georgescu, Gabriela Bancila, Viorica Dima National Meteorological Administration, Bucharest, Romania Abstract Mediterranean
Occlusion cyclogenesis II
 Occlusion cyclogenesis II Upper level influences on cyclogenesis Vorticity Advection (CVA) and the 4-quadrant jet streak model (Uccellini) Potential Vorticity (PV) (Hoskins Theory) Rapid cyclogenesis 14
The water vapour channels of SEVIRI (Meteosat). An introduction
. An introduction") The water vapour channels of SEVIRI (Meteosat). An introduction jose.prieto@eumetsat.int Cachoeira P. July 2006 Formats 1.5 1 Objectives 2 Describe the characteristics of WV channels on board of SEVIRI
The water vapour channels of SEVIRI (Meteosat). An introduction jose.prieto@eumetsat.int Cachoeira P. July 2006 Formats 1.5 1 Objectives 2 Describe the characteristics of WV channels on board of SEVIRI
P4.9 THE SEVERE THUNDERSTORM OUTBREAK IN FINLAND ON 5 JULY 2002
 P4.9 THE SEVERE THUNDERSTORM OUTBREAK IN FINLAND ON 5 JULY 2002 Ari-Juhani Punkka* and Jenni Teittinen Finnish Meteorological Institute, Helsinki, Finland 1. INTRODUCTION On 5 July 2002 a fast propagating
Weather report 28 November 2017 Campinas/SP
 Weather report 28 November 2017 Campinas/SP Summary: 1) Synoptic analysis and pre-convective environment 2) Verification 1) Synoptic analysis and pre-convective environment: At 1200 UTC 28 November 2017
The October 2015 Supercell Storm in Israel
 The October 2015 Supercell Storm in Israel Alissa Razy, Elyakom Vadislavsky, Anat Baharad, Noam Halfon, Itsik Carmona, Yoav Levi, Amit Savir Introduction A high-impact weather event associated with severe
Chapter 14 Thunderstorm Fundamentals
 Chapter overview: Thunderstorm appearance Thunderstorm cells and evolution Thunderstorm types and organization o Single cell thunderstorms o Multicell thunderstorms o Orographic thunderstorms o Severe
Solutions to Comprehensive Final Examination Given on Thursday, 13 December 2001
 Name & Signature Dr. Droegemeier Student ID Meteorology 1004 Introduction to Meteorology Fall, 2001 Solutions to Comprehensive Final Examination Given on Thursday, 13 December 2001 BEFORE YOU BEGIN!! Please
Practical Use of the Skew-T, log-p diagram for weather forecasting. Primer on organized convection
 Practical Use of the Skew-T, log-p diagram for weather forecasting Primer on organized convection Outline Rationale and format of the skew-t, log-p diagram Some basic derived diagnostic measures Characterizing
Mid-Latitude Cyclones and Fronts. Lecture 12 AOS 101
 Mid-Latitude Cyclones and Fronts Lecture 12 AOS 101 Homework 4 COLDEST TEMPS GEOSTROPHIC BALANCE Homework 4 FASTEST WINDS L Consider an air parcel rising through the atmosphere The parcel expands as it
RGB Products: an easy and practical way to display multispectral satellite data (in combination with derived products)
") RGB Products: an easy and practical way to display multispectral satellite data (in combination with derived products) Dr. Jochen Kerkmann Training Officer EUMETSAT Multi-channel GEO satellites today Him-08
RGB Products: an easy and practical way to display multispectral satellite data (in combination with derived products) Dr. Jochen Kerkmann Training Officer EUMETSAT Multi-channel GEO satellites today Him-08
 http://www.ssec.wisc.edu/data/composites.html Red curve: Incoming solar radiation Blue curve: Outgoing infrared radiation. Three-cell model of general circulation Mid-latitudes: 30 to 60 latitude MID-LATITUDES
Figure 1: Tephigram for radiosonde launched from Bath at 1100 UTC on 15 June 2005 (IOP 1). The CAPE and CIN are shaded dark and light gray,
. The CAPE and CIN are shaded dark and light gray,") Figure 1: Tephigram for radiosonde launched from Bath at 1100 UTC on 1 June 200 (IOP 1). The CAPE and CIN are shaded dark and light gray, respectively; the thin solid line partially bounding these areas
Figure 1: Tephigram for radiosonde launched from Bath at 1100 UTC on 1 June 200 (IOP 1). The CAPE and CIN are shaded dark and light gray, respectively; the thin solid line partially bounding these areas
Final Examination, MEA 443 Fall 2008, Lackmann
 Place an X here to count it double! Name: Final Examination, MEA 443 Fall 2008, Lackmann If you wish to have the final exam count double and replace your midterm score, place an X in the box above. As
Thunderstorm: a cumulonimbus cloud or collection of cumulonimbus clouds featuring vigorous updrafts, precipitation and lightning
 Thunderstorm: a cumulonimbus cloud or collection of cumulonimbus clouds featuring vigorous updrafts, precipitation and lightning Thunderstorms are responsible for most of what we refer to as severe weather,
Summary of High Wind Event of 7 March 2004
 Summary of High Wind Event of 7 March 2004 This event was characterized by a very strong jet streak that developed over North Carolina by 00 UTC 8 March, as seen in the Eta model analysis at 300 mb, with
Warm season forecasting! Some material adapted from Material Produced at COMET for their Residence Course in Hydrometeorology
 Warm season forecasting! Some material adapted from Material Produced at COMET for their Residence Course in Hydrometeorology 1 Outline! Types of stability and application to forecasting! Dry and moist
Thunderstorm: a cumulonimbus cloud or collection of cumulonimbus clouds featuring vigorous updrafts, precipitation and lightning
 Thunderstorm: a cumulonimbus cloud or collection of cumulonimbus clouds featuring vigorous updrafts, precipitation and lightning Thunderstorm: a cumulonimbus cloud or collection of cumulonimbus clouds
A Cyclogenesis south of the Alps. Manfred Kurz Neustadt/Weinstraße
 A Cyclogenesis south of the Alps Manfred Kurz Neustadt/Weinstraße A cyclogenesis south of the Alps Surface maps 06-11-99, 00 UTC The occluded frontal system of a quasi-stationary low above the North Sea
Feel free to ask me if you are confused about the meaning of any question. Good luck, and have a great spring break!
 Name: _ MEA 214 Midterm Exam, Spring 2011 Feel free to ask me if you are confused about the meaning of any question. Good luck, and have a great spring break! 1.) For each of the characteristics listed
STATISTICAL ANALYSIS ON SEVERE CONVECTIVE WEATHER COMBINING SATELLITE, CONVENTIONAL OBSERVATION AND NCEP DATA
 12.12 STATISTICAL ANALYSIS ON SEVERE CONVECTIVE WEATHER COMBINING SATELLITE, CONVENTIONAL OBSERVATION AND NCEP DATA Zhu Yaping, Cheng Zhoujie, Liu Jianwen, Li Yaodong Institute of Aviation Meteorology
Large hail in Estonia on 12th August 2015
 Large hail in Estonia on 12th August 2015 Taimi Paljak, Velle Toll, Tanel Voormansik, Estonian Weather Service Introduction Hail is not as common in Northern Europe as in the rest of Europe due to the
Anthony A. Rockwood Robert A. Maddox
 Anthony A. Rockwood Robert A. Maddox An unusually intense MCS produced large hail and wind damage in northeast Kansas and northern Missouri during the predawn hours of June 7 th, 1982. Takes a look at
Kenneth L. Pryor* and Gary P. Ellrod Center for Satellite Applications and Research (NOAA/NESDIS) Camp Springs, MD
 Camp Springs, MD") P1.57 GOES WMSI PROGRESS AND DEVELOPMENTS Kenneth L. Pryor* and Gary P. Ellrod Center for Satellite Applications and Research (NOAA/NESDIS) Camp Springs, MD 1. INTRODUCTION A multi-parameter index has
P1.57 GOES WMSI PROGRESS AND DEVELOPMENTS Kenneth L. Pryor* and Gary P. Ellrod Center for Satellite Applications and Research (NOAA/NESDIS) Camp Springs, MD 1. INTRODUCTION A multi-parameter index has
Charles A. Doswell III, Harold E. Brooks, and Robert A. Maddox
 Charles A. Doswell III, Harold E. Brooks, and Robert A. Maddox Flash floods account for the greatest number of fatalities among convective storm-related events but it still remains difficult to forecast
METEOROLOGY. 1 The average height of the tropopause at 50 N is about A 14 km B 16 km C 11 km D 8 km
 1 The average height of the tropopause at 50 N is about A 14 km B 16 km C 11 km D 8 km 2 In the lower part of the stratosphere the temperature A is almost constant B decreases with altitude C increases
Weather Systems III: Thunderstorms and Twisters
 Weather Systems III: Thunderstorms and Twisters Review 1. Definition of airmasses? Bergeron classification of air masses 2. Surface weather analysis: Station model, wind speed code, present weather 3.
1 of 7 Thunderstorm Notes by Paul Sirvatka College of DuPage Meteorology. Thunderstorms
 1 of 7 Thunderstorm Notes by Paul Sirvatka College of DuPage Meteorology Thunderstorms There are three types of thunderstorms: single-cell (or air mass) multicell (cluster or squall line) supercell Although
Lec 10: Interpreting Weather Maps
 Lec 10: Interpreting Weather Maps Case Study: October 2011 Nor easter FIU MET 3502 Synoptic Hurricane Forecasts Genesis: on large scale weather maps or satellite images, look for tropical waves (Africa
The development and evolution of deep convection and heavy rainfall
 The development and evolution of deep convection and heavy rainfall Unique in spectra, space and time The spatial and temporal domains of the phenomena being investigated drive the satellite s spectral
Test Form: A Key Final Exam: Spring 2011
 Test Form: A Key Final Exam: Spring 2011 Instructions: Write your name (last name and first name) on your bubble sheet. Write your student identification number on the bubble sheet, and carefully and completely
QUALITY OF MPEF DIVERGENCE PRODUCT AS A TOOL FOR VERY SHORT RANGE FORECASTING OF CONVECTION
 QUALITY OF MPEF DIVERGENCE PRODUCT AS A TOOL FOR VERY SHORT RANGE FORECASTING OF CONVECTION C.G. Georgiev 1, P. Santurette 2 1 National Institute of Meteorology and Hydrology, Bulgarian Academy of Sciences
WATER VAPOUR IMAGERY ANALYSIS IN 7.3µ/6.2µ FOR DIAGNOSING THERMO-DYNAMIC CONTEXT OF INTENSE CONVECTION
 WATER VAPOUR IMAGERY ANALYSIS IN 7.3µ/6.2µ FOR DIAGNOSING THERMO-DYNAMIC CONTEXT OF INTENSE CONVECTION P. Santurette 1 and C.G. Georgiev 2 1 Météo-France, 42, Avenue G. Coriolis, 31057 Toulouse Cedex 01,
Diagnostic tools using a mesoscale NWP model for the early warning of convection
 Meteorol. Appl. 5, 329 349 (1998) Diagnostic tools using a mesoscale NWP model for the early warning of convection Véronique Ducrocq, Diane Tzanos and Stéphane Sénési, GAME/CNRM, Météo-France, 31057 Toulouse
A more detailed and quantitative consideration of organized convection: Part I Cold pool dynamics and the formation of squall lines
 A more detailed and quantitative consideration of organized convection: Part I Cold pool dynamics and the formation of squall lines Note: Lecture notes presented here based on course Daily Weather Laboratory
CLOUDS & THUNDERSTORMS
 Funding provided by NOAA Sectoral Applications Research Project CLOUDS & THUNDERSTORMS Basic Climatology Oklahoma Climatological Survey How are clouds made? Clouds form when air is cooled to its dewpoint
SMALL SCALE WV-FEATURE ABOVE FRANCE: NEXT DAY SEVERE WEATHER OVER THE NETHERLANDS
 SMALL SCALE WV-FEATURE ABOVE FRANCE: NEXT DAY SEVERE WEATHER OVER THE NETHERLANDS F.P. Debie KNMI PO Box 201, AE de Bilt, The Netherlands ABSTRACT Due to economic reasons world-wide can be seen that the
THE MESOSCALE CONVECTIVE SYSTEM FROM
 RISCURI I CATASTROFE, NR.X, VOL.9, NR. 1/2011 THE MESOSCALE CONVECTIVE SYSTEM FROM 24.07.2010 ELZA HAUER, 1 C. NICHITA 1 ABSTRACT. The Mesoscale Convective System from 24.07.2010. A severe weather event
Forecasting Polar Lows. Gunnar Noer The Norwegian Meteorological Institute in Tromsø
 Forecasting Polar Lows Gunnar Noer The Norwegian Meteorological Institute in Tromsø Longyearbyen Hopen Bear Island Jan Mayen Tromsø Gunnar Noer Senior forecaster / developer for polar meteorology The Norwegian
Chapter 3 Convective Dynamics 3.4. Bright Bands, Bow Echoes and Mesoscale Convective Complexes
 Chapter 3 Convective Dynamics 3.4. Bright Bands, Bow Echoes and Mesoscale Convective Complexes Photographs Todd Lindley Bright band associated with stratiform precipitation in a squall line system 1 Bright
and 24 mm, hPa lapse rates between 3 and 4 K km 1, lifted index values
 3.2 Composite analysis 3.2.1 Pure gradient composites The composite initial NE report in the pure gradient northwest composite (N = 32) occurs where the mean sea level pressure (MSLP) gradient is strongest
Multiscale Analyses of Inland Tropical Cyclone Midlatitude Jet Interactions: Camille (1969) and Danny (1997)
 and Danny (1997)") Multiscale Analyses of Inland Tropical Cyclone Midlatitude Jet Interactions: Camille (1969) and Danny (1997) Matthew Potter, Lance Bosart, and Daniel Keyser Department of Atmospheric and Environmental
Multiscale Analyses of Inland Tropical Cyclone Midlatitude Jet Interactions: Camille (1969) and Danny (1997) Matthew Potter, Lance Bosart, and Daniel Keyser Department of Atmospheric and Environmental
Reading. What meteorological conditions precede a thunderstorm? Thunderstorms: ordinary or single cell storms, multicell storms, supercell storms
 Thunderstorms: ordinary or single cell storms, multicell storms, supercell storms Reading Ahrens, Chapter 14: Thunderstorms and Tornadoes This lecture + next (Lightning, tornadoes) will cover the topic.
Module 9 Weather Systems
 Module 9 Weather Systems In this module the theory of atmospheric dynamics is applied to different weather phenomena. The first section deals with extratropical cyclones, low and high pressure areas of
INTRODUCTION TO METEOROLOGY PART ONE SC 213 MAY 21, 2014 JOHN BUSH
 INTRODUCTION TO METEOROLOGY PART ONE SC 213 MAY 21, 2014 JOHN BUSH WEATHER PATTERNS Extratropical cyclones (low pressure core) and anticyclones (high pressure core) Cold fronts and warm fronts Jet stream
Chapter 8 cont. Clouds and Storms
 Chapter 8 cont. Clouds and Storms Spring 2007 Clouds and Storms Clouds cover ~ 50% of earth at any time. Clouds are linked to a number of condensation processes. Cloud morphology, cloud types, associated
Name: Section/TA Name: Atmospheric Science 101, Spring 2003 Midterm 2 Thursday 22 May 2003 Version A
 Name: Section/TA Name: Atmospheric Science 101, Spring 2003 Midterm 2 Thursday 22 May 2003 Version A Multiple Choice (2 points each) Choose the best answer and mark it on a Scantron sheet. 1. Choose the
Clouds and turbulent moist convection
 Clouds and turbulent moist convection Lecture 2: Cloud formation and Physics Caroline Muller Les Houches summer school Lectures Outline : Cloud fundamentals - global distribution, types, visualization
Page 1. Name:
 Name: 1) As the difference between the dewpoint temperature and the air temperature decreases, the probability of precipitation increases remains the same decreases 2) Which statement best explains why
SEVERE AND UNUSUAL WEATHER
 SEVERE AND UNUSUAL WEATHER Basic Meteorological Terminology Adiabatic - Referring to a process without the addition or removal of heat. A temperature change may come about as a result of a change in the
Quasi-Geostrophic Implications
 Chapter 10 Quasi-Geostrophic Implications When you look at a weather chart with all its isolines and plotted data, you need a framework upon which to interpret what you see. Quasi-geostrophic theory provides
b. The boundary between two different air masses is called a.
 NAME Earth Science Weather WebQuest Part 1. Air Masses 1. Find out what an air mass is. http://okfirst.mesonet.org/train/meteorology/airmasses.html a. What is an air mass? An air mass is b. The boundary
Science Olympiad Meteorology Quiz #2 Page 1 of 8
 1) The prevailing general direction of the jet stream is from west to east in the northern hemisphere: 2) Advection is the vertical movement of an air mass from one location to another: 3) Thunderstorms
Air Masses of North America cp and ca air masses Air mass characterized by very cold and dry conditions
 Chapter 8: Air Masses, Fronts, and Middle-Latitude Cyclones Air masses Fronts Middle-latitude cyclones Air Masses Air mass an extremely large body of air whose properties of temperature and humidity are
Advanced Spotter Training Lesson 4: The Nature of Thunderstorms
 Advanced Spotter Training 2009 Lesson 4: The Nature of Thunderstorms From Last Time We discussed the different ways to make air rise. We discussed convection, convergence, and the different kinds of fronts.
TOPICS: What are Thunderstorms? Ingredients Stages Types Lightning Downburst and Microburst
 THUNDERSTORMS TOPICS: What are Thunderstorms? Ingredients Stages Types Lightning Downburst and Microburst What are Thunderstorms? A storm produced by a cumulonimbus cloud that contains lightning and thunder
IOP-2 Summary of Operations 03 June UTC 04 June UTC Authors: Market, Kastman
 IOP-2 Summary of Operations 03 June 2014 2200 UTC 04 June 2014 1200 UTC Authors: Market, Kastman IOP-2 focused on the slow-moving warm front that extended east from a cyclone that was situated over eastern
Earth and Space Science. Teacher s Guide
 Earth and Space Science Teacher s Guide WALCH PUBLISHING Table of Contents To the Teacher............................................................. vi Classroom Management....................................................
Tornadogenesis in Supercells: The Three Main Ingredients. Ted Funk
 Tornadogenesis in Supercells: The Three Main Ingredients Ted Funk NWS Louisville, KY Spring 2002 Environmental Parameters Supercells occur within environments exhibiting several wellknown characteristics
1. Which weather map symbol is associated with extremely low air pressure? A) B) C) D) 2. The diagram below represents a weather instrument.
 B) C) D) 2. The diagram below represents a weather instrument.") 1. Which weather map symbol is associated with extremely low air pressure? 2. The diagram below represents a weather instrument. Which weather variable was this instrument designed to measure? A) air pressure
1. Which weather map symbol is associated with extremely low air pressure? 2. The diagram below represents a weather instrument. Which weather variable was this instrument designed to measure? A) air pressure
Middle Latitude Cyclones a storm that forms at middle and high latitudes, outside of the tropics.
 Middle Latitude Cyclones a storm that forms at middle and high latitudes, outside of the tropics. Polar Front Theory a theory that explains the life cycle of mid latitude cyclones and their associated
INTERPRETATION GUIDE TO MSG WATER VAPOUR CHANNELS
 INTERPRETATION GUIDE TO MSG WATER VAPOUR CHANNELS C.G. Georgiev1 and P. Santurette2 1 National Institute of Meteorology and Hydrology, Tsarigradsko chaussee 66, 1784 Sofia, Bulgaria 2 Météo-France, 42,
NEFODINA: A TOOL FOR AUTOMATIC DETECTION OF SEVERE CONVECTIVE PHENOMENA
 NEFODINA: A TOOL FOR AUTOMATIC DETECTION OF SEVERE CONVECTIVE PHENOMENA Davide MELFI IAFMS, Centro Operativo per la Meteorologia, Pomezia (Rome), Italy Abstract The NEFODINA (DYNAmic NEFOanalisys) product
April 13, 2006: Analysis of the Severe Thunderstorms that produced Hail in Southern Wisconsin
 April 13, 2006: Analysis of the Severe Thunderstorms that produced Hail in Southern Wisconsin Danielle Triolo UW Madison Undergraduate 453 Case Study May 5, 2009 ABSTRACT On April 13, 2006 the states of
Science Olympiad Meteorology Quiz #1 Page 1 of 7
 1) What is generally true about the stratosphere: a) Has turbulent updrafts and downdrafts. b) Has either a stable or increasing temperature profile with altitude. c) Where the auroras occur. d) Both a)
AOMSUC-6 Training Event
 Effective use of high temporal and spatial resolution Himawari-8 data AOMSUC-6 Training Event Bodo Zeschke Australian Bureau of Meteorology Training Centre Australian VLab Centre of Excellence Content
9D.3 THE INFLUENCE OF VERTICAL WIND SHEAR ON DEEP CONVECTION IN THE TROPICS
 9D.3 THE INFLUENCE OF VERTICAL WIND SHEAR ON DEEP CONVECTION IN THE TROPICS Ulrike Wissmeier, Robert Goler University of Munich, Germany 1 Introduction One does not associate severe storms with the tropics
1 August 2006 An Investigation of a Bow Echo along the Wasatch Front. Randy Graham and Chris Gibson 6 April 2007
 1 August 2006 An Investigation of a Bow Echo along the Wasatch Front Randy Graham and Chris Gibson 6 April 2007 Overview Environment review Review of terrain-induced discrete propagation Bow Echo interactions
Chapter 12 Fronts & Air Masses
 Chapter overview: Anticyclones or highs Air Masses o Classification o Source regions o Air masses of North America Fronts o Stationary fronts o Cold fronts o Warm fronts o Fronts and the jet stream o Frontogenesis
Chapter 8 cont. Clouds and Storms. Spring 2018
 Chapter 8 cont. Clouds and Storms Spring 2018 Clouds and Storms Clouds cover ~ 50% of earth at any time. Clouds are linked to a number of condensation processes. Cloud morphology, cloud types, associated
AIR MASSES. Large bodies of air. SOURCE REGIONS areas where air masses originate
 Large bodies of air AIR MASSES SOURCE REGIONS areas where air masses originate Uniform in composition Light surface winds Dominated by high surface pressure The longer the air mass remains over a region,
Tornadoes forecasting, dynamics and genesis. Mteor 417 Iowa State University Week 12 Bill Gallus
 Tornadoes forecasting, dynamics and genesis Mteor 417 Iowa State University Week 12 Bill Gallus Tools to diagnose severe weather risks Definition of tornado: A vortex (rapidly rotating column of air) associated
Department of Geosciences San Francisco State University Spring Metr 201 Monteverdi Quiz #5 Key (100 points)
") Department of Geosciences Name San Francisco State University Spring 2012 Metr 201 Monteverdi Quiz #5 Key (100 points) 1. Fill in the Blank or short definition. (3 points each for a total of 15 points)
Department of Geosciences Name San Francisco State University Spring 2012 Metr 201 Monteverdi Quiz #5 Key (100 points) 1. Fill in the Blank or short definition. (3 points each for a total of 15 points)
according to and water. High atmospheric pressure - Cold dry air is other air so it remains close to the earth, giving weather.
 EARTH'S ATMOSPHERE Composition of the atmosphere - Earth's atmosphere consists of nitrogen ( %), oxygen ( %), small amounts of carbon dioxide, methane, argon, krypton, ozone, neon and other gases such
HAZARDOUS WEATHER 1. Dr. Julie Laity Geography 266
 HAZARDOUS WEATHER 1 Dr. Julie Laity Geography 266 Violent Weather Thunderstorms Atmospheric turbulence Lightning and thunder Hail Derechos Tornadoes Tornado measurement and science Tropical Cyclones Hurricanes
ESCI 344 Tropical Meteorology Lesson 8 Tropical Weather Systems
 ESCI 344 Tropical Meteorology Lesson 8 Tropical Weather Systems References: Tropical Climatology (2 nd Ed.), McGregor and Nieuwolt Climate and Weather in the Tropics, Riehl Climate Dynamics of the Tropics,
How to display RGB imagery by SATAID
 How to display RGB imagery by SATAID Akihiro SHIMIZU Meteorological Satellite Center (MSC), Japan Meteorological Agency (JMA) Ver. 2015110500 RGB imagery on SATAID SATAID software has a function of overlapping
Tornadoes forecasting, dynamics and genesis. Mteor 417 Iowa State University Week 12 Bill Gallus
 Tornadoes forecasting, dynamics and genesis Mteor 417 Iowa State University Week 12 Bill Gallus Tools to diagnose severe weather risks Definition of tornado: A vortex (rapidly rotating column of air) associated
Joseph Kagenyi Principal Meteorologist (RS/GIS) IMTR-NAIROBI 13 th UFA September 2018
 IMTR-NAIROBI 13 th UFA September 2018") Joseph Kagenyi Principal Meteorologist (RS/GIS) IMTR-NAIROBI 13 th UFA 24-28 September 2018 kagenyijn@gmail.com 1. PUMA WorkStation structure 2. Data Available on PUMA Station 3. PUMA Nowcasting Applications
Joseph Kagenyi Principal Meteorologist (RS/GIS) IMTR-NAIROBI 13 th UFA 24-28 September 2018 kagenyijn@gmail.com 1. PUMA WorkStation structure 2. Data Available on PUMA Station 3. PUMA Nowcasting Applications
Space Atmospheric Gases. the two most common gases; found throughout all the layers a form of oxygen found in the stratosphere
 Earth s atmospheric layers Earth s atmosphere is the layer of gases that surrounds the planet and makes conditions on Earth suitable for living things. Layers Earth s atmosphere is divided into several
eport Nataša Strelec Mahović Meteorological and Hydrological Service, Grič 3, Zagreb, Croatia EUMeTrain project Abstract
 eport Nataša Strelec Mahović Meteorological and Hydrological Service, Grič 3, Zagreb, Croatia EUMeTrain project Abstract The paper presents the concept of eport, an interface enabling the combined analysis
What does a raindrop look like as it is falling? A B C
 What does a raindrop look like as it is falling? A B C As the raindrop falls, it bumps into air molecules, flattening out the bottom of the drop! Force or air resistance Force of gravity Water can be in
Synoptic Meteorology I: Skew-T Diagrams and Thermodynamic Properties
 Synoptic Meteorology I: Skew-T Diagrams and Thermodynamic Properties For Further Reading Most information contained within these lecture notes is drawn from Chapters 1, 2, 4, and 6 of The Use of the Skew
Air Masses and Fronts II
 Air Masses and Fronts II Brief review An air mass is a large body of air whose properties of temperature and humidity are fairly similar in any horizontal direction Source regions for air masses tend to
Lecture #14 March 29, 2010, Monday. Air Masses & Fronts
 Lecture #14 March 29, 2010, Monday Air Masses & Fronts General definitions air masses source regions fronts Air masses formation types Fronts formation types Air Masses General Definitions a large body
Forecast for 6/28-7/31. Forecaster: Matthew Brewer Forecast made at: 12z 6/27/2017
 Forecast for 6/28-7/31 Forecaster: Matthew Brewer Forecast made at: 12z 6/27/2017 Whiteface lodge Mesonet Meteogram for the past 24 hours http://www.nysmesonet.org/data/meteogram#?stid=wfmb Whiteface Summit
Forecasting Local Weather
 Forecasting Local Weather Sea/Land Breeze Temperature Dew Fog Frost Snow Thunderstorms Tropical Cyclones Temperatures: Radiation Balance Typical Diurnal Variation of Temperature Min soon after dawn Temp
WEATHER. Review Note Cards
 WEATHER Review Note Cards Thermometer Weather instrument that measures air temperature Units include F, C, and K ESRT 13 Sling Psychrometer Weather instrument that measures relative humidity and dewpoint
Mechanical Turbulence Wind forms eddies as it blows around hanger, stands of trees or other obstructions
 Turbulence Low-level Turbulence below 15,000 feet consists of Mechanical Turbulence Convective Turbulence Frontal Turbulence Wake Turbulence Mechanical Turbulence Wind forms eddies as it blows around hanger,
CHAPTER 11 THUNDERSTORMS AND TORNADOES MULTIPLE CHOICE QUESTIONS
 CHAPTER 11 THUNDERSTORMS AND TORNADOES MULTIPLE CHOICE QUESTIONS 1. A thunderstorm is considered to be a weather system. a. synoptic-scale b. micro-scale c. meso-scale 2. By convention, the mature stage
The most abundant gas in the atmosphere by volume is. This gas comprises 78% of the Earth atmosphere by volume.
 The most abundant gas in the atmosphere by volume is. This gas comprises 78% of the Earth atmosphere by volume. A. Oxygen B. Water Vapor C. Carbon Dioxide D. Nitrogen An isobar is a line of constant. A.
Atmosphere and Weather Revision Notes
 Atmosphere and Weather Revision Notes Atmosphere The blanket of gases that surrounds the Earth is called the atmosphere. The main gases are nitrogen (78 %), oxygen (21 %), water vapour, ozone and carbon
P3.17 THE DEVELOPMENT OF MULTIPLE LOW-LEVEL MESOCYCLONES WITHIN A SUPERCELL. Joshua M. Boustead *1 NOAA/NWS Weather Forecast Office, Topeka, KS
 P3.17 THE DEVELOPMENT OF MULTIPLE LOW-LEVEL MESOCYCLONES WITHIN A SUPERCELL Joshua M. Boustead *1 NOAA/NWS Weather Forecast Office, Topeka, KS Philip N. Schumacher NOAA/NWS Weather Forecaster Office, Sioux
GEO1010 tirsdag
 GEO1010 tirsdag 31.08.2010 Jørn Kristiansen; jornk@met.no I dag: Først litt repetisjon Stråling (kap. 4) Atmosfærens sirkulasjon (kap. 6) Latitudinal Geographic Zones Figure 1.12 jkl TØRR ATMOSFÆRE Temperature
Guided Notes Weather. Part 1: Weather Factors Temperature Humidity Air Pressure Winds Station Models
 Guided Notes Weather Part 1: Weather Factors Temperature Humidity Air Pressure Winds Station Models. 1. What is weather? Weather: short-term atmospheric conditions in a specific area at a specific time
Hurricanes. April 14, 2009
 Tropical Weather & Hurricanes Chapter 15 April 14, 2009 Tropical meteorology Tropics characterized by seasonal wet and drier periods- wet when sun is nearly overhead at noon and inter-tropical convergence