Occlusion cyclogenesis II
|
|
|
- Lucy Jennings
- 6 years ago
- Views:
Transcription
1 Occlusion cyclogenesis II Upper level influences on cyclogenesis Vorticity Advection (CVA) and the 4-quadrant jet streak model (Uccellini) Potential Vorticity (PV) (Hoskins Theory) Rapid cyclogenesis

2 14 July 2016/18 UTC WCB occlusion Cyan: Orange/Black: zeroline of relative vorticity 300 hpa Red/blue: relative vorticity 04 February 2016/12 UTC CCB occlusion Orange/ Black: zeroline of relative vorticity 300 hpa Red/blue : relative vorticity
: relative vorticity advection CVA 300")
3 14 July 2016/18 UTC WCB occlusion Cyan: Height contours 300 hpa Yellow: isotachs 300 hpa Orange/Black: Red (left, right): relative vorticity advection CVA 300 hpa 04 February 2016/12 UTC CCB occlusion Cyan: Height contours 300 hpa Yellow: isotachs 300 hpa Orange/Black: Red (left, right): relative vorticity advection CVA 300 hpa
4 Reflectance of occlusion process / cyclogenesis in derived upper level parameters For Cold and Warm Fronts Temperature Advection is a dominating parameter For Cyclogenesis also Vorticity and Vorticity Advection are dominating parameters Vorticity = rot z v 2 = v/ x - u/ y = + f f = 2 sin cyclonic: 0 (NH) < 0 (SH) anticyclonic: < 0 (NH), 0 (SH) Vorticity is a quality of the stream field Vorticity describes rotation movements Vorticity is one of the parameters that are involved in the configuration of cloudiness Vorticity Advection VA = - v. Advection of rel. vorticity VA = - v. Advection of abs. vorticity VA > 0 positive Vorticity advection: PVA/CVA VA < 0 negative Vorticity advection: NVA/AVA PVA/CVA: it becomes more cyclonic or less anticyclonic (NH) NVA/AVA: it becomes more antiyclonic or less cyclonic (NH) The Advection of Vorticity is one of the parameters that are involved in the development of cloudiness
5 Omega equation in a quasi geostrophic system Assumptions for a Quasi-geostrophic Systems: 1.) there is hydrostatic equilibrium in the vertical 2.) Pressure- and vorticity fields are in a geostrophic equilibrium 1.) 2.) 3.) The right side in this representation of the omega equation consists of three terms: 1.) the vertical change of the vorticity advection 2.) the Laplacian of the temperature advection(the change of the horizontal gradient of the temperature advection) 3.) the Laplacian of diabatic heat transfer (the change of the gradient of diabatic heat transfer)
6 Some basic considerations for vorticity and vorticity advection the vertical change of the vorticity advection / p. (- v p. ) Upward motion is connected with The increase of PVA (CVA) with height The decrease of NVA (AVA) with height In the method of analysing satellite images together with numerical model a simplification is applied: Instead of the vertical change of Vorticity Advection only the pronounced maxima of Vorticity Advection in upper levels (500, 400, 300, 250 hpa) are taken into account This needs the assumption of: Increase of wind speed with height This is reasonable but every time fulfilled
 Vorticity")

7 The significance of processes in the upper troposphere for cyclogenesis Vorticity (rotation) Vorticity Advection Vorticity consists of two contributions: curvature and shear vorticity Typical areas for Positive (Cyclonic) Vorticity values are (on the NH): lows, troughs and jet streaks If a weather system with high cyclonic values of vorticity is moving: Downstream from Vorticity maxima becomes the troposphere more cyclonic Areas of Positive/Cyclonic Vorticity Advection (PVA(CVA)
: CVA 300 hpa")
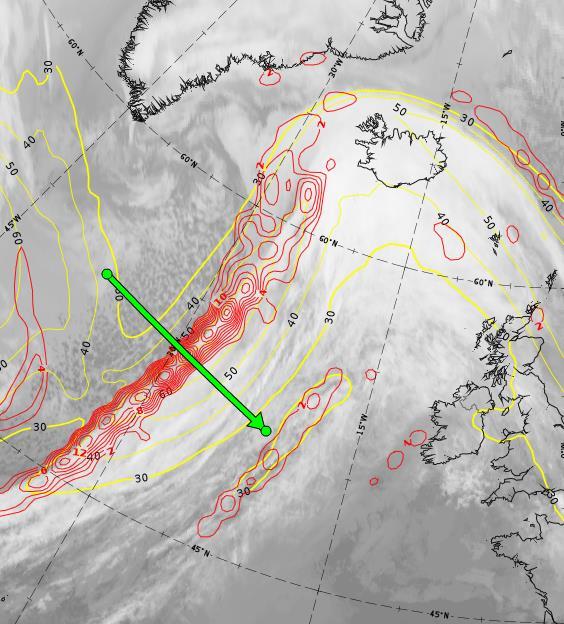
8 14 July 2016/18 UTC WCB occlusion Orange: Zeroline of relative vorticity 300 hpa Cyan: Height contours 300 hpa Red : CVA 300 hpa 4 February 2016/12 UTC CCB occlusion Orange: Zeroline of relative vorticity 300 hpa Yellow: Isotachs 300 hpa Red (left): CVA 300 hpa
9 Jet streaks 4-quadrant Model (Uccellini) Consideration 1: Jet streaks: Distribution of vorticity and vorticity advection in jet level N-Pole cold N-Pole cold Equator warm Equator warm Vorticitymaximum on the cyclonic side of a jet streak maximum (increased shear) Vorticityminimum on the anticyclonic side


10 14 July 2016/18 UTC WCB occlusion Black: zeroline of rel. Vorticity 300 hpa Red/blue: rel. vorticity (cycl/anticycl.) 300 hpa Yellow: isotachs 300 hpa Red (left): CVA 300 hpa 4 February 2016/12 UTC CCB occlusion Black: zeroline of rel. Vorticity 300 hpa Red/blue: rel. vorticity (cycl/anticycl.) 300 hpa Yellow: isotachs 300 hpa Red (left): CVA 300 hpa

11 Interpretation of small scale features and separation of noise from meteorologically useful signals In a numerical model with a small grid distance (new ECMWF model as basis for eport Pro) much more small scale phenomena are analysed Many of these small scale structures represent noise and do not contain a meteorologically significant content Partly they can be mathematically filtered/smoothed but very strong values remain Meteorologically important structures have to be separated from meteorologically not so indicative ones. Jet streaks and vorticity advection are a typical example: Often small bands of very high CVA values appear at the jet axis They are dependant on very high relative vorticity gradients and fast system movement 4 February 2016/12 UTC
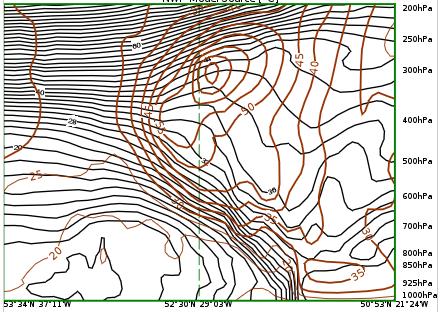
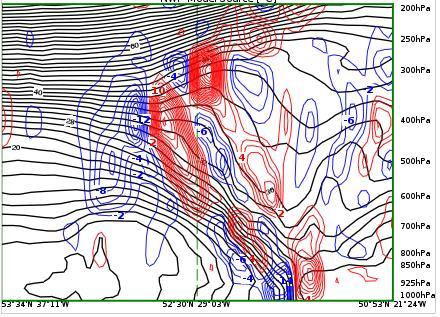
12 Interpretation of small scale features and separation of noise from applicable signals 4 February 2016/12 UTC

13 Jet streaks 4-quadrant Model (Uccellini) Consideration 2: Jet streaks: Stream components in jet level entrance exit acceleration retardation Acceleration vector Ageostrophic Wind vector Resulting vector
14 Jet streaks 4-quadrant Model (Uccellini) Consideration 3: Jet streaks: Vertical cross section in entrance ad exit region left right frontogenetic frontolytic Entrance Region: 1. Frontogenetic in low levels 2. Frontolytic in middle levels 3. Upward motion in right entrance region 4. Preferred area for wave developments Exit Region: 1. Frontolytic in low levels 2. Frontogenetic in middle levels 3. Upward motion in left exit region 4. Preferred area for rapid developments
: Black: Green: VCS: black: Brown: Orange: isotachs")
 VCS line in exit region moist isentropes")
15 2 January 2016/ 18UTC Exit region Yellow: Red (left): Red(right): Black: Green: VCS: black: Brown: Orange: isotachs cyclonic rel. Vorticity CVA maxima zeroline of rel. Vorticity (jet axis) VCS line in exit region moist isentropes isotachs jetcore
 omega (rising/sinking) Brown: Orange: isotachs")
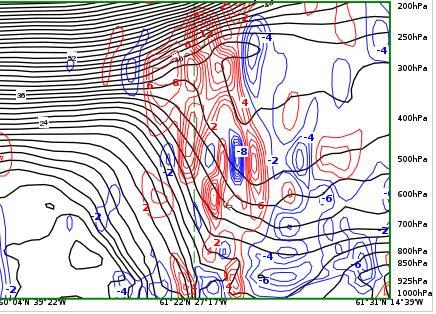
16 2 January 2016/ 18UTC Exit region VCS: black: Red/blue(above): Red/blue(below): moist isentropes VA (CVA/NVA) omega (rising/sinking) Brown: Orange: isotachs jetcore
: Black: Green: VCS: black: Brown: Orange: isotachs")
 VCS line in entrance region moist")
17 2 January 2016/ 18UTC Entrance region Yellow: Red (left): Red(right): Black: Green: VCS: black: Brown: Orange: isotachs cyclonic rel. Vorticity CVA maxima zeroline of rel. Vorticity (jet axis) VCS line in entrance region moist isentropes isotachs jetcore
:")
 omega (rising/sinking) Brown:")
18 2 January 2016/ 18UTC Entrance region VCS: black: Red/blue(above): Red/blue(below): moist isentropes VA (CVA/NVA) omega (rising/sinking) Brown: Orange: isotachs jetcore
: Black: Green: VCS: black: Brown: Orange:")
 VCS line in exit region moist")
19 14 July 2016/ 18UTC Exit region Yellow: Red (left): Red(right): Black: Green: VCS: black: Brown: Orange: isotachs cyclonic rel. Vorticity CVA maxima zeroline of rel. Vorticity (jet axis) VCS line in exit region moist isentropes isotachs jetcore
 omega (rising/sinking) Brown: Orange: isotachs")
20 14 July 2016/ 18UTC Exit region VCS: black: Red/blue(above): Red/blue(below): moist isentropes VA (CVA/NVA) omega (rising/sinking) Brown: Orange: isotachs jetcore
: Red(right): Black:")

 VCS line in exit")
21 4 February 2016/ 12UTC Exit region Yellow: Red (left): Red(right): Black: Green: VCS: black: Brown: Orange: isotachs cyclonic rel. Vorticity CVA maxima zeroline of rel. Vorticity (jet axis) VCS line in exit region moist isentropes isotachs jetcore

22 4 February 2016/ 182UTC Exit region Yellow: Red (left): Red(right): Black: Green: VCS: black: Brown: Orange: isotachs cyclonic rel. Vorticity CVA maxima zeroline of rel. Vorticity (jet axis) VCS line in exit region moist isentropes isotachs jetcore
23 Rapid Cyclogenesis Intensive deepening of surface low within 12 hours the rate of deepening of the central sea-level pressure greater than or equal to 1 mb or 1 hpa per hour, generally over a period of time 12 hours or longer Cannot be explained with the classical polar front theory alone They are connected with very dangerous weather events especially in wind and precipitation; damaging events Very typical structure in satellite images which show involvement of processes in upper levels


24 8 January 2015/ 06 UTC: Initial stage 8 January 2015/ 12 UTC: development stage Cloud Head Cloud Head 8-9 January 2015: Rapid Cyclogenesis: IR 8 January 2015/ 18 UTC: advanced stage 9 January 2015/ 06 UTC: mature stage


25 8 January 2015/ 06 UTC: Initial stage 8 January 2015/ 12 UTC: development stage Cloud Head Cloud Head 8-9 January 2015: Rapid Cyclogenesis: WV 8 January 2015/ 18 UTC: advanced stage 9 January 2015/ 06 UTC: mature stage


26 Cloud Head Cloud Head 8 January 2015/ 06 UTC: Initial stage 8 January 2015/ 12 UTC: development stage 8-9 January 2015: Rapid Cyclogenesis: Air Mass 8 January 2015/ 18 UTC: advanced stage 9 January 2015/ 06 UTC: mature stage

 8 January 2015/ 18 UTC:")

27 8 January 2015/ 06 UTC: Initial stage 8 January 2015/ 12 UTC: development stage Magenta: Height contours 1000 hpa (close surface Low) 8 January 2015/ 18 UTC: advanced stage Deepening of height at 1000 hpa from -8 gpm to -28 gpm within 12 hours


28 8 January 2015/ 06 UTC: Initial stage 8 January 2015/ 12 UTC: development stage Rapid Cyclogenesis PVA max In LEX Of intensive jet streak Why such A rapid cyclogenesis!? 8 January 2015/ 18 UTC: advanced stage
29 The significance of processes in the upper troposphere for cyclogenesis: Potential Vorticity (PV) PV = - g ( f + ) / p = const PV (IPV) is constant for adiabatic processes; that means constant on isentropic surfaces Product of vorticity and stability is constant on isentropic surfaces PV has very high values in stratosphere >= 2 units (NH); <= -2 units (SH) If stratospheric air with the inherent PV protrudes downward from stratosphere into troposphere - static stability decreases and (because of conservation) cyclonic vorticity has to increase there This is a motor for enhancing cyclogenesis
 PV Anomalies")

30 The significance of processes in the upper troposphere for cyclogenesis: Potential Vorticity (PV) PV Anomalies - Hoskins theory Interaction and mutual intensification of cyclonic circulation: Rapid cyclogenesis 8 January13/ 00
31 Importance of PV and PV anomaly The height of PV >= 2 units (-2 on SH) shows how far the air from stratosphere has protruded downward In case of classical cyclogenesis the typical height is hpa In case of a rapid cyclogenesis it is down to hpa and at same time the intensification of the lower tropospheric PV values takes place Consequently rapidly a tunnel of high PV values from tropopause down to surface develops Vertical cross sections can show the downward protrusion below the frontal surface


32 8 January 2015/ 06 UTC: Initial stage 8 January 2015/ 12 UTC: development stage Magenta: Height of PV >=2 units 8 January 2015/ 18 UTC: advanced stage


33 8 January 2015: Top: 06 UTC, initial stage Middle: 12 UTC, development stage Bottom: 18 UTC, advanced stage Left row: Magenta: height contours 1000 hpa Blue: shear vorticity 300 hpa Black: zeroline odf shear vorticity 300 hpa Right row: Magenta: Height of PV>=2 units


34 Black: moist isentropes Red: PV Rapid Cylogenesis: Downward Protrusion of stratospheric Air tropopause folding

35 Parameter Precipitation Description Intense precipitation associated with the Warm Conveyor Belt. Thunderstorms are possible within the inner edge of the cloud head at the western side of the surface low as well as within the dry slot Temperature Strong rise in surface temperature within the area of Warm Conveyor Belt. Wind (incl. gusts) Strong winds within the area of the cloud head. In extreme cases winds reaching hurricane force. Very strong gusts in the transition zone between dark and white as can be seen in the WV channels near the cold front and the cloud head Possibility of the development of a sting jet in the Advanced and Mature stage in the southern semicircle of the low centre and S of the decaying cloud spiral. (See below) In case of a sting jet hurricane force winds with gusts up to 200 km/h are possible. Other relevant information Very strong pressure falls and rises. In the initial stage, falls ahead exceed the rises behind.

36 9 January 2015/ 06 UTC: mature stage
37 8 January 2015/ 18 UTC NWCSAF products u.l.: cloud type u.r.: Precipitating Cloud l.l.: Cloud top Pressure l.r.: Convective rainfall rate


38 8 January 2015/18 UTC 9 January 2015/00 UTC 9 January 2015/06 UTC 8 9 January 2016 Cloud Type (NWCSAF)


39 8 January 2015/18 UTC 9 January 2015/00 UTC 9 January 2015/06 UTC 8 9 January 2016 Cloud Top Pressure (NWCSAF)


40 8 January 2015/18 UTC 9 January 2015/00 UTC 9 January 2015/06 UTC 8 9 January 2016 Precipitation Clouds (NWCSAF)


41 8 January 2015/18 UTC 9 January 2015/00 UTC 9 January 2015/06 UTC 8 9 January 2016 Convective Rainfall Rate (NWCSAF)


42 8 January 2015/ 06 UTC: Initial stage 8 January 2015/ 12 UTC: development stage 10 m winds 8 January 2015/ 18 UTC: advanced stage 9 January 2015/ 06 UTC: mature stage
43 Rapid Cyclogenesis Cases There are cases from the last years in the course page 2016 no intensive rapid cyclogenesis could be observed but some developments which have many features of a rapid cyclogenesis: 6 May 2016/ 06-18


 7 May")
44 6 May 2016/06 UTC/IR 6 May 2016/12 UTC/IR Blue: Height contours 1000 hpa (close surface Low) 6 May 2016/18 UTC/IR Deepening of height at 1000 hpa from 7 gpm to -3 gpm within 12 hours (-8 within 18 hours) 7 May 2016/00 UTC/IR


45 6 May 2016/06 UTC/airmass RGB 6 May 2016/12 UTC/air mass RGB 6 May 2016/18 UTC/air mass RGB 7 May 2016/00 UTC/air mass RGB


46 6 May 2016/06 UTC/IR 6 May 2016/12 UTC/IR Magenta: Height of PV >2 units 6 May 2016/18 UTC/IR 7 May 2016/00 UTC/IR
47 Enough for today!


48 Outlook:Other developments of occlusion spirals from mesoscale features Cold Air development Instant Occlusion We will come back to all this on 8 November: Comma clouds Mesoscale features in Cold Air


49 Detect elements of the 4-quandrant jet streak model in a real case: 7 May 2016/00 UTC 7 May 2016/ 00 UTC Yellow: Isentropes 300 hpa Which elements of the 4-quandrat jet streak model can you detect in the jet streak above; choose VCSs similar to the one indicated Make slides similar to numbers 15,16 in the presentation of Occlusion Cyclogenesis II


50 Detect and locate PV Anomalies in Vertical Cross Sections 6 May 2016/06 UTC/IR 6 May 2016/12 UTC/IR 6 May 2016/18 UTC/IR 6 May 2016/06 UTC/IR 6 May 2016/18 UTC/IR Make the process of sinking tropospheric air visible 6 May 2016/18 UTC/IR Compute the relevant VCS (use VCS line similar to the indicated ones) Indicate height of PV=2 units directly in the VCS frontal surface and determine how far downward tropospheric air has protruded Make a slide similar to 34 in this presentation.
51 Enough for today! Any Questions already now? The Students Forum is open for all questions coming up later! Thank you for your attention! Meet you in the Students Forum, in November and in Langen!
Occlusion Cyclogenesis
 Occlusion Cyclogenesis Part I: Occlusion cloud bands in comparison to CF and WFs Concepts for cyclogenesis Different types of cyclogenesis and examples Numerical parameters on isobaric and isentropic surfaces
1. COLD FRONT - CLOUD STRUCTURE IN SATELLITE IMAGES
 1. COLD FRONT - CLOUD STRUCTURE IN SATELLITE IMAGES The satellite image shows a cyclonically curved synoptic scale cloud band usually a few hundred kilometres wide; in the VIS image the cloud band mostly
Introduction to Conceptual Models
 Zentralanstalt für Meteorologie und Geodynamik Introduction to Conceptual Models Veronika Zwatz-Meise IR Satellite Images with Satrep From Cloud systems in satellite images to Conceptual Models If we look
Quasi-Geostrophic Implications
 Chapter 10 Quasi-Geostrophic Implications When you look at a weather chart with all its isolines and plotted data, you need a framework upon which to interpret what you see. Quasi-geostrophic theory provides
Mesoscale Atmospheric Systems. Surface fronts and frontogenesis. 06 March 2018 Heini Wernli. 06 March 2018 H. Wernli 1
 Mesoscale Atmospheric Systems Surface fronts and frontogenesis 06 March 2018 Heini Wernli 06 March 2018 H. Wernli 1 Temperature (degc) Frontal passage in Mainz on 26 March 2010 06 March 2018 H. Wernli
DANISH METEOROLOGICAL INSTITUTE
 DANISH METEOROLOGICAL INSTITUTE SCIENTIFIC REPORT 3-11 Quasigeostrophic interpretation of extratropical cyclogenesis Niels Woetmann Nielsen COPENHAGEN 23 ISSN Nr. 9-3263 (printed) ISSN Nr. 1399-1949 (online)
Final Examination, MEA 443 Fall 2008, Lackmann
 Place an X here to count it double! Name: Final Examination, MEA 443 Fall 2008, Lackmann If you wish to have the final exam count double and replace your midterm score, place an X in the box above. As
Isentropic Analysis. Much of this presentation is due to Jim Moore, SLU
 Isentropic Analysis Much of this presentation is due to Jim Moore, SLU Utility of Isentropic Analysis Diagnose and visualize vertical motion - through advection of pressure and system-relative flow Depict
Vertical structure. To conclude, we will review the critical factors invloved in the development of extratropical storms.
 Vertical structure Now we will examine the vertical structure of the intense baroclinic wave using three visualization tools: Upper level charts at selected pressure levels Vertical soundings for selected
A Cyclogenesis south of the Alps. Manfred Kurz Neustadt/Weinstraße
 A Cyclogenesis south of the Alps Manfred Kurz Neustadt/Weinstraße A cyclogenesis south of the Alps Surface maps 06-11-99, 00 UTC The occluded frontal system of a quasi-stationary low above the North Sea
Lec 10: Interpreting Weather Maps
 Lec 10: Interpreting Weather Maps Case Study: October 2011 Nor easter FIU MET 3502 Synoptic Hurricane Forecasts Genesis: on large scale weather maps or satellite images, look for tropical waves (Africa
Divergence, Spin, and Tilt. Convergence and Divergence. Midlatitude Cyclones. Large-Scale Setting
 Midlatitude Cyclones Equator-to-pole temperature gradient tilts pressure surfaces and produces westerly jets in midlatitudes Waves in the jet induce divergence and convergence aloft, leading to surface
Mid-Latitude Cyclones and Fronts. Lecture 12 AOS 101
 Mid-Latitude Cyclones and Fronts Lecture 12 AOS 101 Homework 4 COLDEST TEMPS GEOSTROPHIC BALANCE Homework 4 FASTEST WINDS L Consider an air parcel rising through the atmosphere The parcel expands as it
Synoptic Meteorology II: Self-Development in the IPV Framework. 5-7 May 2015
 Synoptic Meteorology II: Self-Development in the IPV Framework 5-7 May 2015 Readings: Section 5.3.6 of Midlatitude Synoptic Meteorology. Introduction In this and other recent lectures, we have developed
Synoptic-Dynamic Meteorology in Midlatitudes
 Synoptic-Dynamic Meteorology in Midlatitudes VOLUME II Observations and Theory of Weather Systems HOWARD B. BLUESTEIN New York Oxford OXFORD UNIVERSITY PRESS 1993 Contents 1. THE BEHAVIOR OF SYNOPTIC-SCALE,
Mesoscale analysis of a comma cloud observed during FASTEX
 Meteorol. Appl. 7, 129 134 (2000) Mesoscale analysis of a comma cloud observed during FASTEX K D Williams, Joint Centre for Mesoscale Meteorology, Department of Meteorology, University of Reading, PO Box
Rapid cyclogenesis over Poland on 28 March 1997
 Meteorol. Appl. 6, 363 370 (1999) Rapid cyclogenesis over Poland on 28 March 1997 Jan Waclaw Parfiniewicz, Institute of Meteorology and Water Management, ul. Podleœna 61, 01 673 Warszawa, Poland A small
A SEVERE WEATHER EVENT IN ROMANIA DUE TO MEDITERRANEAN CYCLONIC ACTIVITY
 A SEVERE WEATHER EVENT IN ROMANIA DUE TO MEDITERRANEAN CYCLONIC ACTIVITY Florinela Georgescu, Gabriela Bancila, Viorica Dima National Meteorological Administration, Bucharest, Romania Abstract Mediterranean
 http://www.ssec.wisc.edu/data/composites.html Red curve: Incoming solar radiation Blue curve: Outgoing infrared radiation. Three-cell model of general circulation Mid-latitudes: 30 to 60 latitude MID-LATITUDES
The water vapour channels of SEVIRI (Meteosat). An introduction
. An introduction") The water vapour channels of SEVIRI (Meteosat). An introduction jose.prieto@eumetsat.int Cachoeira P. July 2006 Formats 1.5 1 Objectives 2 Describe the characteristics of WV channels on board of SEVIRI
The water vapour channels of SEVIRI (Meteosat). An introduction jose.prieto@eumetsat.int Cachoeira P. July 2006 Formats 1.5 1 Objectives 2 Describe the characteristics of WV channels on board of SEVIRI
Multiscale Analyses of Inland Tropical Cyclone Midlatitude Jet Interactions: Camille (1969) and Danny (1997)
 and Danny (1997)") Multiscale Analyses of Inland Tropical Cyclone Midlatitude Jet Interactions: Camille (1969) and Danny (1997) Matthew Potter, Lance Bosart, and Daniel Keyser Department of Atmospheric and Environmental
Multiscale Analyses of Inland Tropical Cyclone Midlatitude Jet Interactions: Camille (1969) and Danny (1997) Matthew Potter, Lance Bosart, and Daniel Keyser Department of Atmospheric and Environmental
Satellites, Weather and Climate Module 9: Air/sea interactions winter cyclogenesis
 Satellites, Weather and Climate Module 9: Air/sea interactions winter cyclogenesis Winter storms things to consider Deep moisture Thermal discontinuity Favorable surface and upper level features Geographical
p = ρrt p = ρr d = T( q v ) dp dz = ρg
 dp dz = ρg") Chapter 1: Properties of the Atmosphere What are the major chemical components of the atmosphere? Atmospheric Layers and their major characteristics: Troposphere, Stratosphere Mesosphere, Thermosphere
Chapter 1: Properties of the Atmosphere What are the major chemical components of the atmosphere? Atmospheric Layers and their major characteristics: Troposphere, Stratosphere Mesosphere, Thermosphere
Phenomena of synoptic scale
 Chapter 5 Phenomena of synoptic scale 5.1 Analysis of fronts 5.1.1 Concept of fronts A front is defined as a boundary between air masses. At such a boundary, a vertical circulation is excited along the
CONVERGENCE, DIVERGENCE, AND VORTICITY
 CHAPTER 1 CONVERGENCE, DIVERGENCE, AND VORTICITY In your reading of the AG2 manual, volume 1, you became familiar with the terms convergence, divergence, and vorticity when used in relation to surface
4/29/2011. Mid-latitude cyclones form along a
 Chapter 10: Cyclones: East of the Rocky Mountain Extratropical Cyclones Environment prior to the development of the Cyclone Initial Development of the Extratropical Cyclone Early Weather Along the Fronts
A case of Rapid Cyclogenesis over Ionian Sea on February 6 th, 2012
 Author: Kyriaki Metheniti, HNMS Showcase Title: A case of Rapid Cyclogenesis Time frame: February 6 to February 7, 2012 Study region: Eastern Mediterranean, Ionian Sea A case of Rapid Cyclogenesis over
WATER VAPOUR IMAGERY ANALYSIS IN 7.3µ/6.2µ FOR DIAGNOSING THERMO-DYNAMIC CONTEXT OF INTENSE CONVECTION
 WATER VAPOUR IMAGERY ANALYSIS IN 7.3µ/6.2µ FOR DIAGNOSING THERMO-DYNAMIC CONTEXT OF INTENSE CONVECTION P. Santurette 1 and C.G. Georgiev 2 1 Météo-France, 42, Avenue G. Coriolis, 31057 Toulouse Cedex 01,
AN EXTRATROPICAL CYCLONE ATLAS
 AN EXTRATROPICAL CYCLONE ATLAS A tool for illustrating cyclone structure and evolution characteristics BY H. F. DACRE, M. K. HAWCROFT, M. A. STRINGER AND K. I. HODGES Authors Affiliations H.F.Dacre, Department
Summary of High Wind Event of 7 March 2004
 Summary of High Wind Event of 7 March 2004 This event was characterized by a very strong jet streak that developed over North Carolina by 00 UTC 8 March, as seen in the Eta model analysis at 300 mb, with
Isentropic Thinking & Airstreams Analysis
 Isentropic Thinking & Airstreams Analysis Drs. James T. Moore & Sam Ng Saint Louis University & Metropolitan State College of Denver Utility of Isentropic Analysis Diagnose and visualize vertical motion
Chapter 12 Fronts & Air Masses
 Chapter overview: Anticyclones or highs Air Masses o Classification o Source regions o Air masses of North America Fronts o Stationary fronts o Cold fronts o Warm fronts o Fronts and the jet stream o Frontogenesis
Boundary layer controls on extratropical cyclone development
 Boundary layer controls on extratropical cyclone development R. S. Plant (With thanks to: I. A. Boutle and S. E. Belcher) 28th May 2010 University of East Anglia Outline Introduction and background Baroclinic
THE SYNOPTIC ENVIRONMENT OF THE 11 APRIL 2001 CENTRAL PLAINS TORNADO OUTBREAK VIEWED IN THREE DIMENSIONS
 P1.1 THE SYNOPTIC ENVIRONMENT OF THE 11 APRIL 2001 CENTRAL PLAINS TORNADO OUTBREAK VIEWED IN THREE DIMENSIONS Daniel D. Nietfeld * NOAA/NWS/WFO Omaha/Valley, NE 1. INTRODUCTION A powerful low pressure
Diabatic processes and the structure of the warm conveyor belt
 2 nd European Windstorm Workshop Leeds, 3-4 September 2012 Diabatic processes and the structure of the warm conveyor belt Oscar Martínez-Alvarado J. Chagnon, S. Gray, R. Plant, J. Methven Department of
The Potential Role of a Stratospheric Intrusion in the March 7, 2004, High Wind Event
 The Potential Role of a Stratospheric Intrusion in the March 7, 2004, High Wind Event Dry downbursts are rather rare in North Carolina, so the high wind event of Sunday, March 7, 2004, merits particular
Convective Cloud Features in typical synoptic situations. Frans Debie
 Convective Cloud Features in typical synoptic situations Frans Debie me SATRAPPERS Henk vesa Frans Veronika ab Teachers classroom Langen Cumulonimbus: Convection Convection, seen from ground 1 2 3 4 Outflow
INTERPRETATION GUIDE TO MSG WATER VAPOUR CHANNELS
 INTERPRETATION GUIDE TO MSG WATER VAPOUR CHANNELS C.G. Georgiev1 and P. Santurette2 1 National Institute of Meteorology and Hydrology, Tsarigradsko chaussee 66, 1784 Sofia, Bulgaria 2 Météo-France, 42,
True or false: The atmosphere is always in hydrostatic balance. A. True B. False
 Clicker Questions and Clicker Quizzes Clicker Questions Chapter 7 Of the four forces that affect the motion of air in our atmosphere, which is to thank for opposing the vertical pressure gradient force
Dynamics of the Atmosphere. Large-scale flow with rotation and stratification
 12.810 Dynamics of the Atmosphere Large-scale flow with rotation and stratification Visualization of meandering jet stream Upper level winds from June 10th to July 8th 1988 from MERRA Red shows faster
Atmospheric dynamics and meteorology
 Atmospheric dynamics and meteorology B. Legras, http://www.lmd.ens.fr/legras III Frontogenesis (pre requisite: quasi-geostrophic equation, baroclinic instability in the Eady and Phillips models ) Recommended
Project 2 Fronts
 12.307 Project 2 Fronts Lodovica Illari and John Marshall March 2010 Abstract We inspect fronts crossing the country associated with day-to-day variations in the weather using real-time atmospheric observations.
Meteorology Lecture 15
 Meteorology Lecture 15 Robert Fovell rfovell@albany.edu 1 Important notes These slides show some figures and videos prepared by Robert G. Fovell (RGF) for his Meteorology course, published by The Great
Diabatic processes and the structure of extratropical cyclones
 Geophysical and Nonlinear Fluid Dynamics Seminar AOPP, Oxford, 23 October 2012 Diabatic processes and the structure of extratropical cyclones Oscar Martínez-Alvarado R. Plant, J. Chagnon, S. Gray, J. Methven
EasyChair Preprint. Sotirios Tsiougkos and Dimitrios Brikas. November 9, 2018
 EasyChair Preprint 616 Calculation of dynamic and thermodynamic parameters from spatial data of high spatial resolution of a weather event s specific case study event that occurred on the 16th and 17th
1. Rossby and Ertel 2. Conservation and invertibility - a useful combination 2.1 Action at a distance
 Met Office College - Course Notes Potential vorticity Contents 1. Rossby and Ertel 2. Conservation and invertibility - a useful combination 2.1 Action at a distance 3. Conceptual models of development
and 24 mm, hPa lapse rates between 3 and 4 K km 1, lifted index values
 3.2 Composite analysis 3.2.1 Pure gradient composites The composite initial NE report in the pure gradient northwest composite (N = 32) occurs where the mean sea level pressure (MSLP) gradient is strongest
Air Masses, Weather Systems and Hurricanes
 The Earth System - Atmosphere IV Air Masses, Weather Systems and Hurricanes Air mass a body of air which takes on physical characteristics which distinguish it from other air. Classified on the basis of
Microphysical heating rates and PV modification in a warm conveyor belt: Comparison of a COSMO and IFS simulation
 Microphysical heating rates and PV modification in a warm conveyor belt: Comparison of a COSMO and IFS simulation Montreal, August 18th 2014 H. Joos1, M. Böttcher1, R. Forbes2 and H. Wernli1 1) IAC, ETH
Isentropic Analysis. We can look at weather data in other ways besides on constantpressure. Meteorology 411 Iowa State University Week 11 Bill Gallus
 Isentropic Analysis We can look at weather data in other ways besides on constantpressure surfaces! Meteorology 411 Iowa State University Week 11 Bill Gallus A brief history of meteorology In the 1930s
Examination #3 Wednesday, 28 November 2001
 Name & Signature Dr. Droegemeier Student ID Meteorology 1004 Introduction to Meteorology Fall, 2001 Examination #3 Wednesday, 28 November 2001 BEFORE YOU BEGIN!! Please be sure to read each question CAREFULLY
Fixed Rossby Waves: Quasigeostrophic Explanations and Conservation of Potential Vorticity
 Fixed Rossby Waves: Quasigeostrophic Explanations and Conservation of Potential Vorticity 1. Observed Planetary Wave Patterns After upper air observations became routine, it became easy to produce contour
Climatology of dry air intrusions and their relation to strong surface winds in extratropical cyclones
 Climatology of dry air intrusions and their relation to strong surface winds in extratropical cyclones...and intro to synoptic and meso-scale cyclone dynamics Shira Raveh-Rubin and Heini Wernli Institute
Weather report 28 November 2017 Campinas/SP
 Weather report 28 November 2017 Campinas/SP Summary: 1) Synoptic analysis and pre-convective environment 2) Verification 1) Synoptic analysis and pre-convective environment: At 1200 UTC 28 November 2017
3. Midlatitude Storm Tracks and the North Atlantic Oscillation
 3. Midlatitude Storm Tracks and the North Atlantic Oscillation Copyright 2006 Emily Shuckburgh, University of Cambridge. Not to be quoted or reproduced without permission. EFS 3/1 Review of key results
On the effect of forward shear and reversed shear baroclinic flows for polar low developments. Thor Erik Nordeng Norwegian Meteorological Institute
 On the effect of forward shear and reversed shear baroclinic flows for polar low developments Thor Erik Nordeng Norwegian Meteorological Institute Outline Baroclinic growth a) Normal mode solution b) Initial
For the operational forecaster one important precondition for the diagnosis and prediction of
 Initiation of Deep Moist Convection at WV-Boundaries Vienna, Austria For the operational forecaster one important precondition for the diagnosis and prediction of convective activity is the availability
Diagnostic Study of a Severe Thunderstorm over Jeddah
 Atmospheric and Climate Sciences, 2013, 3, 150-164 http://dx.doi.org/10.4236/acs.2013.31017 Published Online January 2013 (http://www.scirp.org/journal/acs) Diagnostic Study of a Severe Thunderstorm over
AOSC201: Weather and Climate Lab
 AOSC201: Weather and Climate Lab Week 8: Forecasting - Analysis Section 107/108 Instructor: Agniv Sengupta q Lab #7 of Lab Manual (pages 41-49) q 50 points in total q INDIVIDUAL Work for the entire lab
10B.2 THE ROLE OF THE OCCLUSION PROCESS IN THE EXTRATROPICAL-TO-TROPICAL TRANSITION OF ATLANTIC HURRICANE KAREN
 10B.2 THE ROLE OF THE OCCLUSION PROCESS IN THE EXTRATROPICAL-TO-TROPICAL TRANSITION OF ATLANTIC HURRICANE KAREN Andrew L. Hulme* and Jonathan E. Martin University of Wisconsin-Madison, Madison, Wisconsin
Middle Latitude Cyclones a storm that forms at middle and high latitudes, outside of the tropics.
 Middle Latitude Cyclones a storm that forms at middle and high latitudes, outside of the tropics. Polar Front Theory a theory that explains the life cycle of mid latitude cyclones and their associated
Chapter 9: Weather Patterns
 Chapter 9: Weather Patterns Mid Latitude Cyclones: extratropical cyclones, Nor easters Region southern FL to Alaska Lifecycle and associated weather Regional Influence Polar Front Theory: -Norwegian Cyclone
Use of dynamical concepts in weather forecasting
 Use of dynamical concepts in weather forecasting Meteorol. Appl. 4, 345 352 (1997) E B Carroll, Meteorological Office, London Road, Bracknell, Berkshire RG12 2SZ, UK A divergence-based procedure for diagnosing
Quasi-Geostrophic ω-equation. 1. The atmosphere is approximately hydrostatic. 2. The atmosphere is approximately geostrophic.
 Quasi-Geostrophic ω-equation For large-scale flow in the atmosphere, we have learned about two very important characteristics:. The atmosphere is approximately hydrostatic.. The atmosphere is approximately
Tropical Cyclone Formation/Structure/Motion Studies
 Tropical Cyclone Formation/Structure/Motion Studies Patrick A. Harr Department of Meteorology Naval Postgraduate School Monterey, CA 93943-5114 phone: (831) 656-3787 fax: (831) 656-3061 email: paharr@nps.edu
Use of potential vorticity fields, Meteosat water vapour imagery and pseudo water vapour images for evaluating numerical model behaviour
 Meteorol. Appl. 8, 57 69 (2001) Use of potential vorticity fields, Meteosat water vapour imagery and pseudo water vapour images for evaluating numerical model behaviour Christo G Georgiev, National Institute
The dynamics of high and low pressure systems
 The dynamics of high and low pressure systems Newton s second law for a parcel of air in an inertial coordinate system (a coordinate system in which the coordinate axes do not change direction and are
Interaction of Potential Vorticity Anomalies in Extratropical Cyclogenesis. Part I: Static Piecewise Inversion
 2546 MONTHLY WEATHER REVIEW VOLUME 127 Interaction of Potential Vorticity Anomalies in Extratropical Cyclogenesis. Part I: Static Piecewise Inversion ZONGHUI HUO CMRP, School of Meteorology, University
Scale Interactions during the Formation of Typhoon Irving 边建谱 ELIZABETH A. RITCHIE GREG J. HOLLAND
 Scale Interactions during the Formation of Typhoon Irving 边建谱 ELIZABETH A. RITCHIE GREG J. HOLLAND Pre-research Fujiwhara: laboratory experiments in water (1921, 1923, 1931). Cloud clusters are a well-known
Upper-tropospheric downstream development leading to surface cyclogenesis in the central Mediterranean
 Meteorol. Appl. 6, 33 3 (999) Upper-tropospheric downstream development leading to surface cyclogenesis in the central Mediterranean Nicholas G Prezerakos, Helena A Flocas and Silas C Michaelides 3 General
- tornadoes. Further Reading: Chapter 08 of the text book. Outline. - cyclones and anti-cyclones. -tropical storms. -Storm surge
 (1 of 16) Further Reading: Chapter 08 of the text book Outline - cyclones and anti-cyclones - tornadoes -tropical storms -Storm surge (2 of 16) Introduction Previously, We talked about fronts and their
Baroclinic wave. Atmospheric Dynamics: lecture 14 18/12/15. Topics. Chapter 9: Baroclinic waves and cyclogenesis. What is a baroclinic wave?
 Atmospheric Dynamics: lecture 14 (http://www.staff.science.uu.nl/~delde102/) Topics Chapter 9: Baroclinic waves and cyclogenesis What is a baroclinic wave? Quasi-geostrophic equations Omega equation Original
THE EXTRATROPICAL TRANSITION OF TYPHOON WINNIE (1997): SELF-AMPLIFICATION AFTER LANDFALL
: SELF-AMPLIFICATION AFTER LANDFALL") THE EXTRATROPICAL TRANSITION OF TYPHOON WINNIE (1997): SELF-AMPLIFICATION AFTER LANDFALL Chih-Shin Liu *1,2 and George Tai-Jen Chen 2 1 Weather Forecast Center, Central Weather Bureau, 2 Department of
THE EXTRATROPICAL TRANSITION OF TYPHOON WINNIE (1997): SELF-AMPLIFICATION AFTER LANDFALL Chih-Shin Liu *1,2 and George Tai-Jen Chen 2 1 Weather Forecast Center, Central Weather Bureau, 2 Department of
Synoptic Meteorology II: Petterssen-Sutcliffe Development Theory Application March 2015
 Synoptic Meteorology II: Petterssen-Sutcliffe Development Theory Application 10-12 March 2015 In our lecture on Petterssen-Sutcliffe Development Theory, we outlined the principle of selfdevelopment in
Extratropical processes and forecast errors
 Extratropical processes and forecast errors Heini Wernli With contributions from: Andreas Dörnbrack, Sarah Jones, George Craig Maxi Böttcher, Hanna Joos, Andreas Schäfler, Matthias Zimmer, Florian Meier,
Chapter 8 cont. Clouds and Storms. Spring 2018
 Chapter 8 cont. Clouds and Storms Spring 2018 Clouds and Storms Clouds cover ~ 50% of earth at any time. Clouds are linked to a number of condensation processes. Cloud morphology, cloud types, associated
Chapter 8 cont. Clouds and Storms
 Chapter 8 cont. Clouds and Storms Spring 2007 Clouds and Storms Clouds cover ~ 50% of earth at any time. Clouds are linked to a number of condensation processes. Cloud morphology, cloud types, associated
1. INTRODUCTION: 2. DATA AND METHODOLOGY:
 27th Conference on Hurricanes and Tropical Meteorology, 24-28 April 2006, Monterey, CA 3A.4 SUPERTYPHOON DALE (1996): A REMARKABLE STORM FROM BIRTH THROUGH EXTRATROPICAL TRANSITION TO EXPLOSIVE REINTENSIFICATION
Department of Earth & Climate Sciences San Francisco State University
 Department of Earth & Climate Sciences San Francisco State University Name ERTH 260: Inclass Exercise #5 Working With Weather Maps and Soundings: Finding Pressure Features and Fronts Due Wednesday 28 February
MET 3502 Synoptic Meteorology. Lecture 8: September 16, AIRMASSES, FRONTS and FRONTAL ANALYSIS (2)
") MET 3502 Synoptic Meteorology Lecture 8: September 16, 2010 AIRMASSES, FRONTS and FRONTAL ANALYSIS (2) Identifying a cold front on a surface weather map: 1. Surface front is located at the leading edge
MET 3502 Synoptic Meteorology Lecture 8: September 16, 2010 AIRMASSES, FRONTS and FRONTAL ANALYSIS (2) Identifying a cold front on a surface weather map: 1. Surface front is located at the leading edge
Oakfield, WI Tornado of July 18 th, 1996: "Everything in its Right Place"
 Oakfield, WI Tornado of July 18 th, 1996: "Everything in its Right Place" Arian Sarsalari Department of Atmospheric and Oceanic Sciences, University of Wisconsin Madison ABSTRACT This paper will serve
Observation Homework Due 11/24. Previous Lecture. Midlatitude Cyclones
 Lecture 21 Midlatitude Cyclones Observation Homework Due 11/24 1 2 Midlatitude Cyclones Midlatitude Cyclone or Winter Storm Cyclogenesis Energy Source Life Cycle Air Streams Vertical Structure Storm Hazards
Cyclolysis: A Diagnosis of Two Extratropical Cyclones
 2714 MONTHLY WEATHER REVIEW VOLUME 129 Cyclolysis: A Diagnosis of Two Extratropical Cyclones WILLIAM E. MORRIS JR.* AND PHILLIP J. SMITH Department of Earth and Atmospheric Sciences, Purdue University
The Planetary Circulation System
 12 The Planetary Circulation System Learning Goals After studying this chapter, students should be able to: 1. describe and account for the global patterns of pressure, wind patterns and ocean currents
Examples of Pressure Gradient. Pressure Gradient Force. Chapter 7: Forces and Force Balances. Forces that Affect Atmospheric Motion 2/2/2015
 Chapter 7: Forces and Force Balances Forces that Affect Atmospheric Motion Fundamental force - Apparent force - Pressure gradient force Gravitational force Frictional force Centrifugal force Forces that
Transient and Eddy. Transient/Eddy Flux. Flux Components. Lecture 3: Weather/Disturbance. Transient: deviations from time mean Time Mean
 Lecture 3: Weather/Disturbance Transients and Eddies Climate Roles Mid-Latitude Cyclones Tropical Hurricanes Mid-Ocean Eddies Transient and Eddy Transient: deviations from time mean Time Mean Eddy: deviations
Revisiting the Structure and Characteristics of an Early Summer Monsoon Trough over South China in 1975
 194 SOLA, 2014, Vol. 10, 194 198, doi:10.2151/sola.2014-041 Revisiting the Structure and Characteristics of an Early Summer Monsoon Trough over South China in 1975 Feng Hsiao and Yi-Leng Chen University
Forcing, instability and equivalent potential vorticity in a Midwest USA convective snowstorm
 Meteorol. Appl. 10, 273 280 (2003) DOI:10.1017/S1350482703003074 Forcing, instability and equivalent potential vorticity in a Midwest USA convective snowstorm Department of Atmospheric Sciences, University
1.4 CONNECTIONS BETWEEN PV INTRUSIONS AND TROPICAL CONVECTION. Beatriz M. Funatsu* and Darryn Waugh The Johns Hopkins University, Baltimore, MD
 1.4 CONNECTIONS BETWEEN PV INTRUSIONS AND TROPICAL CONVECTION Beatriz M. Funatsu* and Darryn Waugh The Johns Hopkins University, Baltimore, MD 1. INTRODUCTION Stratospheric intrusions into the tropical
Mesoscale Convective Complexes (or Systems)
") Mesoscale Convective Complexes (or Systems) What is an MCC Mesoscale Convectiv Complexes (MCCs) are organized clusters of storms that have to meet some size and shape criteria: * -32C IR temp > 100,000
Mesoscale Convective Complexes (or Systems) What is an MCC Mesoscale Convectiv Complexes (MCCs) are organized clusters of storms that have to meet some size and shape criteria: * -32C IR temp > 100,000
Numerical Prediction of the Heavy Rainfall Vortex Over Eastern Asia Monsoon Region
 730 Journal of the Meteorological Society of Japan Vol. 62, No. 5 Numerical Prediction of the Heavy Rainfall Vortex Over Eastern Asia Monsoon Region By Shou-Jun Chen* and Lorenzo Dell'Osso European Centre
Lower-Tropospheric Height Tendencies Associated with the Shearwise and Transverse Components of Quasigeostrophic Vertical Motion
 JULY 2007 N O T E S A N D C O R R E S P O N D E N C E 2803 Lower-Tropospheric Height Tendencies Associated with the Shearwise and Transverse Components of Quasigeostrophic Vertical Motion JONATHAN E. MARTIN
Veretenenko S., Ogurtsov M.
 First VarSITI General Symposium Albena, Bulgaria 6-10 June 2016 Veretenenko S., Ogurtsov M. Ioffe Physical-Technical Institute Saint-Petersburg, Russia Correlation coefficient between globally averaged
ESCI 344 Tropical Meteorology Lesson 11 Tropical Cyclones: Formation, Maintenance, and Intensification
 ESCI 344 Tropical Meteorology Lesson 11 Tropical Cyclones: Formation, Maintenance, and Intensification References: A Global View of Tropical Cyclones, Elsberry (ed.) Global Perspectives on Tropical Cylones:
A polar low named Vera: the use of potential vorticity diagnostics to assess its development
 Quarterly Journal of the Royal Meteorological Society Q. J. R. Meteorol. Soc. 137: 179 183, October 11 A A polar low named Vera: the use of potential vorticity diagnostics to assess its development Thor
General Circulation. Nili Harnik DEES, Lamont-Doherty Earth Observatory
 General Circulation Nili Harnik DEES, Lamont-Doherty Earth Observatory nili@ldeo.columbia.edu Latitudinal Radiation Imbalance The annual mean, averaged around latitude circles, of the balance between the
Simulations of the Extratropical Transition of Tropical Cyclones: Contributions by the Midlatitude Upper-Level Trough to Reintensification
 2112 MONTHLY WEATHER REVIEW Simulations of the Extratropical Transition of Tropical Cyclones: Contributions by the Midlatitude Upper-Level Trough to Reintensification ELIZABETH A. RITCHIE Department of
Fall 2015 Laboratory 7 Quasigeostrophic Forcing Functions 300 points. You are provided with the following for 12 UTC 12/4/12 (a) WRF-NAM
 WRF-NAM") ERTH 465 Fall 2015 Laboratory 7 NAME Quasigeostrophic Forcing Functions 300 points. You are provided with the following for 12 UTC 12/4/12 (a) WRF-NAM initialization of SLP and 1000-500 mb thickness; (b)
ERTH 465 Fall 2015 Laboratory 7 NAME Quasigeostrophic Forcing Functions 300 points. You are provided with the following for 12 UTC 12/4/12 (a) WRF-NAM initialization of SLP and 1000-500 mb thickness; (b)
Satellites, Weather and Climate Module??: Polar Vortex
 Satellites, Weather and Climate Module??: Polar Vortex SWAC Jan 2014 AKA Circumpolar Vortex Science or Hype? Will there be one this year? Today s objectives Pre and Post exams What is the Polar Vortex
2. What are the four most common gasses in the atmosphere and their percentages?
 Meteorology Review Directions: Answer the following open ended review questions. Utilize a diagram where appropriate and do make sure that you label and describe the drawing. Atmospheric Composition 1.