A Cyclogenesis south of the Alps. Manfred Kurz Neustadt/Weinstraße
|
|
|
- Karen Edwards
- 6 years ago
- Views:
Transcription
1 A Cyclogenesis south of the Alps Manfred Kurz Neustadt/Weinstraße
2 A cyclogenesis south of the Alps Surface maps
3 , 00 UTC The occluded frontal system of a quasi-stationary low above the North Sea extends from the German Bight above western Germany and the mid of France towards the Biscay. It is embedded in a frontal trough of the pressure field and accompanied by continuous cloud and some rain. Behind the front a broad trough with showers follows. Northern Italy is covered by a warm and moist air mass with a very weak pressure gradient.
4 06 UTC The front has crossed the mid of Germany and the Massif Centrale in France. A deformation of the front ahead of the western Alps becomes visible. The weather activity of the front west and north of the Alps has significantly increased with partly heavy rain mainly at the cold side of the surface front. This points to a frontogenetic effect working at this part of the front. Above northern Italy the pressure has continuously lowered and a flat low centre can be analyzed above the western part. It is important to note that it has a position well ahead of the approaching front.
5 09 UTC
6 12 UTC The cold air behind the front pushed forward north of the Alps and between Alps and Pyrenees towards the Gulf of Lion whereas its movement across the Alps was strongly hindered. Therefore the deformation of the front increased. The low ahead of the front above northern Italy has further deepened and moved a little bit south-westwards. There is widespread precipitation now also ahead of the front in the Alps and north of the Po-valley. Even some thunderstorms were observed. Contrary to that, the forward march of the cold air towards the western Mediterranean is accompanied by a quick disappearance of the cloud.
7 15 UTC
8 18 UTC The low south of the Alps deepened more and more whereby its centre of gravity moved towards the Gulf of Genova. The cold front pushed from west into the centre of the low and crossed Corse. Ahead of the front a line of thunderstorms formed. North and north-east of the low the movement of the low across the Alps was slow as before. According to synoptic convention, the front was there analyzed as a warm front, but it moved in reality as a cold front although with a small speed.
9 The weather south of the Alps Locarno NNW1 WSW1 WNW3 ESE2 ENE1 ESE2 SE 1 SW1 drizzle drizzle shower rain /11 12/11 12/11 8/5 9/5 13/-2 12/-1 9/1 Torino C NE1 WSW1 NW2 S1 SW2 C W2 mist mist rain /8 11/9 10/7 10/8 8/6 8/5 7/5 6/-9 Milano NE1 ENE1 ENE2 ESE1 NW4 NW1 C C mist mist rain rain rain rain rain -- 11/11 12/11 13/11 12/11 9/8 9/8 10/9 10/8 Verona NE1 E1 ENE3 ENE2 ENE4 NNE2 NNW3 ESE1 mist mist p.rain rain p.rain rain rain rain 10/8 11/9 13/11 13/12 13/12 10/9 11/7 10/9
10 A cyclogenesis south of the Alps Upper air charts


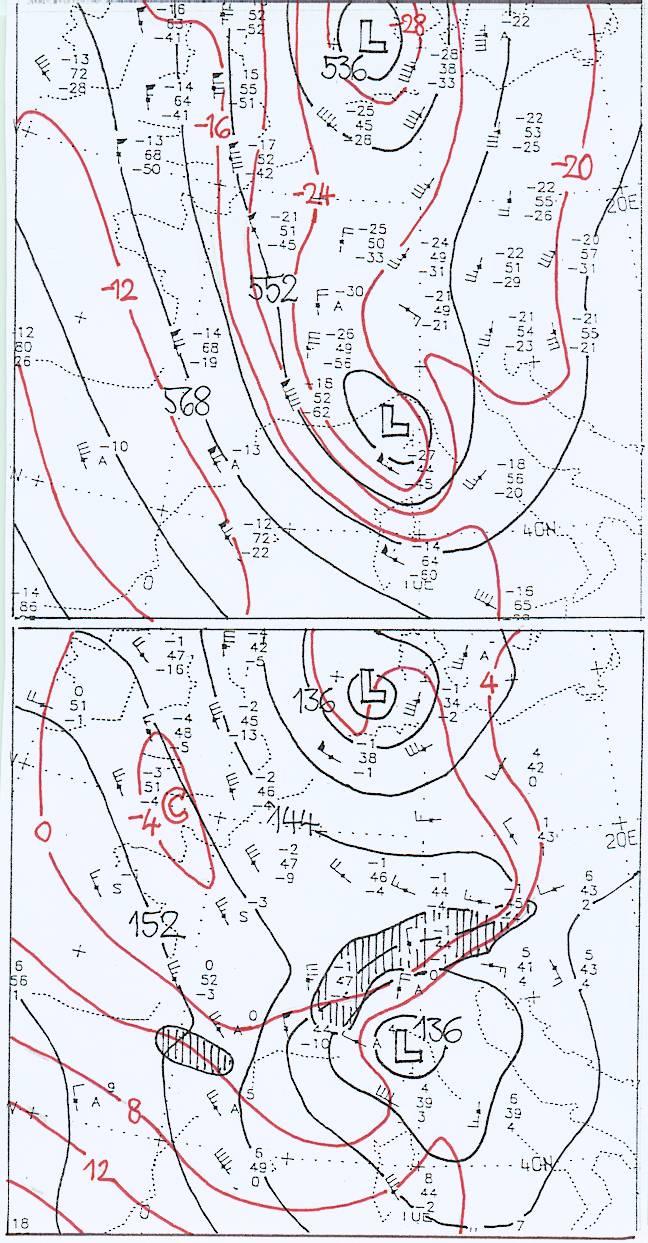
11 500 hpa 850 hpa 06 UTC 12 UTC 18 UTC
12 850 hpa The changes of the temperature distribution at 850 hpa between 06 and 18 UTC clearly reflect the impact of the Alps on frontal zones in the lower troposphere. Due to the barrier effect the cold air is forced to deviate and to push forward along the northern Alps (06-12 UTC) and between Alps and Pyrenees towards the western Mediterranean (12-18 UTC). The cold air, however, also crossed the Alps, but with distinctly smaller speed. Altogether, a S-like deformation of the isotherms resulted at both flanks of the mountain chain. In addition, a strong frontogenesis was effective at the front north of and across the Alps, whereas a frontolysis took place between Alps and Pyrenees. The isohypses at 850 hpa show the development of the low in the warm air above the westernmost part of northern Italy. It is important to note that there was no foehn effect during the origin of this low, but southerly winds against the mountain barrier at this level. The winds shifted to northerly direction only with the advent of the cold front at the southern flanks of the Alps and the displacement of the low southeastwards.
13 500 hpa The analyses for 500 hpa show the extension of the upper trough to the south and finally the cut-off of an upper low south of the Alps just above the surface low. The formation of the surface low took place immediately ahead of the deepening upper trough. At the beginning the frontal zone ahead of the trough has at 500 hpa a position slightly behind the frontal zone in the lower troposphere. But 6 hours later there is a great distance between both since the upper frontal zone did not follow the fast movement of the lower one along the northern Alps towards the east. Afterwards the cold air pushes forward to the south at both levels west of the Alps and mainly by advection at 850 hpa, but crossing the western Alps and mainly due to cooling by ascending motion at 500 hpa. A significant feature of the 500 hpa-temperature distribution is the existence of a well developed frontal zone immediately behind the trough with partly very great temperature gradient and very strong winds at its warm flank.
14 A cyclogenesis south of the Alps Diagnostic maps
15 Conventional QG-diagnosis Following the conventional quasi-geostrophic diagnosis, the analyses of vorticity advection at 500 hpa and thickness advection between 500 and 1000 hpa should be considered first. According to the omega-equation, a forcing of ascent in the mid troposphere and connected with that a cyclogenetic effect in the lower troposphere has to be expected in areas with PVA (positive vorticity advection) aloft and/or maximized WA (warm advection). Contrary to that, a forcing of descent and an anticyclogenetic effect in the lower troposphere results in areas with NVA (negative vorticity advection) aloft and/or maximized CA (cold advection).

16 , 00 UTC: At the beginning there is significant PVA aloft ahead of the upper low and trough with two maxima above the Netherlands and mid France, respectively. This points to a movement of the trough to the east and a simultaneous extension southeastwards. The cyclogenetic effect of the upper PVA for the lower levels, however, is to a great extent compensated by the CA being effective behind the surface cold front. Only above southern France the PVA works already ahead of the CA so that together with some WA a forcing of ascent can be expected there. This would explain the increasing precipitation along the front observed in this region in the hours after midnight. Top: Vorticity advection at 500 hpa; bottom: Thickness advection 500/1000 hpa

17 , 12 UTC: The compensation between PVA aloft and lower CA is still effective above Germany. Further south a new maximum of CA appears between Alps and Pyrenees where the cold air pushes accelerated forward to the western Mediterranean. The southern part of the PVAarea ahead of the trough has meanwhile crossed the western Alps and has now a position above the western part of northern Italy and the Gulf of Genova. There its cyclogenetic effect could not be compensated by CA and therefore led to the formation and deepening of the surface low. The lower CA, on the other hand, is effective directly below the upper trough and should give rise to an intensification of the cyclonic vorticity of the trough.

18 , 00 UTC: Since meanwhile a closed low has also formed at 500 hpa lying directly above the surface low at midnight, the upper PVA works now southeast of it and contributes to the displacement in this direction. There is, however, again a compensation with CA in the lower troposphere behind the surface cold front. Both forcing functions have the same sign northeast of the low so that the ascending motion should be maximized there. The orographically fixed CA between Alps and Pyrenees Is still effective.
19 Q-vector diagnostics Using the Q-vector as diagnostic tool, the forcing of vertical motions and the related cyclogenetic effects can be easily and unambiguously computed. A forcing of ascent results in areas with convergence, a forcing of decent in areas with divergence of the Q- vectors (FQ). In addition to that, the Q-vector allows a direct estimation of frontogenetic of frontolytic effects in the geostrophic wind field shown by the parameter (-Qn) and of the forcing (FQn) of circulations across the frontal zones subjected to these effects. Frontogenesis is connected with a direct circulation with ascent of the warmer and descent of the colder air, frontolysis with an indirect circulation with opposite vertical motions. The remaining part of the forcing (FQs) is related to the temperature changes caused by the rotatory component of the winds and is to a great extent identical with the so-called Sutcliffe-forcing given by the vorticity advection with the thermal wind. Ascent (descent) is forced by positive (negative) advection along the isotherms. The Q-vector diagnostics was performed for 700 hpa.


20 , 00 UTC FQ (-Qn) FQs FQn
21 , 00 UTC The diagnosis shows a forcing of ascent along the frontal zone of the cold front above southern France and western Germany followed by descent in the colder air. In the context of the classical QG-reasoning given before, the ascent is obviously mainly forced there where the upper PVA works ahead of the CA and is supported by some WA. On the other hand, the diagnosed forcing can also be partly traced back to the distinct frontogenetic and frontolytic effects being effective in the geostrophic wind field and giving rise to circulatory vertical motions either in solenoidally direct or indirect sense. The rotatory part of the forcing provides an additional contribution to ascent above the Rhone valley where the vorticity decreases along the isotherms and positive advection is effective by the thermal wind.


22 , 12 UTC FQ (-Qn) FQs FQn
23 , 12 UTC The dominant features of the forcing are the ascent above the western part of northern Italy and the Gulf of Genova and the descent centred above the Gulf of Lion. They are well correlated with the upper PVA and the lower CA, respectively, working in these areas as described above. The forcing of ascent and descent side-by-side above mid Europe, however, cannot be satisfyingly explained by the qualitative reasoning with vorticity and temperature advection. It can be easily understood when considering the frontogenesis parameter. Since the frontal zone is still subjected to frontogenesis, a direct circulation is released the vertical motions of which dominate the total forcing. Due to the orographic effects the frontogenesis is especially strong above the Alps so that the ascent of the warmer air within the circulation contributes by roughly one half to the ascending motion being effective above northern Italy and leading to the formation of the surface low there. The other half is provided by FQs due to positive vorticity advection by the thermal wind ahead of the trough and the already existing low at 700 hpa. The descent above the Gulf of Lion is mainly forced by FQs due to negative vorticity advection along the isotherms which is identical with CA by the real winds in this case.


24 , 00 UTC FQ (-Qn) FQs FQn
25 , 00 UTC Around the low above the Mediterranean there is ascent north and northeast of the low centre where PVA and WA are effective, descent due to dominating CA south of it and strong descent above the southernmost part of France also well correlated with the origraphically forced CA there. The frontogenesis parameter indicates strong frontogenesis above Alps and Pyrenees and frontolysis in between so that the vertical motions of two direct and one indirect circulations significantly contribute to the total vertical motion regime. The contributions by FQs have the same strength with concentrated descent above southern France and a wide area with ascent above the Alps, northern Italy and the area near the low centre. The sharp transition from descent to ascent in easterly direction across the Rhone valley can be understood when taking into account that the vorticity distribution at 700hPa shows relative high cyclonic values just between Alps and Pyrenees (see below).
26 A cyclogenesis south of the Alps Further diagnostic parameters


27 Omega 700 hpa Div 950 hpa , , , 00
28 Model omega and lower divergence The main features of the quasi-geostrophic forcing correspond relatively well with the model omega and the divergence computed from the model winds. The analyses of 700 hpa-omega and 950hPa-divergence show at first the belt with ascent and lower convergence along the frontal zone, then the dipole of ascent above the Alps and northern Italy and descent between Alps and Pyrenees connected with convergence and divergence, respectively. At the end there is agreement with regard to strong ascent and convergence northeast of the surface low and descent with divergence south of it as well as above southern France. The area of ascent, however, has a somewhat more southerly position than in the diagnoses and the extension towards northwest is missing. These differences might be due to the direct impact of the orography on the model fields which is, of course, not included in the quasigeostrophic diagnosis.

29 , , , hpa-divergence
30 Upper divergence The distribution of the divergence at 300 hpa partly corresponds to the vertical motions at 700 hpa and the related divergence at lower levels, but also show some deviating features. At the beginning the area with upper divergence ahead of the trough is much larger than the area with lower convergence. Above northern Spain an area with upper convergence is indicated nearly directly above the belt with lower convergence. Since it is not possible that convergence works at all tropospheric levels, there must be a more complex vertical distribution of convergence and divergence in this area than the simple scheme with one change of the sign of divergence in the vertical only. This scheme is realized, however, during the cyclogenesis south of the Alps ahead of the approaching upper trough. Upper divergence, ascending motion and lower convergence are well correlated. In spite of that there is at first no direct response at 300 hpa to the lower descent and divergence in the area with CA between Alps and Pyrenees. Altogether there is a good correlation between divergence and PVA and convergence and NVA at 300 hpa.

31 300 hpa 500 hpa , , , 00
32 Vorticity at 300 and 500 hpa The vorticity analyses for 300 and 500 hpa reflect an interesting structure at the beginning. There is no one single vorticity maximum in the upper trough coinciding with the centre of the upper low, but two one east of the low centre above the North Sea, the other one west of it at the cyclonic flank of the strong northwesterly jet at the rear of the trough. The easterly maximum moves slowly east or north-eastwards whereby it takes on a position inside the low centre. The westerly extremum is quickly displaced south-eastwards with a speed of roughly 50 kn. In doing so the maximum at 500 hpa moves al little bit faster and reaches a position south of the 300 hpamaximum at noon. That is surely due to the convergence working now above the area with descent between Alps and Pyrenees. It also leads to an increase of the vorticity of the trough. Afterwards the vorticity extremes are further displaced in southerly direction, but with lesser speed, and reach a position above the surface low at midnight.

33 700 hpa 850 hpa , , , 00
34 Vorticity at 700 and 850 hpa (I) At 700 and 850 hpa the vorticity distribution shows at the beginning the vorticity maximum in the low above the North Sea and a cyclonically bent belt of cyclonic vorticity along the frontal zone above Low Countries, mid France and Biscay. Around the Alps the distribution reflects the impact of the orography with westerly winds: Due to shear there is an area with anticyclonic vorticity west and north of the Alps and an area with cyclonic vorticity south-east and east of it. 12 hours later the analyses show the newly developed maximum of the low south of the western Alps. It becomes significantly larger and more intense during its movement south-eastwards due to the convergence working in this area. A belt of cyclonic vorticity extends from the centre towards the western Alps accompanied by a belt of anticyclonic vorticity west of it which is especially pronounced at 850 hpa. This structure is due to the shear at the flanks of the strong northwesterly winds between Alps and Pyrenees and reflects the primary vorticity banner which are regularly observed at the flanks of mountain chains.
35 Vorticity at 700 and 850 hpa (II) At 850 hpa the analysis show further bands of cyclonic and anticyclonic shear vorticity, respectively, over Spain. Connected with the forwards march of the cold air north of the Alps the vorticity minimum is also displaced eastwards whereas the easterly maximum is intensified by convergence before it moves away north-eastwards.
36 Conclusions (I) The described case is a typical example for a cyclogenesis south of the Alps without a direct cyclogenetic effect of the mountains. There was no northerly flow across the Alps in the lower troposphere which could have led to the formation of a lee trough as starting point for the cyclonic development. The impact of the Alps on the development was rather due to the slow down of the movement of the cold front across the mountains so that the PVA ahead of the approaching upper trough was not compensated by any CA south of the Alps and could initiate the formation of the low. The concentrated CA between Alps and Pyrenees, on the other hand, influenced movement and intensity of the upper trough.
37 Conclusions (II) The cyclogenesis took place in the warm and moist air lying above northern Italy. It was accompanied by increasing cloudiness followed by rain. Later on also thunderstorms were observed. In the afternoon and evening the cold front crossed northern Italy from west and north causing a drop of temperature and a shift to northerly winds. This wind shift, however, did not cause any weather improvement for the middle and eastern parts of the area since the strong ascent due to upper PVA and WA northeast of the low maintained for a while so that the rain also continued there. Only in the western parts of Italy and in Ticino the precipitation stopped and the sky became partly clear due to the macro-scale descent by NVA and CA. The relatively high temperatures combined with low dew-points observed at some stations point to the fact that also foehn was effective in this region.
4/29/2011. Mid-latitude cyclones form along a
 Chapter 10: Cyclones: East of the Rocky Mountain Extratropical Cyclones Environment prior to the development of the Cyclone Initial Development of the Extratropical Cyclone Early Weather Along the Fronts
Chapter 12 Fronts & Air Masses
 Chapter overview: Anticyclones or highs Air Masses o Classification o Source regions o Air masses of North America Fronts o Stationary fronts o Cold fronts o Warm fronts o Fronts and the jet stream o Frontogenesis
1. COLD FRONT - CLOUD STRUCTURE IN SATELLITE IMAGES
 1. COLD FRONT - CLOUD STRUCTURE IN SATELLITE IMAGES The satellite image shows a cyclonically curved synoptic scale cloud band usually a few hundred kilometres wide; in the VIS image the cloud band mostly
Fronts in November 1998 Storm
 Fronts in November 1998 Storm Much of the significant weather observed in association with extratropical storms tends to be concentrated within narrow bands called frontal zones. Fronts in November 1998
Mid-Latitude Cyclones and Fronts. Lecture 12 AOS 101
 Mid-Latitude Cyclones and Fronts Lecture 12 AOS 101 Homework 4 COLDEST TEMPS GEOSTROPHIC BALANCE Homework 4 FASTEST WINDS L Consider an air parcel rising through the atmosphere The parcel expands as it
Synoptic Meteorology II: Petterssen-Sutcliffe Development Theory Application March 2015
 Synoptic Meteorology II: Petterssen-Sutcliffe Development Theory Application 10-12 March 2015 In our lecture on Petterssen-Sutcliffe Development Theory, we outlined the principle of selfdevelopment in
AIR MASSES. Large bodies of air. SOURCE REGIONS areas where air masses originate
 Large bodies of air AIR MASSES SOURCE REGIONS areas where air masses originate Uniform in composition Light surface winds Dominated by high surface pressure The longer the air mass remains over a region,
Quasi-Geostrophic Implications
 Chapter 10 Quasi-Geostrophic Implications When you look at a weather chart with all its isolines and plotted data, you need a framework upon which to interpret what you see. Quasi-geostrophic theory provides
MET 3502 Synoptic Meteorology. Lecture 8: September 16, AIRMASSES, FRONTS and FRONTAL ANALYSIS (2)
") MET 3502 Synoptic Meteorology Lecture 8: September 16, 2010 AIRMASSES, FRONTS and FRONTAL ANALYSIS (2) Identifying a cold front on a surface weather map: 1. Surface front is located at the leading edge
MET 3502 Synoptic Meteorology Lecture 8: September 16, 2010 AIRMASSES, FRONTS and FRONTAL ANALYSIS (2) Identifying a cold front on a surface weather map: 1. Surface front is located at the leading edge
Chapter 9: Weather Patterns
 Chapter 9: Weather Patterns Mid Latitude Cyclones: extratropical cyclones, Nor easters Region southern FL to Alaska Lifecycle and associated weather Regional Influence Polar Front Theory: -Norwegian Cyclone
Observation Homework Due 11/24. Previous Lecture. Midlatitude Cyclones
 Lecture 21 Midlatitude Cyclones Observation Homework Due 11/24 1 2 Midlatitude Cyclones Midlatitude Cyclone or Winter Storm Cyclogenesis Energy Source Life Cycle Air Streams Vertical Structure Storm Hazards
Synoptic Meteorology II: Self-Development in the IPV Framework. 5-7 May 2015
 Synoptic Meteorology II: Self-Development in the IPV Framework 5-7 May 2015 Readings: Section 5.3.6 of Midlatitude Synoptic Meteorology. Introduction In this and other recent lectures, we have developed
Occlusion cyclogenesis II
 Occlusion cyclogenesis II Upper level influences on cyclogenesis Vorticity Advection (CVA) and the 4-quadrant jet streak model (Uccellini) Potential Vorticity (PV) (Hoskins Theory) Rapid cyclogenesis 14
Lecture 14. Extratropical Cyclones extratropical cyclone
 Lecture 14. Extratropical Cyclones In mid-latitudes, much of our weather is associated with a particular kind of storm, the extratropical cyclone Cyclone: circulation around low pressure center Some midwesterners
Fronts. Direction of Front
 Fronts Direction of Front Direction of Front Warm Front A cold air mass meets and displaces a warm air mass. Because the moving cold air is more dense, it moves under the less-dense warm air, pushing it
True or false: The atmosphere is always in hydrostatic balance. A. True B. False
 Clicker Questions and Clicker Quizzes Clicker Questions Chapter 7 Of the four forces that affect the motion of air in our atmosphere, which is to thank for opposing the vertical pressure gradient force
Summary of High Wind Event of 7 March 2004
 Summary of High Wind Event of 7 March 2004 This event was characterized by a very strong jet streak that developed over North Carolina by 00 UTC 8 March, as seen in the Eta model analysis at 300 mb, with
Divergence, Spin, and Tilt. Convergence and Divergence. Midlatitude Cyclones. Large-Scale Setting
 Midlatitude Cyclones Equator-to-pole temperature gradient tilts pressure surfaces and produces westerly jets in midlatitudes Waves in the jet induce divergence and convergence aloft, leading to surface
Lower-Tropospheric Height Tendencies Associated with the Shearwise and Transverse Components of Quasigeostrophic Vertical Motion
 JULY 2007 N O T E S A N D C O R R E S P O N D E N C E 2803 Lower-Tropospheric Height Tendencies Associated with the Shearwise and Transverse Components of Quasigeostrophic Vertical Motion JONATHAN E. MARTIN
Chapter 9. Weather Patterns & Midlatitude Cyclones
 Chapter 9 Weather Patterns & Midlatitude Cyclones Frontal Weather Fronts are boundary surfaces between different air masses. Warm front Cold front Stationary front Occluded front Drylines Frontal Weather
Synoptic-Dynamic Meteorology in Midlatitudes
 Synoptic-Dynamic Meteorology in Midlatitudes VOLUME II Observations and Theory of Weather Systems HOWARD B. BLUESTEIN New York Oxford OXFORD UNIVERSITY PRESS 1993 Contents 1. THE BEHAVIOR OF SYNOPTIC-SCALE,
 http://www.ssec.wisc.edu/data/composites.html Red curve: Incoming solar radiation Blue curve: Outgoing infrared radiation. Three-cell model of general circulation Mid-latitudes: 30 to 60 latitude MID-LATITUDES
METEOROLOGY. 1 The average height of the tropopause at 50 N is about A 14 km B 16 km C 11 km D 8 km
 1 The average height of the tropopause at 50 N is about A 14 km B 16 km C 11 km D 8 km 2 In the lower part of the stratosphere the temperature A is almost constant B decreases with altitude C increases
Air Masses of North America cp and ca air masses Air mass characterized by very cold and dry conditions
 Chapter 8: Air Masses, Fronts, and Middle-Latitude Cyclones Air masses Fronts Middle-latitude cyclones Air Masses Air mass an extremely large body of air whose properties of temperature and humidity are
Anthony A. Rockwood Robert A. Maddox
 Anthony A. Rockwood Robert A. Maddox An unusually intense MCS produced large hail and wind damage in northeast Kansas and northern Missouri during the predawn hours of June 7 th, 1982. Takes a look at
Use of dynamical concepts in weather forecasting
 Use of dynamical concepts in weather forecasting Meteorol. Appl. 4, 345 352 (1997) E B Carroll, Meteorological Office, London Road, Bracknell, Berkshire RG12 2SZ, UK A divergence-based procedure for diagnosing
Mesoscale Atmospheric Systems. Surface fronts and frontogenesis. 06 March 2018 Heini Wernli. 06 March 2018 H. Wernli 1
 Mesoscale Atmospheric Systems Surface fronts and frontogenesis 06 March 2018 Heini Wernli 06 March 2018 H. Wernli 1 Temperature (degc) Frontal passage in Mainz on 26 March 2010 06 March 2018 H. Wernli
Summary of November Central U.S. Winter Storm By Christopher Hedge
 Summary of November 12-13 2010 Central U.S. Winter Storm By Christopher Hedge Event Overview The first significant snowfall of the 2010-2011 season affected portions of the plains and upper Mississippi
Air Masses and Fronts II
 Air Masses and Fronts II Brief review An air mass is a large body of air whose properties of temperature and humidity are fairly similar in any horizontal direction Source regions for air masses tend to
Multiscale Analyses of Inland Tropical Cyclone Midlatitude Jet Interactions: Camille (1969) and Danny (1997)
 and Danny (1997)") Multiscale Analyses of Inland Tropical Cyclone Midlatitude Jet Interactions: Camille (1969) and Danny (1997) Matthew Potter, Lance Bosart, and Daniel Keyser Department of Atmospheric and Environmental
Multiscale Analyses of Inland Tropical Cyclone Midlatitude Jet Interactions: Camille (1969) and Danny (1997) Matthew Potter, Lance Bosart, and Daniel Keyser Department of Atmospheric and Environmental
Chapter 1 Anatomy of a Cyclone
 Chapter 1 Anatomy of a Cyclone The Beast in the East 15-17 February 2003 Extra-tropical cyclone an area of low pressure outside of the tropics Other names for extra-tropical cyclones: Cyclone Mid-latitude
** warm air mass
 Frontal cyclones -otherwise known as mid-latitude or wave cyclones. A cyclone is a cyclonically rotating system which, in mid- and high-latitudes is normally associated with the boundary between air masses
Refer to Figure 1 and what you have learned so far in this course when responding to the following:
 Refer to Figure 1 and what you have learned so far in this course when responding to the following: 1.Looking down on a Northern Hemisphere extratropical cyclone, surface winds blow [(clockwise and outward)(counterclockwise
Meteorology Lecture 15
 Meteorology Lecture 15 Robert Fovell rfovell@albany.edu 1 Important notes These slides show some figures and videos prepared by Robert G. Fovell (RGF) for his Meteorology course, published by The Great
YOU MUST USE WHAT YOU KNOW ABOUT THE MOVEMENT OF AIR MASSES DUE TO THE CORIOLIS EFFECT TO FORECAST!
 For this project you will apply past and present data to predict and future weather patterns and events and justify the predictions in terms of energy transfer between various systems. You will use this
A SEVERE WEATHER EVENT IN ROMANIA DUE TO MEDITERRANEAN CYCLONIC ACTIVITY
 A SEVERE WEATHER EVENT IN ROMANIA DUE TO MEDITERRANEAN CYCLONIC ACTIVITY Florinela Georgescu, Gabriela Bancila, Viorica Dima National Meteorological Administration, Bucharest, Romania Abstract Mediterranean
Middle Latitude Cyclones a storm that forms at middle and high latitudes, outside of the tropics.
 Middle Latitude Cyclones a storm that forms at middle and high latitudes, outside of the tropics. Polar Front Theory a theory that explains the life cycle of mid latitude cyclones and their associated
Meteorology 311. General Circulation/Fronts Fall 2017
 Meteorology 311 General Circulation/Fronts Fall 2017 Precipitation Types Rain Snow growth of ice crystals through deposition, accretion, and aggregation. Freezing Rain Rain freezes when it hits the surface.
Vertical structure. To conclude, we will review the critical factors invloved in the development of extratropical storms.
 Vertical structure Now we will examine the vertical structure of the intense baroclinic wave using three visualization tools: Upper level charts at selected pressure levels Vertical soundings for selected
Name SOLUTIONS T.A./Section Atmospheric Science 101 Homework #6 Due Thursday, May 30 th (in class)
") Name SOLUTIONS T.A./Section Atmospheric Science 101 Homework #6 Due Thursday, May 30 th (in class) 1. General Circulation Briefly describe where each of the following features is found in the earth s general
Name SOLUTIONS T.A./Section Atmospheric Science 101 Homework #6 Due Thursday, May 30 th (in class) 1. General Circulation Briefly describe where each of the following features is found in the earth s general
1. Which weather map symbol is associated with extremely low air pressure? A) B) C) D) 2. The diagram below represents a weather instrument.
 B) C) D) 2. The diagram below represents a weather instrument.") 1. Which weather map symbol is associated with extremely low air pressure? 2. The diagram below represents a weather instrument. Which weather variable was this instrument designed to measure? A) air pressure
1. Which weather map symbol is associated with extremely low air pressure? 2. The diagram below represents a weather instrument. Which weather variable was this instrument designed to measure? A) air pressure
Forecasting Weather: Air Masses and Fronts
 Forecasting Weather: Air Masses and Fronts Weather is a combination of local conditions at any one time. It's what's happening outside right now, right here. Weather includes: Temperature Humidity Air
Weather Related Factors of the Adelaide floods ; 7 th to 8 th November 2005
 Weather Related Factors of the Adelaide floods ; th to th November 2005 Extended Abstract Andrew Watson Regional Director Bureau of Meteorology, South Australian Region 1. Antecedent Weather 1.1 Rainfall
Synoptic Meteorology
 M.Sc. in Meteorology Synoptic Meteorology [MAPH P312] Prof Peter Lynch Second Semester, 2004 2005 Seminar Room Dept. of Maths. Physics, UCD, Belfield. Part 9 Extratropical Weather Systems These lectures
Science 1206 SAMPLE Test ( Weather Dynamics)
") Science 1206 SAMPLE Test ( Weather Dynamics) Name:. Part A: Multiple Choice (60%) Shade the letter of the best answer on the Scantron sheet provided. 1. Which term refers to the current atmospheric conditions?
Science 1206 SAMPLE Test ( Weather Dynamics) Name:. Part A: Multiple Choice (60%) Shade the letter of the best answer on the Scantron sheet provided. 1. Which term refers to the current atmospheric conditions?
2. What are the four most common gasses in the atmosphere and their percentages?
 Meteorology Review Directions: Answer the following open ended review questions. Utilize a diagram where appropriate and do make sure that you label and describe the drawing. Atmospheric Composition 1.
Final Examination, MEA 443 Fall 2008, Lackmann
 Place an X here to count it double! Name: Final Examination, MEA 443 Fall 2008, Lackmann If you wish to have the final exam count double and replace your midterm score, place an X in the box above. As
The Planetary Circulation System
 12 The Planetary Circulation System Learning Goals After studying this chapter, students should be able to: 1. describe and account for the global patterns of pressure, wind patterns and ocean currents
Lecture #14 March 29, 2010, Monday. Air Masses & Fronts
 Lecture #14 March 29, 2010, Monday Air Masses & Fronts General definitions air masses source regions fronts Air masses formation types Fronts formation types Air Masses General Definitions a large body
THE LOW-LEVEL JET FOR BUCHAREST S AIRPORTS - A STUDY OF ITS CHARACTERISTICS IN WINTER SEASON BETWEEN 1959 AND 1982
 Romanian Reports in Physics, Vol. 67. No. 2, P. 638 652, 2015 THE LOW-LEVEL JET FOR BUCHAREST S AIRPORTS - A STUDY OF ITS CHARACTERISTICS IN WINTER SEASON BETWEEN 1959 AND 1982 M. BALMEZ 1,2, F. GEORGESCU
and 24 mm, hPa lapse rates between 3 and 4 K km 1, lifted index values
 3.2 Composite analysis 3.2.1 Pure gradient composites The composite initial NE report in the pure gradient northwest composite (N = 32) occurs where the mean sea level pressure (MSLP) gradient is strongest
Romanian Contribution in Quantitative Precipitation Forecasts Project
 3 Working Group on Physical Aspects 29 Romanian Contribution in Quantitative Precipitation Forecasts Project Rodica Dumitrache, Victor Pescaru, Liliana Velea, Cosmin Barbu National Meteorological Administration,
ESCI 344 Tropical Meteorology Lesson 8 Tropical Weather Systems
 ESCI 344 Tropical Meteorology Lesson 8 Tropical Weather Systems References: Tropical Climatology (2 nd Ed.), McGregor and Nieuwolt Climate and Weather in the Tropics, Riehl Climate Dynamics of the Tropics,
San Francisco State University Department of Earth & Climate Sciences Fall 2017
 San Francisco State University Name Department of Earth & Climate Sciences Fall 2017 Part 1: Fronts Final Inclass Exercise (Inclass Exercise 11) Diagnosing Fronts and Upper Tropospheric Divergence Patterns
Synoptic Meteorology II: Frontogenesis Examples Figure 1
 Synoptic Meteorology II: Frontogenesis Examples The below images, taken from the 1200 UTC 17 January 2019 GFS forecast run, provide examples of the contributions of deformation and divergence to frontogenesis.
Diagnostic Study of a Severe Thunderstorm over Jeddah
 Atmospheric and Climate Sciences, 2013, 3, 150-164 http://dx.doi.org/10.4236/acs.2013.31017 Published Online January 2013 (http://www.scirp.org/journal/acs) Diagnostic Study of a Severe Thunderstorm over
Lec 10: Interpreting Weather Maps
 Lec 10: Interpreting Weather Maps Case Study: October 2011 Nor easter FIU MET 3502 Synoptic Hurricane Forecasts Genesis: on large scale weather maps or satellite images, look for tropical waves (Africa
Fixed Rossby Waves: Quasigeostrophic Explanations and Conservation of Potential Vorticity
 Fixed Rossby Waves: Quasigeostrophic Explanations and Conservation of Potential Vorticity 1. Observed Planetary Wave Patterns After upper air observations became routine, it became easy to produce contour
Chapter22 Weather Maps
 Name Teacher Period Date hapter22 Weather Maps hapter 22 Skill Sheet 1: Fronts Air masses are bodies of air that are relatively uniform in temperature and humidity. These bodies of air take on the characteristic
Chapter 10: Mid-latitude Cyclones Mid-Latitude Cyclones
 Chapter 10: Mid-latitude Cyclones Mid-Latitude Cyclones Mid-latitude cyclones form along a boundary separating polar air from warmer air to the south. Life Cycle of Cyclone Cyclone Structures Steering
Chapter 10: Mid-latitude Cyclones
 Chapter 10: Mid-latitude Cyclones Life Cycle of Cyclone Cyclone Structures Steering of Cyclone Mid-Latitude Cyclones Mid-latitude cyclones form along a boundary separating polar air from warmer air to
Unit Three Worksheet Meteorology/Oceanography 2 WS GE U3 2
 Unit Three Worksheet Meteorology/Oceanography 2 WS GE U3 2 Name Period Section 17.3 1. 2. 3. 4. 5. 6. 7. 8. Of the following, which is NOT a factor that controls temperature? (C) latitude (D) longitude
MET 3502 Synoptic Meteorology. Lecture 5: Surface Weather Elements
 MET 3502 Synoptic Meteorology Lecture 5: Surface Weather Elements Surface Weather Elements Not observations of the surface, but Observations made by an observer (or instrument) at the surface Example:
What a Hurricane Needs to Develop
 Weather Weather is the current atmospheric conditions, such as air temperature, wind speed, wind direction, cloud cover, precipitation, relative humidity, air pressure, etc. 8.10B: global patterns of atmospheric
ATSC 2000 Final Fall 2005
 ATSC 2000 Final Fall 2005 true/false /25 multiple choice /25 short answer /23 essay /10 total /83 or % True/False Indicate whether the sentence or statement is true or false. (25 questions 1% each) 1.
5 Atmospheric Disturbances 7 1.Cyclones- tropical and temperate and associated weather conditions. 2.Anticyclones and associated weather conditions.
 5 Atmospheric Disturbances 7 1.Cyclones- tropical and temperate and associated weather conditions. 2.Anticyclones and associated weather conditions. atmospheric disturbances (weather systems) that are
Chapter 5. Summary and Conclusions
 Chapter 5. Summary and Conclusions Two cases of heavy rainfall were analyzed using observational data sets and model simulations. The first case was the landfall of Hurricane Floyd in North Carolina in
Severe Freezing Rain in Slovenia
 Severe Freezing Rain in Slovenia Janez Markosek, Environmental Agency, Slovenia Introduction At the end of January and at the beginning of February 2014, severe and long-lasting freezing rain affected
Weather, Air Masses, Fronts and Global Wind Patterns. Meteorology
 Weather, Air Masses, Fronts and Global Wind Patterns Meteorology Weather is what conditions of the atmosphere are over a short period of time. Climate is how the atmosphere "behaves" over long periods
Middle-Latitude Cyclone
 Middle-Latitude Cyclone What is a mid-latitude cyclone? - The mid-latitude cyclone is a synoptic scale low pressure system that has cyclonic (counter-clockwise in northern hemisphere) flow that is found
- tornadoes. Further Reading: Chapter 08 of the text book. Outline. - cyclones and anti-cyclones. -tropical storms. -Storm surge
 (1 of 16) Further Reading: Chapter 08 of the text book Outline - cyclones and anti-cyclones - tornadoes -tropical storms -Storm surge (2 of 16) Introduction Previously, We talked about fronts and their
Fog forecast in Oltenia
 Fog forecast in Oltenia Şerban-Eugen Iordăchescu, Magdalena Iordăchescu Regional Meteorological Center Oltenia, Weather Service Forecast Craiova 105 Calea Bucuresti, Craiova, Dolj, Romania e-mail: sebi_iordachescu@yahoo.com,
Revisiting the Structure and Characteristics of an Early Summer Monsoon Trough over South China in 1975
 194 SOLA, 2014, Vol. 10, 194 198, doi:10.2151/sola.2014-041 Revisiting the Structure and Characteristics of an Early Summer Monsoon Trough over South China in 1975 Feng Hsiao and Yi-Leng Chen University
11B.1 INFLUENCE OF DIABATIC POTENTIAL VORTICITY ANOMALIES UPON WARM CONVEYOR BELT FLOW. PART I: FEBRUARY 2003
 INFLUENCE OF DIABATIC POTENTIAL VORTICITY ANOMALIES UPON WARM CONVEYOR BELT FLOW. PART I: 14-15 FEBRUARY 2003 Philip N. Schumacher, NOAA/NWS, Sioux Falls, SD Joshua M. Boustead, NOAA/NWS, Valley, NE Martin
Air Masses, Weather Systems and Hurricanes
 The Earth System - Atmosphere IV Air Masses, Weather Systems and Hurricanes Air mass a body of air which takes on physical characteristics which distinguish it from other air. Classified on the basis of
Science 1206 Chapter 1 - Inquiring about Weather
 Science 1206 Chapter 1 - Inquiring about Weather 1.1 - The Atmosphere: Energy Transfer and Properties (pp. 10-25) Weather and the Atmosphere weather the physical conditions of the atmosphere at a specific
Air Masses, Fronts, Storm Systems, and the Jet Stream
 Air Masses, Fronts, Storm Systems, and the Jet Stream Air Masses When a large bubble of air remains over a specific area of Earth long enough to take on the temperature and humidity characteristics of
Custom Weather Forecast
 1 of 23 Custom Weather Forecast 2018 Chicago Yacht Club s Race To Mackinac- Cruising Division Disclaimer: The user assumes all risk related to the use of this Custom Weather Forecast. The crew of the participating
Winter Storm of 15 December 2005 By Richard H. Grumm National Weather Service Office State College, PA 16803
 Winter Storm of 15 December 2005 By Richard H. Grumm National Weather Service Office State College, PA 16803 1. INTRODUCTION A complex winter storm brought snow, sleet, and freezing rain to central Pennsylvania.
Severe weather (potential use of PWAT-precipitable water content derived from GNSS data) Mieczysław Sobik, Marek Błaś Uniwersytet Wrocławski
 Mieczysław Sobik, Marek Błaś Uniwersytet Wrocławski") Severe weather (potential use of PWAT-precipitable water content derived from GNSS data) Mieczysław Sobik, Marek Błaś Uniwersytet Wrocławski Two aspects of severe weather discussed: Excessive rainfall
Severe weather (potential use of PWAT-precipitable water content derived from GNSS data) Mieczysław Sobik, Marek Błaś Uniwersytet Wrocławski Two aspects of severe weather discussed: Excessive rainfall
Atmospheric Fronts. The material in this section is based largely on. Lectures on Dynamical Meteorology by Roger Smith.
 Atmospheric Fronts The material in this section is based largely on Lectures on Dynamical Meteorology by Roger Smith. Atmospheric Fronts 2 Atmospheric Fronts A front is the sloping interfacial region of
Hurricanes. April 14, 2009
 Tropical Weather & Hurricanes Chapter 15 April 14, 2009 Tropical meteorology Tropics characterized by seasonal wet and drier periods- wet when sun is nearly overhead at noon and inter-tropical convergence
AIR MASSES SOURCE REGION CHARACTERISTICS Continental Arctic (ca) Greenland, Antarctica, Highest latitudes of Asia and North America
 Greenland, Antarctica, Highest latitudes of Asia and North America") GEOGRAPHY CLIMATOLOGY AIRMASS, FRONT AND TEMPERATE CYCLONE AIRMASS A large body of air having little horizontal variation in temperature and moisture is called an airmass. Airmass acquires its properties
GEOGRAPHY CLIMATOLOGY AIRMASS, FRONT AND TEMPERATE CYCLONE AIRMASS A large body of air having little horizontal variation in temperature and moisture is called an airmass. Airmass acquires its properties
r 1 THEGREAT-VOLUMERAINSTORMATELBA,ALABAMA INTRODUCTION
 JUNE 1964 MONTHLY WEATHER REVIEW 153 THEGREAT-VOLUMERAINSTORMATELBA,ALABAMA GEORGE A. LOT" Hydrologic Services Mvfsion, U. S. Weather Bureau.1 Washington, D. C. Manuscript received July 7, 1953; revised
Prediction of western disturbances and associated weather over Western Himalayas
 Prediction of western disturbances and associated weather over Western Himalayas H. R. Hatwar*, B. P. Yadav and Y. V. Rama Rao India Meteorological Department, Lodi Road, New Delhi 110 003, India Two cases
Occlusion Cyclogenesis
 Occlusion Cyclogenesis Part I: Occlusion cloud bands in comparison to CF and WFs Concepts for cyclogenesis Different types of cyclogenesis and examples Numerical parameters on isobaric and isentropic surfaces
FORECASTING SURFACE SYSTEMS
 CHAPTER 3 FORECASTING SURFACE SYSTEMS With the upper air prognosis completed, the next step is to construct the surface prognostic chart Since more data is available for the surface chart, and this chart
Features of the wind fields associated with Typhoon 0418 (Songda) compared with those of Typhoon 9119 (Mireille)
 compared with those of Typhoon 9119 (Mireille)") Features of the wind fields associated with Typhoon 0418 (Songda) compared with those of Typhoon 9119 (Mireille) by Fumiaki Fujibe 1, Naoko Kitabatake 2, Kotaro Bessho 2 and Shunsuke Hoshino 3 ABSTRACT
Features of the wind fields associated with Typhoon 0418 (Songda) compared with those of Typhoon 9119 (Mireille) by Fumiaki Fujibe 1, Naoko Kitabatake 2, Kotaro Bessho 2 and Shunsuke Hoshino 3 ABSTRACT
TFS WEATHER BRIEF. Monday, March 25
 TFS WEATHER BRIEF Monday, March 25 Review: The leading edge of cooler and drier air was pushing through Central and East TX this morning. A few lingering thunderstorms were in progress south of I-20 in
The Ihtiman Flood Event in Bulgaria, Ilian Gospodinov
 The Ihtiman Flood Event in Bulgaria, 04-07.08.2005 Ilian Gospodinov Introduction The Ihtiman flood event in Bulgaria in the beginning of August 2005 provoked an outrage of polemics concerning the weather
ESCI 1010 Lab 6 Midlatitude Cyclones and Thunderstorms
 ESCI 1010 Lab 6 Midlatitude Cyclones and Thunderstorms Before Lab: Review pages 244-324 in your Weather and Climate textbook. Pay special attention to the sections entitled Fronts, Life Cyclone of a Midlatitude
SNOW LEVEL FORECASTING METHODS AND PARAMETERS; TWO PRACTICAL EXAMPLES ON EASTERN ITALIAN ALPS
 P 1.12 SNOW LEVEL FORECASTING METHODS AND PARAMETERS; TWO PRACTICAL EXAMPLES ON EASTERN ITALIAN ALPS 1. Gianni Marigo*; 2. Thierry Robert-Luciani; 3. Andrea Crepaz Environmental Agency of the Veneto Region
MET Lecture 18 Cold Waves (CH14)
") MET 4300 Lecture 18 Cold Waves (CH14) Cold Waves, or Polar Outbreaks Influx of unusually cold air into middle and lower latitudes Generally cover larger areas than blizzards or ice storms On average claim
MET 4300 Lecture 18 Cold Waves (CH14) Cold Waves, or Polar Outbreaks Influx of unusually cold air into middle and lower latitudes Generally cover larger areas than blizzards or ice storms On average claim
Rapid cyclogenesis over Poland on 28 March 1997
 Meteorol. Appl. 6, 363 370 (1999) Rapid cyclogenesis over Poland on 28 March 1997 Jan Waclaw Parfiniewicz, Institute of Meteorology and Water Management, ul. Podleœna 61, 01 673 Warszawa, Poland A small
10B.2 THE ROLE OF THE OCCLUSION PROCESS IN THE EXTRATROPICAL-TO-TROPICAL TRANSITION OF ATLANTIC HURRICANE KAREN
 10B.2 THE ROLE OF THE OCCLUSION PROCESS IN THE EXTRATROPICAL-TO-TROPICAL TRANSITION OF ATLANTIC HURRICANE KAREN Andrew L. Hulme* and Jonathan E. Martin University of Wisconsin-Madison, Madison, Wisconsin
AOS 452 Lab 13 Handout Upper-Level Frontogenesis and Sawyer-Eliassen Circulations
 AOS 452 Lab 13 Handout Upper-Level Frontogenesis and Sawyer-Eliassen Circulations Introduction As we discussed in class, fronts are locations at which we cannot ignore the effects of ageostrophy. Furthermore,
CONVERGENCE, DIVERGENCE, AND VORTICITY
 CHAPTER 1 CONVERGENCE, DIVERGENCE, AND VORTICITY In your reading of the AG2 manual, volume 1, you became familiar with the terms convergence, divergence, and vorticity when used in relation to surface
Upper-tropospheric downstream development leading to surface cyclogenesis in the central Mediterranean
 Meteorol. Appl. 6, 33 3 (999) Upper-tropospheric downstream development leading to surface cyclogenesis in the central Mediterranean Nicholas G Prezerakos, Helena A Flocas and Silas C Michaelides 3 General
air masses and Fronts 2013.notebook January 29, 2013
 1/4/12 Notes 1 Weather Data Log.docx 2 Air Masses Uniform bodies of air An air mass is a large body of air that has similar temperature and moisture throughout. How to name an air mass: first write the
Weather Notes. Chapter 16, 17, & 18
 Weather Notes Chapter 16, 17, & 18 Weather Weather is the condition of the Earth s atmosphere at a particular place and time Weather It is the movement of energy through the atmosphere Energy comes from