The water vapour channels of SEVIRI (Meteosat). An introduction
|
|
|
- Bennett Gordon
- 6 years ago
- Views:
Transcription
.")

1 The water vapour channels of SEVIRI (Meteosat). An introduction Cachoeira P. July 2006 Formats 1.5 1
2 Objectives 2 Describe the characteristics of WV channels on board of SEVIRI Describe the relation between signal and the temperature in the atmospheric water vapour Learn on options for channel information display Learn of some synoptic clues contained in the WV channels Apply the previous knowledge to the interpretation of the airmass RGB
3 Contents 3 Characteristics of WV channels Radiative transfer considerations Synoptic features in WV Use in RGBs of WV channels
4 WV channel characteristics 4 SEVIRI channels at: 6.2 µm and 7.3 µm Strong absorption by water vapour, stronger for 6.2 Contribution from Hpa ( K) Contribution from lower levels in a dry atmosphere Strongest humidity impact on signal: 100HPa above contribution peak No depiction of low atmosphere or ground Nile river due to humid convection. Mountain ranges in desert areas. High cloud (Cb, anvils) appears as in other IR Lower cloud masked by water vapour absorption above


5 Spatial and spectral resolution 5 Horizontal: 3.5 km at SSP 7.3µm has a smaller bandwidth

6 Deeper into the atmosphere:
7 Vertical resolution 7 Transfer: absorption + weaker emission at colder T Strong absorption by cloud, as in other IR channels Dependent on humidity and temperature profiles Warm-or-dry ambiguity in WV channels Similar signal in the Arctic as in the tropics More humidity: decreased, upper levels signal Reversed channel difference for thermal inversions
8 Top of the atmosphere R Hpa Radiation Transfer ( WV ) R= B(T) (p--top) 900 Hpa Amount of absorber Earth s surface
9 Noisy channels? 9 MSG noise: 0.12K@250 (7.3µm) Contribution 6.2 [ 0.11K@300 (10.8µm) ] Very accurate information Contribution 7.3 However, WV provides a hazy weather depiction: spread vertical contribution mixes humidity with temperature in one count humidity fields are smoother than temperature
10 Humidity layers 10 Humid at mid-level Dry Humid
11 Applications of WV imagery 11 Synoptic and meso-scale diagnosis Jet stream Ascent regions Dry intrusions Vorticity centres Wedges and troughs Relative movement Deformation zones

12 Synoptic diagnosis 12

13 Wind and shear maxima 13 Wind maxima along dark slots in the WV image Maximum shear occurs on the left hand side, creating shear and circulation vortices

14 Applications of WV imagery 14 Numerical model validation


15 Applications of WV imagery 15 Atmospheric motion and humidity retrieval
16 Potential vorticity (PV) 16 = Stability * Absolute vorticity Growing from ground to stratosphere Conserved along the flow (except for turbulence and heating) Vorticity anomalies generate ascent ahead and subsidence behind

17 Potential vorticity (PV) Storm Emma, Met-9 Channel 5 1-Mar UTC, and height for PV=1 unit 17


18 Synoptic recipes 18 Dry zones, subsidence and tropopause intrusions are the darkest areas in the image Gray filling of dark areas means ascent Wind maxima are close to dry slots Dry intrusions from stratosphere supply potential vorticity and cyclogenesis 1.5 PVU height and 6.2µm Browning, Georgiev C. Georgiev

19 Synoptic recipes 19 Dry slots = Subsidence = [PV anomalies >1.5 PVU] = = Tropopause folding = downstream Cyclogenesis WV count is not a measure of PV (in particular for cut-off lows) C. Georgiev


20 Count daily cycle and monthly evolution 20 Ch.6 Ch.5 Ch.1 Ch.9 Ch.8 WV channel-6 daily cycle: 1K diurnal amplitude, 0.2K inter-day change Causes: sun absorption, dry air over hot ground, convective cooling Over the Sahara, afternoon: Ch.6 cooling but Ch.5 warming (convective balancing)

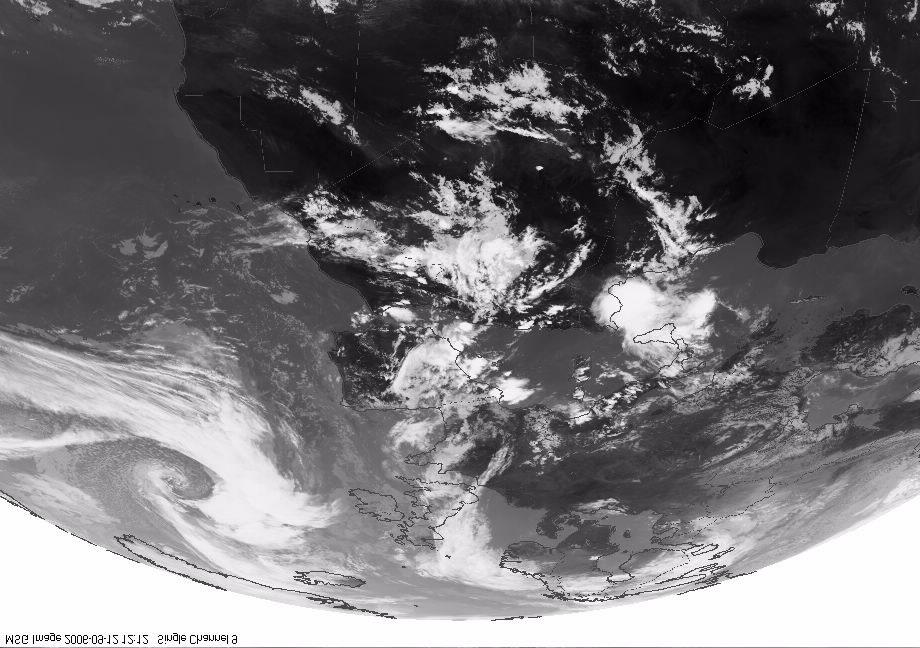
 Channel 9 image with overshooting tops")
21 Overshooting 21 Water vapour or ice crystals overshoot the tropopause and reach warmer environments (reversed sign in 5-6 difference, or 5-9) Channel 9 image with overshooting tops in colour
 and Dobson/10 (lines) Poor indication of ozone or")

22 Ozone and air masses 22 Airflow product, 25-Feb UTC Ozone temperature (dots) and Dobson/10 (lines) Poor indication of ozone or stratospheric folding in the airflow product Low correlation of ozone with cloud systems High correlation between water vapour channels and vertical movement
 and Dobson/10 (lines) Poor correlations between reddish")
 and ozone")
23 Ozone and air masses 23 Airflow product, 11-Mar UTC Ozone temperature (dots) and Dobson/10 (lines) Poor correlations between reddish areas and O3 estimates Difficult tracing of tropopause foldings in O3 estimates High independence between ozone temperature (dynamics) and ozone thickness (chemistry)
24 Ozone estimate MSG-2 12:00 12-Sept µm radiation (ch.8) is absorbed by stratospheric O3 B8(T8)=(1- α)*b8(t9) + α*b8(t) B8 is the Planck function for channel 8, at 9.7µm Minimisation on 21x21 pairs (T8,T9) i allows an estimate of (T, α) for the super pixel Independence between T and αretrievals

25 Airmass colour composite MSG-2 12:00 12-Sept


26 Airmass colour composite Kelvin 5-6 Channels
27 Airmass colour composite MSG-2 12:00 12-Sept Meaning of components for clear areas: RED: humid at mid-level or stable GREEN: cold surface (~ stable) BLUE: humid at high level or unstable BROWN: stable area
28 Conclusion 28 Profile in the atmosphere (instability) Not as intuitive as the window channels: dirt in the window Wind tracer Time for questions
INTERPRETATION GUIDE TO MSG WATER VAPOUR CHANNELS
 INTERPRETATION GUIDE TO MSG WATER VAPOUR CHANNELS C.G. Georgiev1 and P. Santurette2 1 National Institute of Meteorology and Hydrology, Tsarigradsko chaussee 66, 1784 Sofia, Bulgaria 2 Météo-France, 42,
Applications of the SEVIRI window channels in the infrared.
 Applications of the SEVIRI window channels in the infrared jose.prieto@eumetsat.int SEVIRI CHANNELS Properties Channel Cloud Gases Application HRV 0.7 Absorption Scattering
For the operational forecaster one important precondition for the diagnosis and prediction of
 Initiation of Deep Moist Convection at WV-Boundaries Vienna, Austria For the operational forecaster one important precondition for the diagnosis and prediction of convective activity is the availability
WATER VAPOUR IMAGERY ANALYSIS IN 7.3µ/6.2µ FOR DIAGNOSING THERMO-DYNAMIC CONTEXT OF INTENSE CONVECTION
 WATER VAPOUR IMAGERY ANALYSIS IN 7.3µ/6.2µ FOR DIAGNOSING THERMO-DYNAMIC CONTEXT OF INTENSE CONVECTION P. Santurette 1 and C.G. Georgiev 2 1 Météo-France, 42, Avenue G. Coriolis, 31057 Toulouse Cedex 01,
QUALITY OF MPEF DIVERGENCE PRODUCT AS A TOOL FOR VERY SHORT RANGE FORECASTING OF CONVECTION
 QUALITY OF MPEF DIVERGENCE PRODUCT AS A TOOL FOR VERY SHORT RANGE FORECASTING OF CONVECTION C.G. Georgiev 1, P. Santurette 2 1 National Institute of Meteorology and Hydrology, Bulgarian Academy of Sciences
Vertical structure. To conclude, we will review the critical factors invloved in the development of extratropical storms.
 Vertical structure Now we will examine the vertical structure of the intense baroclinic wave using three visualization tools: Upper level charts at selected pressure levels Vertical soundings for selected
MSG/SEVIRI CHANNEL 4 Short-Wave IR 3.9 m IR3.9 Tutorial
 MSG/SEVIRI CHANNEL 4 Short-Wave IR Channel @ 3.9 m IR3.9 Tutorial HansPeter Roesli EUMETSAT satmet.hp@ticino.com Contributions: D Rosenfeld (HUJ) J Kerkmann (EUM), M Koenig (EUM), J Prieto (EUM), HJ Lutz
Comparison of cloud statistics from Meteosat with regional climate model data
 Comparison of cloud statistics from Meteosat with regional climate model data R. Huckle, F. Olesen, G. Schädler Institut für Meteorologie und Klimaforschung, Forschungszentrum Karlsruhe, Germany (roger.huckle@imk.fzk.de
1. COLD FRONT - CLOUD STRUCTURE IN SATELLITE IMAGES
 1. COLD FRONT - CLOUD STRUCTURE IN SATELLITE IMAGES The satellite image shows a cyclonically curved synoptic scale cloud band usually a few hundred kilometres wide; in the VIS image the cloud band mostly
CLIMATE AND CLIMATE CHANGE MIDTERM EXAM ATM S 211 FEB 9TH 2012 V1
 CLIMATE AND CLIMATE CHANGE MIDTERM EXAM ATM S 211 FEB 9TH 2012 V1 Name: Student ID: Please answer the following questions on your Scantron Multiple Choice [1 point each] (1) The gases that contribute to
Occlusion cyclogenesis II
 Occlusion cyclogenesis II Upper level influences on cyclogenesis Vorticity Advection (CVA) and the 4-quadrant jet streak model (Uccellini) Potential Vorticity (PV) (Hoskins Theory) Rapid cyclogenesis 14
and 24 mm, hPa lapse rates between 3 and 4 K km 1, lifted index values
 3.2 Composite analysis 3.2.1 Pure gradient composites The composite initial NE report in the pure gradient northwest composite (N = 32) occurs where the mean sea level pressure (MSLP) gradient is strongest
Meteorology Today. 1 Aug st Lt Libby Haynes Capt Kim Mevers
 Meteorology 1950 - Today 1 Aug 2018 1 st Lt Libby Haynes Capt Kim Mevers What is meteorology? Is it important to you? Meteorology is the science of the atmosphere embracing both weather and climate. It
Science Olympiad Meteorology Quiz #2 Page 1 of 8
 1) The prevailing general direction of the jet stream is from west to east in the northern hemisphere: 2) Advection is the vertical movement of an air mass from one location to another: 3) Thunderstorms
Occlusion Cyclogenesis
 Occlusion Cyclogenesis Part I: Occlusion cloud bands in comparison to CF and WFs Concepts for cyclogenesis Different types of cyclogenesis and examples Numerical parameters on isobaric and isentropic surfaces
PRECONVECTIVE SOUNDING ANALYSIS USING IASI AND MSG- SEVIRI
 PRECONVECTIVE SOUNDING ANALYSIS USING IASI AND MSG- SEVIRI Marianne König, Dieter Klaes EUMETSAT, Eumetsat-Allee 1, 64295 Darmstadt, Germany Abstract EUMETSAT operationally generates the Global Instability
GEOGRAPHY AND HISTORY
 GEOGRAPHY AND HISTORY YEAR 1, PART 1 www.vicensvives.es Contents 01 Our planet Earth 02 The representation of the Earth: maps 03 The Earth s relief 04 Rivers and seas 05 Weather and climate 06 Climates
THE FEASIBILITY OF EXTRACTING LOWLEVEL WIND BY TRACING LOW LEVEL MOISTURE OBSERVED IN IR IMAGERY OVER CLOUD FREE OCEAN AREA IN THE TROPICS
 THE FEASIBILITY OF EXTRACTING LOWLEVEL WIND BY TRACING LOW LEVEL MOISTURE OBSERVED IN IR IMAGERY OVER CLOUD FREE OCEAN AREA IN THE TROPICS Toshiro Ihoue and Tetsuo Nakazawa Meteorological Research Institute
Global Atmospheric Circulation
 Global Atmospheric Circulation Polar Climatology & Climate Variability Lecture 11 Nov. 22, 2010 Global Atmospheric Circulation Global Atmospheric Circulation Global Atmospheric Circulation The Polar Vortex
How to display RGB imagery by SATAID
 How to display RGB imagery by SATAID Akihiro SHIMIZU Meteorological Satellite Center (MSC), Japan Meteorological Agency (JMA) Ver. 2015110500 RGB imagery on SATAID SATAID software has a function of overlapping
Lecture 19: Operational Remote Sensing in Visible, IR, and Microwave Channels
 MET 4994 Remote Sensing: Radar and Satellite Meteorology MET 5994 Remote Sensing in Meteorology Lecture 19: Operational Remote Sensing in Visible, IR, and Microwave Channels Before you use data from any
Convective Cloud Features in typical synoptic situations. Frans Debie
 Convective Cloud Features in typical synoptic situations Frans Debie me SATRAPPERS Henk vesa Frans Veronika ab Teachers classroom Langen Cumulonimbus: Convection Convection, seen from ground 1 2 3 4 Outflow
Day Microphysics RGB Nephanalysis in daytime. Meteorological Satellite Center, JMA
 Day Microphysics RGB Nephanalysis in daytime Meteorological Satellite Center, JMA What s Day Microphysics RGB? R : B04 (N1 0.86) Range : 0~100 [%] Gamma : 1.0 G : B07(I4 3.9) (Solar component) Range :
Introduction to Conceptual Models
 Zentralanstalt für Meteorologie und Geodynamik Introduction to Conceptual Models Veronika Zwatz-Meise IR Satellite Images with Satrep From Cloud systems in satellite images to Conceptual Models If we look
PRECIPITATION ESTIMATION FROM INFRARED SATELLITE IMAGERY
 PRECIPITATION ESTIMATION FROM INFRARED SATELLITE IMAGERY A.M. BRASJEN AUGUST 2014 1 2 PRECIPITATION ESTIMATION FROM INFRARED SATELLITE IMAGERY MASTER S THESIS AUGUST 2014 A.M. BRASJEN Department of Geoscience
The Atmosphere. Topic 3: Global Cycles and Physical Systems. Topic 3: Global Cycles and Physical Systems. Topic 3: Global Cycles and Physical Systems
 The Atmosphere 1 How big is the atmosphere? Why is it cold in Geneva? Why do mountaineers need oxygen on Everest? 2 A relatively thin layer of gas over the Earths surface Earth s radius ~ 6400km Atmospheric
HARMONISING SEVIRI RGB COMPOSITES FOR OPERATIONAL FORECASTING
 HARMONISING SEVIRI RGB COMPOSITES FOR OPERATIONAL FORECASTING HansPeter Roesli (1), Jochen Kerkmann (1), Daniel Rosenfeld (2) (1) EUMETSAT, Darmstadt DE, (2) The Hebrew University of Jerusalem, Jerusalem
A more detailed and quantitative consideration of organized convection: Part I Cold pool dynamics and the formation of squall lines
 A more detailed and quantitative consideration of organized convection: Part I Cold pool dynamics and the formation of squall lines Note: Lecture notes presented here based on course Daily Weather Laboratory
Nowcasting of Severe Weather from Satellite Images (for Southern
 Nowcasting of Severe Weather from Satellite Images (for Southern Europe) Petra Mikuš Jurković Forecasting/ nowcasting of convective storms NWP models cannot well predict the exact location and intesity
Isentropic Analysis. Much of this presentation is due to Jim Moore, SLU
 Isentropic Analysis Much of this presentation is due to Jim Moore, SLU Utility of Isentropic Analysis Diagnose and visualize vertical motion - through advection of pressure and system-relative flow Depict
Global Energy Balance: Greenhouse Effect
 Global Energy Balance: Greenhouse Effect Atmospheric Composition & Structure Physical Causes of Greenhouse Effects Chapter 3: 44 48. Atmospheric Composition Why does water vapor vary so much? Saturation
Remote Sensing Seminar 8 June 2007 Benevento, Italy. Lab 5 SEVIRI and MODIS Clouds and Fires
 Remote Sensing Seminar 8 June 2007 Benevento, Italy Lab 5 SEVIRI and MODIS Clouds and Fires Table: SEVIRI Channel Number, Wavelength (µm), and Primary Application Reflective Bands 1,2 0.635, 0.81 land/cld
6A.4 REFLECTIVE STORM TOPS: A SATELLITE METHOD FOR INFERRING THUNDERSTORM TOP MICROPHYSICAL STRUCTURE. Fort Collins, Colorado. Fort Collins, Colorado
 6A.4 REFLECTIVE STORM TOPS: A SATELLITE METHOD FOR INFERRING THUNDERSTORM TOP MICROPHYSICAL STRUCTURE Daniel T. Lindsey 1* and Louie Grasso 2 1 NOAA/NESDIS/ORA/RAMMB Fort Collins, Colorado 2 Cooperative
Joseph Kagenyi Principal Meteorologist (RS/GIS) IMTR-NAIROBI 13 th UFA September 2018
 IMTR-NAIROBI 13 th UFA September 2018") Joseph Kagenyi Principal Meteorologist (RS/GIS) IMTR-NAIROBI 13 th UFA 24-28 September 2018 kagenyijn@gmail.com 1. PUMA WorkStation structure 2. Data Available on PUMA Station 3. PUMA Nowcasting Applications
Joseph Kagenyi Principal Meteorologist (RS/GIS) IMTR-NAIROBI 13 th UFA 24-28 September 2018 kagenyijn@gmail.com 1. PUMA WorkStation structure 2. Data Available on PUMA Station 3. PUMA Nowcasting Applications
Boundary layer controls on extratropical cyclone development
 Boundary layer controls on extratropical cyclone development R. S. Plant (With thanks to: I. A. Boutle and S. E. Belcher) 28th May 2010 University of East Anglia Outline Introduction and background Baroclinic
The atmosphere: A general introduction Niels Woetmann Nielsen Danish Meteorological Institute
 The atmosphere: A general introduction Niels Woetmann Nielsen Danish Meteorological Institute Facts about the atmosphere The atmosphere is kept in place on Earth by gravity The Earth-Atmosphere system
Czech Hydrometeorological Institute, Na Šabatce 17, CZ Praha 4, Czech Republic. 3
 MOISTURE DETECTION ABOVE CONVECTIVE STORMS UTILIZING THE METHOD OF BRIGHTNESS TEMPERATURE DIFFERENCES BETWEEN WATER VAPOR AND IR WINDOW BANDS, BASED ON 2008 MSG RAPID SCAN SERVICE DATA Jindřich Šťástka1,2,
Topic # 11 HOW CLIMATE WORKS PART II
 Topic # 11 HOW CLIMATE WORKS PART II The next chapter in the story: How differences in INSOLATION between low and high latitudes drive atmospheric circulation! pp 64 in Class Notes THE RADIATION BALANCE
Advanced Satellite Remote Sensing: Microwave Remote Sensing. August 11, 2011
 Advanced Satellite Remote Sensing: Microwave Remote Sensing FIU HRSSERP Internship August 11, 2011 What can Microwave Satellites Measure? Ocean Surface Wind Speed SeaIce Concentration, Edge, and age Precipitation
ATMO 436a. The General Circulation. Redacted version from my NATS lectures because Wallace and Hobbs virtually ignores it
 ATMO 436a The General Circulation Redacted version from my NATS lectures because Wallace and Hobbs virtually ignores it Scales of Atmospheric Motion vs. Lifespan The general circulation Atmospheric oscillations
Temperature (T) degrees Celsius ( o C) arbitrary scale from 0 o C at melting point of ice to 100 o C at boiling point of water Also (Kelvin, K) = o C
 degrees Celsius ( o C) arbitrary scale from 0 o C at melting point of ice to 100 o C at boiling point of water Also (Kelvin, K) = o C") 1 2 3 4 Temperature (T) degrees Celsius ( o C) arbitrary scale from 0 o C at melting point of ice to 100 o C at boiling point of water Also (Kelvin, K) = o C plus 273.15 0 K is absolute zero, the minimum
1 2 3 4 Temperature (T) degrees Celsius ( o C) arbitrary scale from 0 o C at melting point of ice to 100 o C at boiling point of water Also (Kelvin, K) = o C plus 273.15 0 K is absolute zero, the minimum
Science Chapter 13,14,15
 Science 1206 Chapter 13,14,15 1 Weather dynamics is the study of how the motion of water and air causes weather patterns. Energy from the Sun drives the motion of clouds, air, and water. Earth s tilt at
The October 2015 Supercell Storm in Israel
 The October 2015 Supercell Storm in Israel Alissa Razy, Elyakom Vadislavsky, Anat Baharad, Noam Halfon, Itsik Carmona, Yoav Levi, Amit Savir Introduction A high-impact weather event associated with severe
Saharan Dust Longwave Radiative Forcing using GERB and SEVIRI
 Imperial College London Saharan Dust Longwave Radiative Forcing using GERB and SEVIRI Vincent Gimbert 1, H.E. Brindley 1, Nicolas Clerbaux 2, J.E. Harries 1 1. Blackett Laboratory, Imperial College, London
Chapter 12 Fronts & Air Masses
 Chapter overview: Anticyclones or highs Air Masses o Classification o Source regions o Air masses of North America Fronts o Stationary fronts o Cold fronts o Warm fronts o Fronts and the jet stream o Frontogenesis
Lecture # 04 January 27, 2010, Wednesday Energy & Radiation
 Lecture # 04 January 27, 2010, Wednesday Energy & Radiation Kinds of energy Energy transfer mechanisms Radiation: electromagnetic spectrum, properties & principles Solar constant Atmospheric influence
RGB Products: an easy and practical way to display multispectral satellite data (in combination with derived products)
") RGB Products: an easy and practical way to display multispectral satellite data (in combination with derived products) Dr. Jochen Kerkmann Training Officer EUMETSAT Multi-channel GEO satellites today Him-08
RGB Products: an easy and practical way to display multispectral satellite data (in combination with derived products) Dr. Jochen Kerkmann Training Officer EUMETSAT Multi-channel GEO satellites today Him-08
Interpretation of Polar-orbiting Satellite Observations. Atmospheric Instrumentation
 Interpretation of Polar-orbiting Satellite Observations Outline Polar-Orbiting Observations: Review of Polar-Orbiting Satellite Systems Overview of Currently Active Satellites / Sensors Overview of Sensor
Divergence, Spin, and Tilt. Convergence and Divergence. Midlatitude Cyclones. Large-Scale Setting
 Midlatitude Cyclones Equator-to-pole temperature gradient tilts pressure surfaces and produces westerly jets in midlatitudes Waves in the jet induce divergence and convergence aloft, leading to surface
RGB Experts and Developers Workshop - Introduction Tokyo, Japan 7-9 Nov 2017
 RGB Experts and Developers Workshop - Introduction Tokyo, Japan 7-9 Nov 2017 Workshop Objectives Review of existing RGB standards Reconfirm and extend existing standards (new multi-spectral imagers) Stimulate
MSG system over view
 MSG system over view 1 Introduction METEOSAT SECOND GENERATION Overview 2 MSG Missions and Services 3 The SEVIRI Instrument 4 The MSG Ground Segment 5 SAF Network 6 Conclusions METEOSAT SECOND GENERATION
MSG FOR NOWCASTING - EXPERIENCES OVER SOUTHERN AFRICA
 MSG FOR NOWCASTING - EXPERIENCES OVER SOUTHERN AFRICA Estelle de Coning and Marianne König South African Weather Service, Private Bag X097, Pretoria 0001, South Africa EUMETSAT, Am Kavalleriesand 31, D-64295
1. Open IDV. There is a desktop link, choose version 3.0u1 or 3.0u2. It can take a few minutes to open.
 Page 1 Objectives: Become familiar with using a software package (IDV) to view satellite images Understand the differences between Visible, IR, and Microwave Imagery Observe the influence of dry air and
The Transition of Atmospheric Infrared Sounder Total Ozone Products to Operations
 The Transition of Atmospheric Infrared Sounder Total Ozone Products to Operations Emily Berndt 1, Bradley Zavodsky 2, Gary Jedlovec 2 1 NASA Postdoctoral Program Marshall Space Flight Center, Huntsville,
Climate & Earth System Science. Introduction to Meteorology & Climate. Chapter 05 SOME OBSERVING INSTRUMENTS. Instrument Enclosure.
 Climate & Earth System Science Introduction to Meteorology & Climate MAPH 10050 Peter Lynch Peter Lynch Meteorology & Climate Centre School of Mathematical Sciences University College Dublin Meteorology
1.4 CONNECTIONS BETWEEN PV INTRUSIONS AND TROPICAL CONVECTION. Beatriz M. Funatsu* and Darryn Waugh The Johns Hopkins University, Baltimore, MD
 1.4 CONNECTIONS BETWEEN PV INTRUSIONS AND TROPICAL CONVECTION Beatriz M. Funatsu* and Darryn Waugh The Johns Hopkins University, Baltimore, MD 1. INTRODUCTION Stratospheric intrusions into the tropical
The Transfer of Heat
 The Transfer of Heat Outcomes: S2-4-03 Explain effects of heat transfer within the atmosphere and hydrosphere on the development and movement of wind and ocean currents. Coriolis Effect In our ecology
Energy: Warming the earth and Atmosphere. air temperature. Overview of the Earth s Atmosphere 9/10/2012. Composition. Chapter 3.
 Overview of the Earth s Atmosphere Composition 99% of the atmosphere is within 30km of the Earth s surface. N 2 78% and O 2 21% The percentages represent a constant amount of gas but cycles of destruction
Aviation Hazards: Thunderstorms and Deep Convection
 Aviation Hazards: Thunderstorms and Deep Convection TREND Diagnosis of thunderstorm hazards using imagery Contents Satellite imagery Visible, infrared, water vapour Basic cloud identification Identifying
Climatology of dry air intrusions and their relation to strong surface winds in extratropical cyclones
 Climatology of dry air intrusions and their relation to strong surface winds in extratropical cyclones...and intro to synoptic and meso-scale cyclone dynamics Shira Raveh-Rubin and Heini Wernli Institute
WILL CLIMATE CHANGE AFFECT CONTRAIL OCCURRENCE? JAKE GRISTEY UNIVERSITY OF READING
 WILL CLIMATE CHANGE AFFECT CONTRAIL OCCURRENCE? JAKE GRISTEY UNIVERSITY OF READING Submitted in partial fulfillment of the requirements of the degree of Master of Meteorology, Meteorology and Climate with
The Planetary Circulation System
 12 The Planetary Circulation System Learning Goals After studying this chapter, students should be able to: 1. describe and account for the global patterns of pressure, wind patterns and ocean currents
Use of potential vorticity fields, Meteosat water vapour imagery and pseudo water vapour images for evaluating numerical model behaviour
 Meteorol. Appl. 8, 57 69 (2001) Use of potential vorticity fields, Meteosat water vapour imagery and pseudo water vapour images for evaluating numerical model behaviour Christo G Georgiev, National Institute
Unit 2 Meteorology Test **Please do not write on this test** 5. El Nino & La Nina 6. Photosynthesis 7. Coriolis Effect 8.
 Matching (2 points each) 1. weather 2. climate 3. Greenhouse Effect 4. Convection Unit 2 Meteorology Test **Please do not write on this test** 5. El Nino & La Nina 6. Photosynthesis 7. Coriolis Effect
Multiscale Analyses of Inland Tropical Cyclone Midlatitude Jet Interactions: Camille (1969) and Danny (1997)
 and Danny (1997)") Multiscale Analyses of Inland Tropical Cyclone Midlatitude Jet Interactions: Camille (1969) and Danny (1997) Matthew Potter, Lance Bosart, and Daniel Keyser Department of Atmospheric and Environmental
Multiscale Analyses of Inland Tropical Cyclone Midlatitude Jet Interactions: Camille (1969) and Danny (1997) Matthew Potter, Lance Bosart, and Daniel Keyser Department of Atmospheric and Environmental
TOPICS: What are Thunderstorms? Ingredients Stages Types Lightning Downburst and Microburst
 THUNDERSTORMS TOPICS: What are Thunderstorms? Ingredients Stages Types Lightning Downburst and Microburst What are Thunderstorms? A storm produced by a cumulonimbus cloud that contains lightning and thunder
Mid-Latitude Cyclones and Fronts. Lecture 12 AOS 101
 Mid-Latitude Cyclones and Fronts Lecture 12 AOS 101 Homework 4 COLDEST TEMPS GEOSTROPHIC BALANCE Homework 4 FASTEST WINDS L Consider an air parcel rising through the atmosphere The parcel expands as it
The Impact of the Extratropical Transition of Typhoon Dale (1996) on the Early Wintertime Stratospheric Circulation
 on the Early Wintertime Stratospheric Circulation") The Impact of the Extratropical Transition of Typhoon Dale (1996) on the Early 1996-97 Wintertime Stratospheric Circulation Andrea L. Lang 1, Jason M. Cordeira 2, Lance F. Bosart 1 and Daniel Keyser 1
The Impact of the Extratropical Transition of Typhoon Dale (1996) on the Early 1996-97 Wintertime Stratospheric Circulation Andrea L. Lang 1, Jason M. Cordeira 2, Lance F. Bosart 1 and Daniel Keyser 1
Energy Systems, Structures and Processes Essential Standard: Analyze patterns of global climate change over time Learning Objective: Differentiate
 Energy Systems, Structures and Processes Essential Standard: Analyze patterns of global climate change over time Learning Objective: Differentiate between weather and climate Global Climate Focus Question
 http://www.ssec.wisc.edu/data/composites.html Red curve: Incoming solar radiation Blue curve: Outgoing infrared radiation. Three-cell model of general circulation Mid-latitudes: 30 to 60 latitude MID-LATITUDES
EasyChair Preprint. Sotirios Tsiougkos and Dimitrios Brikas. November 9, 2018
 EasyChair Preprint 616 Calculation of dynamic and thermodynamic parameters from spatial data of high spatial resolution of a weather event s specific case study event that occurred on the 16th and 17th
K32: The Structure of the Earth s Atmosphere
 K32: The Structure of the Earth s Atmosphere Chemical composition Vertical Layers Temperature structure Coriolis Force and horizontal structure Hadley Cells and Heat sources Current Molecular Composition
Mesoscale Atmospheric Systems. Surface fronts and frontogenesis. 06 March 2018 Heini Wernli. 06 March 2018 H. Wernli 1
 Mesoscale Atmospheric Systems Surface fronts and frontogenesis 06 March 2018 Heini Wernli 06 March 2018 H. Wernli 1 Temperature (degc) Frontal passage in Mainz on 26 March 2010 06 March 2018 H. Wernli
Detection and Monitoring Convective Storms by. Using MSG SEVIRI Image. Aydın Gürol ERTÜRK. Contents
 Detection and Monitoring Convective Storms by 1 Using MSG SEVIRI Image Contents MSGView Software Cold U/V and Ring Shape Storm Tops Case Study, 2nd April 2011 Antalya, Türkiye Conclusion Aydın Gürol ERTÜRK
Meteorological Satellite Image Interpretations, Part III. Acknowledgement: Dr. S. Kidder at Colorado State Univ.
 Meteorological Satellite Image Interpretations, Part III Acknowledgement: Dr. S. Kidder at Colorado State Univ. Dates EAS417 Topics Jan 30 Introduction & Matlab tutorial Feb 1 Satellite orbits & navigation
CONVECTION-ALLOWING SIMULATIONS OF COLD POOLS IN THE NORTHWESTERN SAHARA
 COSMO User Seminar, Langen, 4th March 2008 CONVECTION-ALLOWING SIMULATIONS OF COLD POOLS IN THE NORTHWESTERN SAHARA 1 Peter Knippertz, 1 Jörg Trentmann & 2 Axel Seifert 1 Institute for Atmospheric Physics,
A SEVERE WEATHER EVENT IN ROMANIA DUE TO MEDITERRANEAN CYCLONIC ACTIVITY
 A SEVERE WEATHER EVENT IN ROMANIA DUE TO MEDITERRANEAN CYCLONIC ACTIVITY Florinela Georgescu, Gabriela Bancila, Viorica Dima National Meteorological Administration, Bucharest, Romania Abstract Mediterranean
A case of Rapid Cyclogenesis over Ionian Sea on February 6 th, 2012
 Author: Kyriaki Metheniti, HNMS Showcase Title: A case of Rapid Cyclogenesis Time frame: February 6 to February 7, 2012 Study region: Eastern Mediterranean, Ionian Sea A case of Rapid Cyclogenesis over
Temperature Pressure Wind Moisture
 Chapter 1: Properties of Atmosphere Temperature Pressure Wind Moisture Thickness of the Atmosphere (from Meteorology Today) 90% 70% The thickness of the atmosphere is only about 2% of Earth s thickness
Topic # 11 HOW CLIMATE WORKS continued (Part II) pp in Class Notes
 pp in Class Notes") Topic # 11 HOW CLIMATE WORKS continued (Part II) pp 61-67 in Class Notes To drive the circulation, the initial source of energy is from the Sun: Not to scale! EARTH- SUN Relationships 4 Things to Know
Topic # 11 HOW CLIMATE WORKS continued (Part II) pp 61-67 in Class Notes To drive the circulation, the initial source of energy is from the Sun: Not to scale! EARTH- SUN Relationships 4 Things to Know
The potential impact of ozone sensitive data from MTG-IRS
 The potential impact of ozone sensitive data from MTG-IRS R. Dragani, C. Lupu, C. Peubey, and T. McNally ECMWF rossana.dragani@ecmwf.int ECMWF May 24, 2017 The MTG IRS Long-Wave InfraRed band O 3 Can the
Earth s Atmosphere. Energy Transfer in the Atmosphere. 3. All the energy from the Sun reaches Earth s surface.
 CHAPTER 11 LESSON 2 Earth s Atmosphere Energy Transfer in the Atmosphere Key Concepts How does energy transfer from the Sun to Earth and to the atmosphere? How are air circulation patterns within the atmosphere
Weather report 28 November 2017 Campinas/SP
 Weather report 28 November 2017 Campinas/SP Summary: 1) Synoptic analysis and pre-convective environment 2) Verification 1) Synoptic analysis and pre-convective environment: At 1200 UTC 28 November 2017
Derivation of AMVs from single-level retrieved MTG-IRS moisture fields
 Derivation of AMVs from single-level retrieved MTG-IRS moisture fields Laura Stewart MetOffice Reading, Meteorology Building, University of Reading, Reading, RG6 6BB Abstract The potential to derive AMVs
STATISTICAL ANALYSIS ON SEVERE CONVECTIVE WEATHER COMBINING SATELLITE, CONVENTIONAL OBSERVATION AND NCEP DATA
 12.12 STATISTICAL ANALYSIS ON SEVERE CONVECTIVE WEATHER COMBINING SATELLITE, CONVENTIONAL OBSERVATION AND NCEP DATA Zhu Yaping, Cheng Zhoujie, Liu Jianwen, Li Yaodong Institute of Aviation Meteorology
Satellites, Weather and Climate Module??: Polar Vortex
 Satellites, Weather and Climate Module??: Polar Vortex SWAC Jan 2014 AKA Circumpolar Vortex Science or Hype? Will there be one this year? Today s objectives Pre and Post exams What is the Polar Vortex
Forecasting Polar Lows. Gunnar Noer The Norwegian Meteorological Institute in Tromsø
 Forecasting Polar Lows Gunnar Noer The Norwegian Meteorological Institute in Tromsø Longyearbyen Hopen Bear Island Jan Mayen Tromsø Gunnar Noer Senior forecaster / developer for polar meteorology The Norwegian
Applications of multi-spectral satellite data
 Applications of multi-spectral satellite data Jochen Kerkmann EUMETSAT, Satellite Meteorologist, Training Officer Adjusted by E de Coning South African Weather Service Content 1. Why should we use RGBs?
THE SYNOPTIC ENVIRONMENT OF THE 11 APRIL 2001 CENTRAL PLAINS TORNADO OUTBREAK VIEWED IN THREE DIMENSIONS
 P1.1 THE SYNOPTIC ENVIRONMENT OF THE 11 APRIL 2001 CENTRAL PLAINS TORNADO OUTBREAK VIEWED IN THREE DIMENSIONS Daniel D. Nietfeld * NOAA/NWS/WFO Omaha/Valley, NE 1. INTRODUCTION A powerful low pressure
Satellite data assimilation for Numerical Weather Prediction II
 Satellite data assimilation for Numerical Weather Prediction II Niels Bormann European Centre for Medium-range Weather Forecasts (ECMWF) (with contributions from Tony McNally, Jean-Noël Thépaut, Slide
METEOROLOGY. 1 The average height of the tropopause at 50 N is about A 14 km B 16 km C 11 km D 8 km
 1 The average height of the tropopause at 50 N is about A 14 km B 16 km C 11 km D 8 km 2 In the lower part of the stratosphere the temperature A is almost constant B decreases with altitude C increases
Science 1206 Chapter 1 - Inquiring about Weather
 Science 1206 Chapter 1 - Inquiring about Weather 1.1 - The Atmosphere: Energy Transfer and Properties (pp. 10-25) Weather and the Atmosphere weather the physical conditions of the atmosphere at a specific
Lecture 14. Extratropical Cyclones extratropical cyclone
 Lecture 14. Extratropical Cyclones In mid-latitudes, much of our weather is associated with a particular kind of storm, the extratropical cyclone Cyclone: circulation around low pressure center Some midwesterners
Electromagnetic Radiation. Radiation and the Planetary Energy Balance. Electromagnetic Spectrum of the Sun
 Radiation and the Planetary Energy Balance Electromagnetic Radiation Solar radiation warms the planet Conversion of solar energy at the surface Absorption and emission by the atmosphere The greenhouse
Torben Königk Rossby Centre/ SMHI
 Fundamentals of Climate Modelling Torben Königk Rossby Centre/ SMHI Outline Introduction Why do we need models? Basic processes Radiation Atmospheric/Oceanic circulation Model basics Resolution Parameterizations
SATELLITE MONITORING OF THE CONVECTIVE STORMS
 SATELLITE MONITORING OF THE CONVECTIVE STORMS FORECASTERS POINT OF VIEW Michaela Valachová, EUMETSAT Workshop at ECMWF User Meeting Reading, 13 June 2017 Central Forecasting Office, Prague michaela.valachova@chmi.cz
2. Outline of the MRI-EPS
 2. Outline of the MRI-EPS The MRI-EPS includes BGM cycle system running on the MRI supercomputer system, which is developed by using the operational one-month forecasting system by the Climate Prediction
Impact of the 2002 stratospheric warming in the southern hemisphere on the tropical cirrus clouds and convective activity
 The Third International SOWER meeting,, Lake Shikotsu,, July 18-20, 2006 1 Impact of the 2002 stratospheric warming in the southern hemisphere on the tropical cirrus clouds and convective activity Eguchi,
Rapid cyclogenesis over Poland on 28 March 1997
 Meteorol. Appl. 6, 363 370 (1999) Rapid cyclogenesis over Poland on 28 March 1997 Jan Waclaw Parfiniewicz, Institute of Meteorology and Water Management, ul. Podleœna 61, 01 673 Warszawa, Poland A small
Air Masses of North America cp and ca air masses Air mass characterized by very cold and dry conditions
 Chapter 8: Air Masses, Fronts, and Middle-Latitude Cyclones Air masses Fronts Middle-latitude cyclones Air Masses Air mass an extremely large body of air whose properties of temperature and humidity are