Warm season forecasting! Some material adapted from Material Produced at COMET for their Residence Course in Hydrometeorology
|
|
|
- Belinda Farmer
- 6 years ago
- Views:
Transcription
1 Warm season forecasting! Some material adapted from Material Produced at COMET for their Residence Course in Hydrometeorology 1
2 Outline! Types of stability and application to forecasting! Dry and moist adiabatic processes! Skew-T Log-P diagrams, instability diagnostics! Types of hazards and techniques to forecast them! 2
3 Absolutely Stable! 3
4 Absolutely Unstable! 4
5 Conditionally Unstable! 5

6 Growth of a Thunderstorm! T env MALR DALR Towards a moist adiabatic profile 6

7 Effects of Orography! 7
8 Thermodynamic Diagrams A thermodynamic diagram is a graph that shows the relationship between five atmospheric properties: Pressure (millibars) Temperature (C) Potential temperature (C must be converted to K) Equivalent Potential Temperature (C must be converted to K) Saturation Mixing Ratio (g/kg) Since pressure rapidly decreases with altitude, thermodynamic diagrams are used most commonly to display vertical profiles of atmospheric properties, as measured with rawinsondes. Wind speed and direction are also displayed as separate variables 8
9 Thermodynamic diagrams Allow meteorologists to determine and quantify: 1) Atmospheric Stability 2) Cloud layers 3) Height of the tropopause 4) Cloud top temperatures 5) Frontal zones 6) Vertical wind shear 7) Helicity 8) Location of inversions 9) Precipitation type 10) Height of the freezing level 11) Locations of upper level fronts 9
10 Thermodynamic diagrams Emagram Tephigram Stuve Diagram Skew-T Log P diagram All express the same physical (thermodynamic) relationships All show isobars, isotherms, saturation mixing ratio lines dry adiabats, and saturation adiabats. Difference between these diagrams is the choice and orientation of the two fundamental coordinates, which can be any of the five variables or variants of them. 10


11 Skew-T/Log P Emagram T/Log P Three common diagrams used in the United States are: Stuve T, P (r/cp) The Skew-T/Log-P The Emagram The Stuve Diagram 11
12 Desirable Properties of a thermodynamic diagram: Area on diagram proportional to energy As many lines representing basic processes should be ~straight Vertical coordinate proportional to height Dry adiabats should be at near right angles to isotherms Saturation adiabats should be at large angle to dry adiabats in lower atmosphere 12
13 The Skew T-Log P diagram was selected by the Air Weather Service as the most convenient thermodynamic diagram for general use. The most commonly used diagram in the United States. Current soundings, model soundings, and archived soundings are available in Skew-T Log-P form at several websites and in analysis programs such as GARP. 13
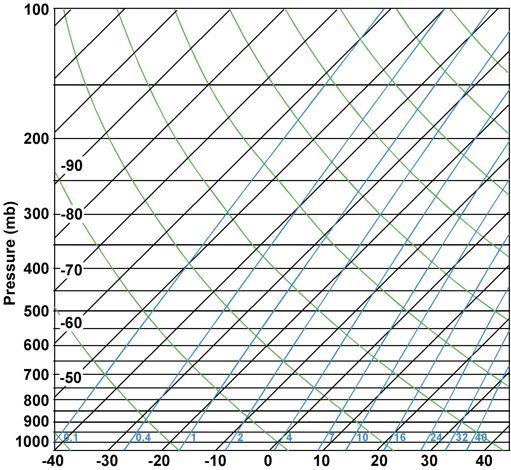
14 Pressure (mb) is the vertical coordinate on a Skew T-Log P Note that pressure is scaled logarithmically making the diagram correspond to the atmosphere 14
15 Temperature lines are skewed and labeled in Celsius 15
16 Saturation mixing ratio lines, labeled in g/kg 16
17 17
18 Dry adiabats: indicate rate of change of temperature of a parcel of air ascending or descending dry adiabatically 18
19 19
20 Saturation Adiabats: the path that a saturated air parcel follows as it rises pseudomoist-adiabatically through the atmosphere. Pseudo-moist-adiabatically: All condensed moisture immediately precipitates from parcel. Moist adiabatically: All condensed moisture remains in parcel. 20
21 21

22 Winds are plotted in standard staff/barb format on the line to the right of the diagram 22
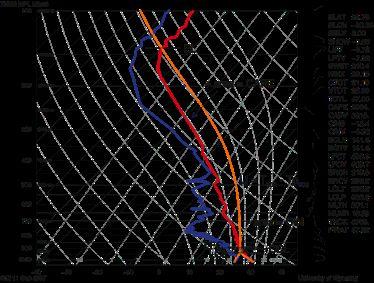
23 Temperature/Dewpoint temperature from a sounding are plotted as two lines on a Skew-T 23
24 Many other thermodynamic properties of the atmosphere can be determined from a Skew-T Log-P diagram 24
25 25
26 Mixing ratio (w): ratio of the mass of water (M v ) to the mass of dry air (M d ) in a sample of air. ON THE SKEW-T: READ VALUE, EITHER DIRECTLY OR BY INTERPOLATION, OF THE SATURATION MIXING RATIO LINE THAT CROSSES T D CURVE. Saturation mixing ratio (w s ): The mixing ratio a sample of air would have if it were saturated ON THE SKEW-T: READ VALUE, EITHER DIRECTLY OR BY INTERPOLATION, OF THE SATURATION MIXING RATIO LINE THAT CROSSES T CURVE. W = 1.5 g/kg W s = 1.8 g/kg 26
27 Relative Humidity (RH): ratio of the mixing ratio to the saturation mixing ratio! 100% (RH = w/w s! 100). W = 1.5 g/kg W s = 1.8 g/kg RH = 1.5/1.8! 100 = 83% 27
28 Vapor pressure (e): That part of the total atmospheric pressure Contributed by water vapor molecules. ON THE SKEW-T: FOLLOW THE ISOTHERM THROUGH THE DEWPOINT OF INTEREST TO THE 622 MB LEVEL. VALUE OF WS LINE IS VAPOR PRESSURE IN MB. Saturation vapor pressure (e s ): The vapor pressure a sample of air would have if it were saturated. ON THE SKEW-T: FOLLOW THE ISOTHERM THROUGH THE TEMPERATURE OF INTEREST TO THE 622 MB LEVEL. VALUE OF WS LINE IS VAPOR PRESSURE IN MB. 28

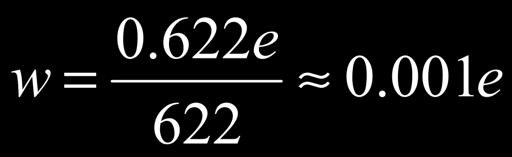

29 WHY DOES THIS WORK? From Basic Thermodynamics. Use P = 622 mb in kg/kg in g/kg 29
30 Potential Temperature ("): The temperature a parcel of air would have If it were brought dry adiabatically to a pressure of 1000 mb. ON THE SKEW-T: FOLLOW THE DRY ADIABAT TO THE 1000 MB LEVEL. VALUE OF TEMPERATURE AT 1000 MB (CONVERT TO K) IS POTENTIAL TEMPERATURE. " = = K
31 Wet Bulb Temperature (T w ): The lowest temperature to which a volume of air can be cooled at constant pressure by evaporating water into it. ON THE SKEW-T: 1) FOLLOW THE SATURATION MIXING RATIO LINE UPWARD FROM THE DEWPOINT TEMPERATURE 31
32 Wet Bulb Temperature (T w ): The lowest temperature to which a volume of air can be cooled at constant pressure by evaporating water into it. ON THE SKEW-T: 1) FOLLOW THE SATURATION MIXING RATIO LINE UPWARD FROM THE DEWPOINT TEMPERATURE 2) FOLLOW THE DRY ADIABAT UPWARD FROM THE TEMPERATURE UNTIL IT CROSSES THE FIRST LINE 32
 FOLLOW THE SATURATION MIXING RATIO LINE UPWARD FROM THE DEWPOINT TEMPERATURE 2) FOLLOW THE DRY ADIABAT UPWARD FROM THE TEMPERATURE UNTIL IT CROSSES THE FIRST LINE 3) FOLLOW THE")
33 Wet Bulb Temperature (T w ): The lowest temperature to which a volume of air can be cooled at constant pressure by evaporating water into it. ON THE SKEW-T: 1) FOLLOW THE SATURATION MIXING RATIO LINE UPWARD FROM THE DEWPOINT TEMPERATURE 2) FOLLOW THE DRY ADIABAT UPWARD FROM THE TEMPERATURE UNTIL IT CROSSES THE FIRST LINE 3) FOLLOW THE SATURATION ADIABAT DOWN TO THE ORIGINAL LEVEL. TEMPERATURE AT THIS POINT IS THE WET-BULB TEMPERATURE 33
34 Wet Bulb Potential Temperature (" w ): The wet bulb temperature a parcel of air would have if it were brought saturation adiabatically to a pressure of 1000 mb. ON THE SKEW-T: 1) FOLLOW THE SATURATION ADIABAT FROM THE WET BULB TEMPERATURE TO 1000 MB. 34
35 Equivalent Temperature (T e ): The temperature a sample of air would have if all its moisture were condensed out by a pseudo-adiabatic process (with the Latent heat of condensation heating the air sample), and the sample then brought Dry adiabatically to its original pressure. ON THE SKEW-T: 1) FOLLOW THE SATURATION MIXING RATIO LINE UPWARD 35 FROM THE DEWPOINT TEMPERATURE
36 Equivalent Temperature (T e ): The temperature a sample of air would have if all its moisture were condensed out by a pseudo-adiabatic process (with the Latent heat of condensation heating the air sample), and the sample then brought Dry adiabatically to its original pressure. 2) FOLLOW THE DRY ADIABAT UPWARD FROM THE 36 TEMPERATURE UNTIL IT CROSSES THE FIRST LINE
37 Equivalent Temperature (T e ): The temperature a sample of air would have if all its moisture were condensed out by a pseudo-adiabatic process (with the Latent heat of condensation heating the air sample), and the sample then brought Dry adiabatically to its original pressure. 3) FOLLOW THE SATURATION ADIABAT UPWARD UNTIL IT PARALLELS 37 A DRY ADIABAT
38 Equivalent Temperature (T e ): The temperature a sample of air would have if all its moisture were condensed out by a pseudo-adiabatic process (with the Latent heat of condensation heating the air sample), and the sample then brought Dry adiabatically to its original pressure. T e = = K 3) FOLLOW THE DRY ADIABAT DOWN TO THE ORIGINAL LEVEL AND READ 38 THE TEMPERATURE AT THAT LEVEL.
39 Equivalent Potential Temperature (" e ): The equivalent temperature a sample of air would have if it were compressed adiabatically to 1000 mb. " e = = K 4) FOLLOW THE DRY ADIABAT DOWN FROM EQUIVALENT TEMPERATURE 39 TO THE 1000 MB LEVEL.
40 For high levels, read the value of the dry adiabat to determine " e
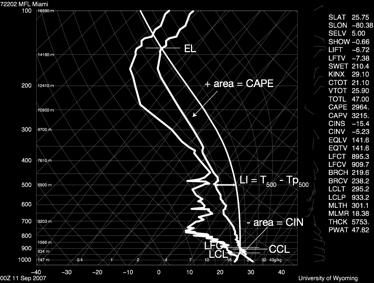
41 Skew-T Log-P Diagram (cont.)! Basic Definitions! Convective condensation level (CCL)! Height where rising parcel just becomes saturated (condensation starts) when heated to the convective temperature! Convective temperature (T c )! T that must be reached for a surface parcel to rise to CCL! Lifting condensation level (LCL)! Height where parcel becomes saturated by lifting dry-adiabatically! Level of free convection (LFC)! Height where parcel lifted dry-adiabatically until saturated, then moistadiabatically, first becomes warmer than the surrounding air! Lifted index (LI)! A measure of bulk stability of the atmosphere LI = T! 41
42 Skew-T Log-P Diagram (cont.)! Basic Definitions (cont.)! Positive area (or CAPE)! Area between the sounding and the moist adiabat that intersects the LFC, above the LFC. Proportional to the amount of energy the parcel gains from the environment.! Negative area (or CIN)! Area between the sounding and the dry adiabat that intersects the CCL, below the CCL. Proportional to the energy needed to move the parcel.! Equilibrium level (EL)! Height where the temperature of a buoyant parcel again becomes equal to the temperature of the environment.! Wet bulb zero! Height above ground where the wet bulb first reaches zero degrees Celsius. This is the level where hail will begin to melt.! 42
43 43
44 A Warm Season Forecasting Handbook THUNDERSTORMS TORNADOES STRAIGHT-LINE WINDS HAIL LIGHTNING DOWNBURSTS
45 In the first part of the course, we learned about forecasting winter weather, which is organized on the synoptic scale (with important details in the forecast on the mesoscale, and not much variation occurring on the convective scale). Now, we will focus on warm season forecasting, which often occurs on the mesoscale and convective scale, yet has the stage set by the synoptic scale. This has many important implications for forecasting: Diabatic processes become more important - diurnal cycle of radiation very strong Convection is parameterized in models, however recent increases in model resolution (i.e. WRF) helps resolve mesoscale convection. However, 11 km resolution (currently used in WRF) is still not going to resolve the convective scale (1 km or less). Also, the fact remains that even perfect models require good initialization data on the mesoscale (and that doesn t exist today). Thus, looking at the observations is key for good warm-season forecasting. Limits of predictability greatly decrease Forecasts become more probabilistic, especially beyond nowcasting (e.g. mostly sunny with a 30% chance of thunderstorms, some which may become severe and destroy your house )


")
46 ORGANIZATION OF THUNDERSTORMS Airmass Thunderstorms Cool season squall Lines Mesoscale convective systems (MCSs) Supercell Thunderstorms

47 Airmass Thunderstorms -Form within airmasses far from frontal boundaries -Low wind shear environment -Precipitation forming in upper part of storm falls into updraft. Evaporation and precipitation drag retard and eventually eliminate updraft. - Storm rains out and dissipates.


48 COOL SEASON SQUALL LINES A cool season squall line is a long line of thunderstorms in which adjacent thunderstorm cells are so close together that the heavy precipitation from the cells falls in a long continuous line. The line forms along, and remains along a synoptic scale frontal boundary, such as a cold front, upper level front, or dry line.

49 Cool season squall lines form along cold fronts, dry lines and upper level fronts and often form the tail of a cyclone s comma cloud

50 Vertical structure of a cool season squall line along a front


51 Mesoscale Convective Systems (or MCSs) Thunderstorms develop along weak boundaries, appear first as clusters or along a line, and then organize to become a system with a leading line of convection and a large trailing stratiform region.

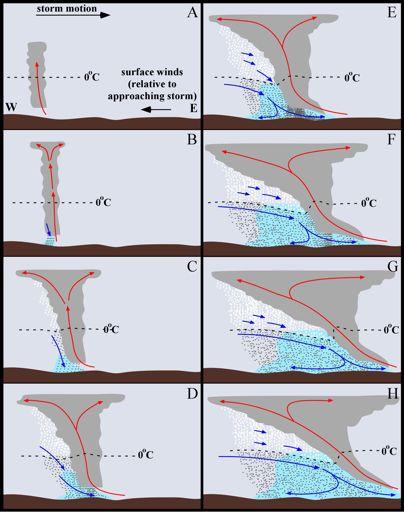
52 MCS Evolution
53


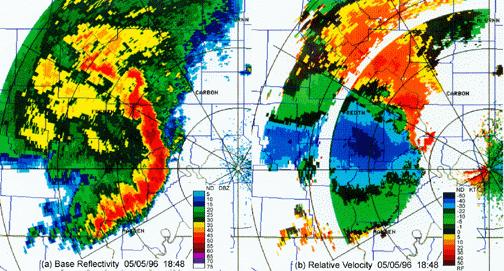
54 The bow-echo on radar is an indicator of strong straight-line winds

55 Mesoscale Convective Vortices: Long-lasting vortices aloft that result from the heating associated with a mesoscale convective system. Vortex circulations often trigger new convection the following day
56 Supercell thunderstorms: -The most intense thunderstorms in Earth s atmosphere. - Always rotate. - Account for most tornadoes, virtually all severe tornadoes, damaging straight-line winds, and most large hail. - Updrafts typically 20 to 40 meters/sec, but have been estimated to approach 50 meters/sec.

57 Supercell Thunderstorms -structure

58 Key components of supercell environment 1. Warm, moist air at in lower atmosphere. 2. Strong vertical wind shear in lowest 2-3 km, typically associated with low level jet 3. Dry air aloft, typically with a near dry-adiabatic lapse rate in the middle troposphere 4. Strong southwesterly jetstream aloft, flowing over southerly low level jet. A jetstreak is often present. 5. Frontal boundary to trigger updraft, can be dry line, cold front, upper level front, or outflow boundary from another storm.

59 Environments conducive to supercell development

60 Supercells often form along a line
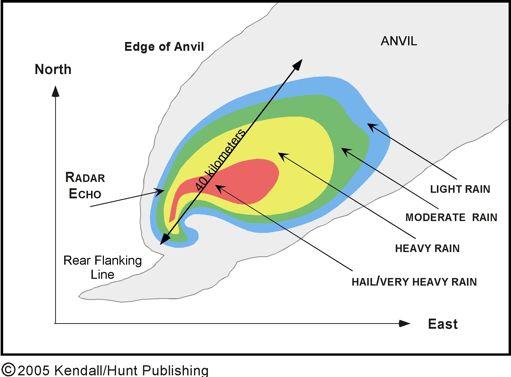
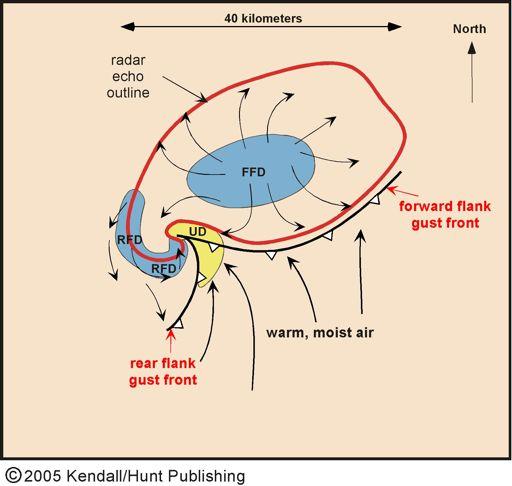
61 STRUCTURAL FEATURES OF A SUPERCELL THUNDERSTORM

62 Evolution of a Supercell Thunderstorm

63 Tornado formation mechanisms in supercells


64 Dynamic pipe effect Baroclinic generation

65 The mesocyclone and occlusion downdraft associated with a Supercell thunderstorm


66 Supercell tornadoes often occur in families, the next forming About the time that the previous tornado is dissipating

67 Non-supercell tornadoes form along squall lines characterized by strong horizontal shear

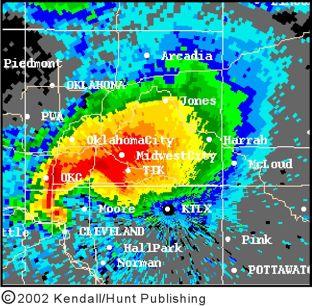
68 Detection of tornadoes with Radar: Hook Echo Radial velocity couplet in Storm relative radial velocity Field.


69 Hail in supercells falls primarily to the northeast of the rain free base associated with the updraft and along the hook echo associated with the rear flank downdraft.


70 Microbursts: Outbursts of strong wind associated with downdrafts from cumulus congestus and cumulonimbus clouds. Driven by evaporative cooling of rain below cloud base and precipitation drag.


71 Microbursts can cause damage equivalent to a weak tornado and are a hazard to aircraft during takeoff and landing

 A tornado 2) Damaging")
 Hail 1 inch* in diameter or larger.")
72 Forecasting and nowcasting severe convective storms NWS definition of a severe thunderstorm: Any thunderstorm that produces one or more of the following elements: 1) A tornado 2) Damaging winds, or winds in excess of 50 knots (58 mph) 3) Hail 1 inch* in diameter or larger. *Updated 1/5/10
73 Severe convection (generally) requires the following elements: A high degree of instability Strong vertical wind shear Sufficient moisture in the lower atmosphere A lifting mechanism, such a front, an outflow boundary, a gravity wave, or topography, to lift air to its level of free convection The key to predicting the time and location of the onset of severe convection is determining where and when these four elements will phase together most effectively. Once the convective storms have erupted, the focus shifts to short term forecasting and nowcasting determining where severe conditions exist or are likely to exist in the near future.
74 Assessing Instability 1. Maps of stability indices can be used to initially assess where the atmosphere is conditionally or potentially unstable. Examples: CAPE Lifted index K Index Showalter Index SWEAT Index Total-Totals Index 2. Once the key areas are identified, current and model soundings should be used to examine the current state and evolution of the atmosphere in the locations where instability is expected. GOAL: IDENTIFY THE REGIONS OF GREATEST THREAT


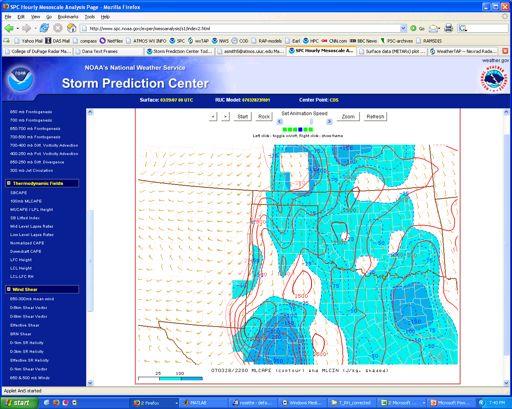
75 Examples of products available on the web: CAPE


76 A site with all the indices in convenient form is Unisys: K Index Total-totals Index Lifted Index CAPE Helicity

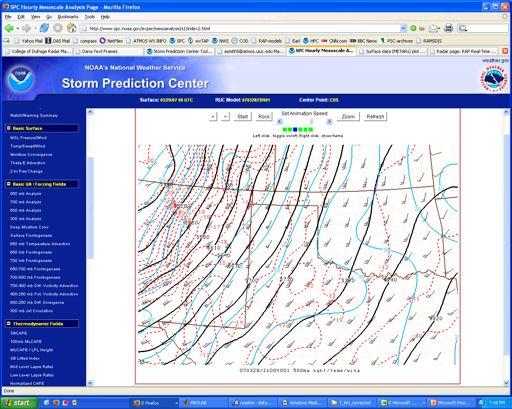
77 Model current and forecast soundings available at NIU site 0 hr 12 hr IDV and GARP plot forecast soundings. BUFKIT, which is a Windows program for analyzing soundings, is also useful for sounding analysis.
78 Instability estimated from morning (1200 UTC) soundings will be an underestimate of the actual instability that will be realized later in the day when the surface is heated by solar radiation. Morning sounding


79 As surface heats during the day, air in contact with the surface rises in thermals whenever the lapse rate exceeds the dry adiabatic lapse rate. Small cumulus may form if the air in the thermals saturate. When air heats sufficiently to trigger deep convection the surface temperature is will reach the Convective Temperature. Convective Temperature = 28 o C 7a.m. 11a.m. 3p.m. 9a.m. 1p.m.
80 On the Skew-T, each box defined by the intersection of dry adiabats with temperature = 7 Joules/kg of energy. Note boxes defined by temperature and dry adiabats ( o C) Ideal clear sky solar input of energy (J cm -2 day -1 ): Incident Ground heating Boxes Jan Feb Mar Apr May Jun Jul Aug Sep Oct Nov Dec Modifications to number of boxes For PBL heating: Overcast skies: 0.5 Broken clouds: 0.7 Scattered clouds: 0.9 Haze or moist air: 0.8 Surface moisture or water: 0.7 Ice or snow cover 0.2 Snow and overcast: 0.1 Scattered clouds, surf moist 0.6
81 Vertical Wind Shear Shear plays two important roles in severe thunderstorm generation 1. Vertical shear provides a source of horizontal vorticity that can be tilted into the vertical to produce rotating thunderstorms.

82 Vertical Wind Shear Shear plays two important roles in severe thunderstorm generation 2. Vertical shear tilts the updraft, allowing the precipitation to fall outside the updraft. Shear decouples the updraft and downdraft and allows these circulations to reinforce one-another.
83 Evaluating Wind Shear 1. Hodographs: - Polar diagram conventionally designed with north (0 ) at the bottom, south (180 ) at the top, east (90 ) to the left and west (180 ) to the right. - Distance from the center of the hodograph denotes wind speed, with rings about the center of the hodograph marking specific speeds. - Wind data from soundings are normally plotted on a hodograph at evenly spaced altitudes, for example, at 1, 2, 3 kilometers, etc. - A point is placed on the hodograph denoting the wind speed and direction at each altitude Directional shear appears as a turning line, speed shear as a long line Magnitude of shear vector = length of line segment between two altitudes/altitude difference Direction of shear vector = direction of line segment transposed to origin.
84 Boundary layer (0-500 m average) to 6 km shear vector magnitude measured in inflow air: (1992 climatology) Median 50% of all soundings 80% of all soundings Ordinary Convection Large Hail no F2 or greater Tornado F2 or Greater tornado High shear environments distinguish ordinary convection from supercells producing hail or tornadoes, but does not distinguish between supercells that produce tornadoes and those that do not. From Rasmussen and Blanchard (1998, WAF)
85 Storm-Relative Helicity: (measure of inflow of horizontal vorticity into a storm updraft -- where it can be tilted to produce rotation) h SRH = # k ( V! h " c! ) $ % V! h %z dz 0 Note that values > 200 are very likely to be associated with tornadic storms Note that values < 70 are unlikely to be associated with tornadic storms Ordinary Convection Large Hail no F2 or greater Tornado F2 or Greater tornado From Rasmussen and Blanchard (1998, WAF)
86 Mean Shear (lowest 4 km) S h " V! " z 0 = h! 0 dz dz Mean shear also distinguishes between the categories, but with a lot of overlap. Ordinary Convection Large Hail no F2 or greater Tornado F2 or Greater tornado From Rasmussen and Blanchard (1998, WAF)
87 CAPE CAPE is a reasonable predictor to separate hail producing or tornado producing supercells from ordinary thunderstorms, and with very high values (>2500), has predictive value for separating supercells that produce tornadoes from those that do not. Ordinary Convection Large Hail no F2 or greater Tornado F2 or Greater tornado From Rasmussen and Blanchard (1998, WAF)
88 Energy-Helicity Index (EHI) EHI = [ CAPE][ SRH] 1.6! 10 5 Curves are constant EHI Ordinary Convection Large Hail no F2 or greater Tornado F2 or Greater tornado The EHI is an good discriminator of ordinary convection, and large tornadic vs weak or nontornadic supercells From Rasmussen and Blanchard (1998, WAF)
89 Vorticity Generation Parameter VGP = S CAPE Called vorticity generation parameter because S, the mean shear, is related to the horizontal vorticity and (CAPE) 1/2 is related to updraft speed (which tilts the horizontal vorticity into the vertical). Ordinary Convection Large Hail no F2 or greater Tornado F2 or Greater tornado Predictive capability similar to EHI From Rasmussen and Blanchard (1998, WAF)
90 The shear/cape combinations are useful for forecasting severe convection, but still result in a high false alarm rate. Nevertheless, these represent one way to determine the areas that are more likely to experience severe storms.
91 Boundaries focal points for storm initiation Boundaries between airmasses, both on the synoptic and mesoscale, are nearly always associated with triggering of convection. Detection and monitoring boundaries, in conjunction with CAPE, Shear and other parameters, allows a forecaster to focus on the most threatened regions for severe storms to develop Surface-based frontal boundaries can be tracked using surface data Look for strong gradients in temperature and dewpoint, a trough in the pressure field, and wind shifts.


92 Advanced techniques for identifying boundaries: NEXRAD RADAR: Look for a fine line of higher reflectivity In the clear air echo, or fine lines ahead of existing thunderstorms That indicate a gust front. FINE LINE

93 Profiler winds: Look for wind shifts associated with passing boundaries Courtesy of Kevin Knupp

94 Intersecting Boundaries: Focal points for convection (see loop) Outflow Outflow New storm triggered At outflow boundary intersection Sea breeze boundary


95 Look for dark filaments on water vapor images. The leading edge of these filaments are often associated with middle or upper tropospheric fronts. When filament moves over a potentially unstable region, convection may trigger.


96 Moisture Moisture Moisture Convergence High dewpoint temperatures " q v! V ( ) #10 5 (approximately g/kg/day)

97 The key to forecasting convection is to determine where these four important quantities converge

98 SPC PRODUCTS (Day 1, Day 2, Day 3 outlooks for severe weather) Risk of Severe Convection.
99 SPC PRODUCTS (Day 1, Day 2, Day 3 outlooks for severe weather) Hail probability and large hail probability
100 SPC PRODUCTS (Day 1, Day 2, Day 3 outlooks for severe weather)

101 SPC PRODUCTS (Day 1, Day 2, Day 3 outlooks for severe weather)

102 SPC: Watches and warnings
103
104
105
106
107
108
109
110
111
Chapter 14 Thunderstorm Fundamentals
 Chapter overview: Thunderstorm appearance Thunderstorm cells and evolution Thunderstorm types and organization o Single cell thunderstorms o Multicell thunderstorms o Orographic thunderstorms o Severe
Practical Use of the Skew-T, log-p diagram for weather forecasting. Primer on organized convection
 Practical Use of the Skew-T, log-p diagram for weather forecasting Primer on organized convection Outline Rationale and format of the skew-t, log-p diagram Some basic derived diagnostic measures Characterizing
Solutions to Comprehensive Final Examination Given on Thursday, 13 December 2001
 Name & Signature Dr. Droegemeier Student ID Meteorology 1004 Introduction to Meteorology Fall, 2001 Solutions to Comprehensive Final Examination Given on Thursday, 13 December 2001 BEFORE YOU BEGIN!! Please
TOPICS: What are Thunderstorms? Ingredients Stages Types Lightning Downburst and Microburst
 THUNDERSTORMS TOPICS: What are Thunderstorms? Ingredients Stages Types Lightning Downburst and Microburst What are Thunderstorms? A storm produced by a cumulonimbus cloud that contains lightning and thunder
Tornadogenesis in Supercells: The Three Main Ingredients. Ted Funk
 Tornadogenesis in Supercells: The Three Main Ingredients Ted Funk NWS Louisville, KY Spring 2002 Environmental Parameters Supercells occur within environments exhibiting several wellknown characteristics
Tornadoes forecasting, dynamics and genesis. Mteor 417 Iowa State University Week 12 Bill Gallus
 Tornadoes forecasting, dynamics and genesis Mteor 417 Iowa State University Week 12 Bill Gallus Tools to diagnose severe weather risks Definition of tornado: A vortex (rapidly rotating column of air) associated
Page 1. Name:
 Name: 1) As the difference between the dewpoint temperature and the air temperature decreases, the probability of precipitation increases remains the same decreases 2) Which statement best explains why
Thunderstorm: a cumulonimbus cloud or collection of cumulonimbus clouds featuring vigorous updrafts, precipitation and lightning
 Thunderstorm: a cumulonimbus cloud or collection of cumulonimbus clouds featuring vigorous updrafts, precipitation and lightning Thunderstorm: a cumulonimbus cloud or collection of cumulonimbus clouds
Tornadoes forecasting, dynamics and genesis. Mteor 417 Iowa State University Week 12 Bill Gallus
 Tornadoes forecasting, dynamics and genesis Mteor 417 Iowa State University Week 12 Bill Gallus Tools to diagnose severe weather risks Definition of tornado: A vortex (rapidly rotating column of air) associated
1 of 7 Thunderstorm Notes by Paul Sirvatka College of DuPage Meteorology. Thunderstorms
 1 of 7 Thunderstorm Notes by Paul Sirvatka College of DuPage Meteorology Thunderstorms There are three types of thunderstorms: single-cell (or air mass) multicell (cluster or squall line) supercell Although
Test Form: A Key Final Exam: Spring 2011
 Test Form: A Key Final Exam: Spring 2011 Instructions: Write your name (last name and first name) on your bubble sheet. Write your student identification number on the bubble sheet, and carefully and completely
Science Olympiad Meteorology Quiz #2 Page 1 of 8
 1) The prevailing general direction of the jet stream is from west to east in the northern hemisphere: 2) Advection is the vertical movement of an air mass from one location to another: 3) Thunderstorms
Charles A. Doswell III, Harold E. Brooks, and Robert A. Maddox
 Charles A. Doswell III, Harold E. Brooks, and Robert A. Maddox Flash floods account for the greatest number of fatalities among convective storm-related events but it still remains difficult to forecast
Chapter 8 cont. Clouds and Storms. Spring 2018
 Chapter 8 cont. Clouds and Storms Spring 2018 Clouds and Storms Clouds cover ~ 50% of earth at any time. Clouds are linked to a number of condensation processes. Cloud morphology, cloud types, associated
Weather Systems III: Thunderstorms and Twisters
 Weather Systems III: Thunderstorms and Twisters Review 1. Definition of airmasses? Bergeron classification of air masses 2. Surface weather analysis: Station model, wind speed code, present weather 3.
contact with ground for 1 hour plus, starting 1500 MDT moved N., covered about 37 km width varied m
 Goal for today: Finish Ch. 11 Lightning, Thunder & Tornadoes 16 Nov., 2011 Edmonton tornado 31 July 1987 contact with ground for 1 hour plus, starting 1500 MDT moved N., covered about 37 km width varied
Thunderstorm: a cumulonimbus cloud or collection of cumulonimbus clouds featuring vigorous updrafts, precipitation and lightning
 Thunderstorm: a cumulonimbus cloud or collection of cumulonimbus clouds featuring vigorous updrafts, precipitation and lightning Thunderstorms are responsible for most of what we refer to as severe weather,
Chapter 8 cont. Clouds and Storms
 Chapter 8 cont. Clouds and Storms Spring 2007 Clouds and Storms Clouds cover ~ 50% of earth at any time. Clouds are linked to a number of condensation processes. Cloud morphology, cloud types, associated
Department of Geosciences San Francisco State University Spring Metr 201 Monteverdi Quiz #5 Key (100 points)
") Department of Geosciences Name San Francisco State University Spring 2012 Metr 201 Monteverdi Quiz #5 Key (100 points) 1. Fill in the Blank or short definition. (3 points each for a total of 15 points)
Department of Geosciences Name San Francisco State University Spring 2012 Metr 201 Monteverdi Quiz #5 Key (100 points) 1. Fill in the Blank or short definition. (3 points each for a total of 15 points)
Advanced Spotter Training Lesson 4: The Nature of Thunderstorms
 Advanced Spotter Training 2009 Lesson 4: The Nature of Thunderstorms From Last Time We discussed the different ways to make air rise. We discussed convection, convergence, and the different kinds of fronts.
Science Olympiad Meteorology Quiz #1 Page 1 of 7
 1) What is generally true about the stratosphere: a) Has turbulent updrafts and downdrafts. b) Has either a stable or increasing temperature profile with altitude. c) Where the auroras occur. d) Both a)
MET Lecture 34 Downbursts
 MET 4300 Lecture 34 Downbursts Downbursts A strong downdraft that originates within the lower part of a cumulus cloud or thunderstorms and spreads out at the surface Downbursts do not require strong thunderstorms
SEVERE AND UNUSUAL WEATHER
 SEVERE AND UNUSUAL WEATHER Basic Meteorological Terminology Adiabatic - Referring to a process without the addition or removal of heat. A temperature change may come about as a result of a change in the
Reading. What meteorological conditions precede a thunderstorm? Thunderstorms: ordinary or single cell storms, multicell storms, supercell storms
 Thunderstorms: ordinary or single cell storms, multicell storms, supercell storms Reading Ahrens, Chapter 14: Thunderstorms and Tornadoes This lecture + next (Lightning, tornadoes) will cover the topic.
Severe Thunderstorms
 Lecture 26 Severe Thunderstorms NWS Criteria Environment Structure Climatology 1 Severe Thunderstorms NWS Criteria Environment Structure Climatology 2 Severe Thunderstorms: NWS Criteria NWS Criteria: to
Severe Thunderstorm Forecasting and Climatology in Arizona. Ken Drozd Warning Coordination Meteorologist NOAA/NWS Tucson, AZ
 Severe Thunderstorm Forecasting and Climatology in Arizona Ken Drozd Warning Coordination Meteorologist NOAA/NWS Tucson, AZ THUNDERSTORM FORMATION All thunderstorms result from the same necessary conditions
10/21/2012. Chapter 10 Thunderstorms. Part II. Growth and Development of ordinary Cell Thunderstorms Thunderstorm Electrification.
 Chapter 10 Thunderstorms Part I Growth and Development of ordinary Cell Thunderstorms Thunderstorm Electrification Tornadoes Part II Simplified model depicting the life cycle of an ordinary thunderstorm
DEPARTMENT OF EARTH & CLIMATE SCIENCES NAME SAN FRANCISCO STATE UNIVERSITY Fall ERTH FINAL EXAMINATION KEY 200 pts
 DEPARTMENT OF EARTH & CLIMATE SCIENCES NAME SAN FRANCISCO STATE UNIVERSITY Fall 2016 Part 1. Weather Map Interpretation ERTH 365.02 FINAL EXAMINATION KEY 200 pts Questions 1 through 9 refer to Figure 1,
Chapter 3 Convective Dynamics 3.4. Bright Bands, Bow Echoes and Mesoscale Convective Complexes
 Chapter 3 Convective Dynamics 3.4. Bright Bands, Bow Echoes and Mesoscale Convective Complexes Photographs Todd Lindley Bright band associated with stratiform precipitation in a squall line system 1 Bright
HAZARDOUS WEATHER 1. Dr. Julie Laity Geography 266
 HAZARDOUS WEATHER 1 Dr. Julie Laity Geography 266 Violent Weather Thunderstorms Atmospheric turbulence Lightning and thunder Hail Derechos Tornadoes Tornado measurement and science Tropical Cyclones Hurricanes
INTRODUCTION TO METEOROLOGY PART ONE SC 213 MAY 21, 2014 JOHN BUSH
 INTRODUCTION TO METEOROLOGY PART ONE SC 213 MAY 21, 2014 JOHN BUSH WEATHER PATTERNS Extratropical cyclones (low pressure core) and anticyclones (high pressure core) Cold fronts and warm fronts Jet stream
WEATHER THEORY. Weather Theory Page 100 Aviation Seminars. Measurement Of Temperature, Pressure And Moisture. Stability (Cont)
") Weather Theory Page 100 WEATHER THEORY Measurement Of Temperature, Pressure And Moisture The primary cause of all changes in the earth s weather is variation of solar energy received by the Earth s regions..
Weather Theory Page 100 WEATHER THEORY Measurement Of Temperature, Pressure And Moisture The primary cause of all changes in the earth s weather is variation of solar energy received by the Earth s regions..
Thunderstorms. Ordinary Cell Thunderstorms. Ordinary Cell Thunderstorms. Ordinary Cell Thunderstorms 5/2/11
 A storm containing lightning and thunder; convective storms Chapter 14 Severe thunderstorms: At least one: large hail wind gusts greater than or equal to 50 kt Tornado 1 2 Ordinary Cell Ordinary Cell AKA
Answers to Clicker Questions
 Answers to Clicker Questions Chapter 1 What component of the atmosphere is most important to weather? A. Nitrogen B. Oxygen C. Carbon dioxide D. Ozone E. Water What location would have the lowest surface
The Earth System - Atmosphere III Convection
 The Earth System - Atmosphere III Convection Thunderstorms 1. A thunderstorm is a storm that produces lightning (and therefore thunder) 2. Thunderstorms frequently produce gusty winds, heavy rain, and
CLOUDS & THUNDERSTORMS
 Funding provided by NOAA Sectoral Applications Research Project CLOUDS & THUNDERSTORMS Basic Climatology Oklahoma Climatological Survey How are clouds made? Clouds form when air is cooled to its dewpoint
Final Exam Clicker Questions ATOC 1050 Spring 2011 Chapter 16: Mountain Snowstorms
 Final Exam Clicker Questions ATOC 1050 Spring 2011 Chapter 16: Mountain Snowstorms True or false: Mean annual snowfall in the western United States always increases from south to north. Total precipitation
Department of Earth & Climate Sciences Spring 2016 Meteorology 260
 Department of Earth & Climate Sciences Spring 2016 Meteorology 260 Name Laboratory #9 Key: Joplin Tornado Day Subsynoptic, Thermodynamic, and Wind Shear Setting Part A: 1600 UTC Surface Chart Subsynoptic
Thunderstorms and Severe Weather. (Chapt 15)
") Thunderstorms and Severe Weather (Chapt 15) The Big Picture We ve emphasized horizontal transport of energy to balance the planetary energy budget: Hadley Cell Subtropical divergence Midlatitude cyclones
Thunderstorms and Severe Weather (Chapt 15) The Big Picture We ve emphasized horizontal transport of energy to balance the planetary energy budget: Hadley Cell Subtropical divergence Midlatitude cyclones
Anthony A. Rockwood Robert A. Maddox
 Anthony A. Rockwood Robert A. Maddox An unusually intense MCS produced large hail and wind damage in northeast Kansas and northern Missouri during the predawn hours of June 7 th, 1982. Takes a look at
Chapter 3 Convective Dynamics Part V ñ Bright Bands, Bow Echoes and MCCs. Bright band associated with stratiform precipitation in a squall line system
 Chapter 3 Convective Dynamics Part V ñ Bright Bands, Bow Echoes and MCCs Photographs Todd Lindley (This part contains materials taken from UCAR MCS training module) Bright band associated with stratiform
Weather - is the state of the atmosphere at a specific time & place
 Weather Section 1 Weather - is the state of the atmosphere at a specific time & place Includes such conditions as air pressure, wind, temperature, and moisture in the air The Sun s heat evaporates water
DEPARTMENT OF EARTH & CLIMATE SCIENCES SAN FRANCISCO STATE UNIVERSITY EARTH 365. Fall 2018 Test #2. November :00pm 7:15pm
 1 DEPARTMENT OF EARTH & CLIMATE SCIENCES SAN FRANCISCO STATE UNIVERSITY EARTH 365 Fall 2018 Test #2 November 6 2018 6:00pm 7:15pm 200 points (4 points each answer) Answer on the answer sheet provided.
CHAPTER 11 THUNDERSTORMS AND TORNADOES MULTIPLE CHOICE QUESTIONS
 CHAPTER 11 THUNDERSTORMS AND TORNADOES MULTIPLE CHOICE QUESTIONS 1. A thunderstorm is considered to be a weather system. a. synoptic-scale b. micro-scale c. meso-scale 2. By convention, the mature stage
Type of storm viewed by Spotter A Ordinary, multi-cell thunderstorm. Type of storm viewed by Spotter B Supecell thunderstorm
 ANSWER KEY Part I: Locating Geographical Features 1. The National Weather Service s Storm Prediction Center (www.spc.noaa.gov) has issued a tornado watch on a warm spring day. The watch covers a large
Foundations of Earth Science, 6e Lutgens, Tarbuck, & Tasa
 Foundations of Earth Science, 6e Lutgens, Tarbuck, & Tasa Weather Patterns and Severe Weather Foundations, 6e - Chapter 14 Stan Hatfield Southwestern Illinois College Air masses Characteristics Large body
Lightning. lightning: an electrical discharge in the atmosphere. Electricity. Lightning, Thunder and Tornados PHYS 189. Electricity.
 , lightning: an electrical discharge in the atmosphere (), week 12 1 / 40 , lightning: an electrical discharge in the atmosphere cloud-to-cloud (80%) cloud-to-ground (20%) (), week 12 1 / 40 Fundamentals
Feel free to ask me if you are confused about the meaning of any question. Good luck, and have a great spring break!
 Name: _ MEA 214 Midterm Exam, Spring 2011 Feel free to ask me if you are confused about the meaning of any question. Good luck, and have a great spring break! 1.) For each of the characteristics listed
Mid-Latitude Cyclones and Fronts. Lecture 12 AOS 101
 Mid-Latitude Cyclones and Fronts Lecture 12 AOS 101 Homework 4 COLDEST TEMPS GEOSTROPHIC BALANCE Homework 4 FASTEST WINDS L Consider an air parcel rising through the atmosphere The parcel expands as it
The Oakfield, Wisconsin, Tornado from July Brett Berenz Student at the University of Wisconsin
 The Oakfield, Wisconsin, Tornado from 18-19 July 1996 Brett Berenz Student at the University of Wisconsin Abstract On July 18 th, 1996 an F5 tornado affected the region of Oakfield, Wisconsin. Leading
Clouds and turbulent moist convection
 Clouds and turbulent moist convection Lecture 2: Cloud formation and Physics Caroline Muller Les Houches summer school Lectures Outline : Cloud fundamentals - global distribution, types, visualization
Examination #3 Wednesday, 28 November 2001
 Name & Signature Dr. Droegemeier Student ID Meteorology 1004 Introduction to Meteorology Fall, 2001 Examination #3 Wednesday, 28 November 2001 BEFORE YOU BEGIN!! Please be sure to read each question CAREFULLY
April 13, 2006: Analysis of the Severe Thunderstorms that produced Hail in Southern Wisconsin
 April 13, 2006: Analysis of the Severe Thunderstorms that produced Hail in Southern Wisconsin Danielle Triolo UW Madison Undergraduate 453 Case Study May 5, 2009 ABSTRACT On April 13, 2006 the states of
Chapter 3 Convective Dynamics
 Chapter 3 Convective Dynamics Photographs Todd Lindley 3.2 Ordinary or "air-mass storm 3.2.1. Main Characteristics Consists of a single cell (updraft/downdraft pair) Forms in environment characterized
Meteorology Lecture 18
 Meteorology Lecture 18 Robert Fovell rfovell@albany.edu 1 Important notes These slides show some figures and videos prepared by Robert G. Fovell (RGF) for his Meteorology course, published by The Great
MET Lecture 29 Tornadoes IV
 MET 4300 Lecture 29 Tornadoes IV Outline Definition, life cycle, & climatology of tornadoes Tornado formation within supercells Tornado formation within nonsupercell thunderstorms Fujita scale Tornado
p = ρrt p = ρr d = T( q v ) dp dz = ρg
 dp dz = ρg") Chapter 1: Properties of the Atmosphere What are the major chemical components of the atmosphere? Atmospheric Layers and their major characteristics: Troposphere, Stratosphere Mesosphere, Thermosphere
Chapter 1: Properties of the Atmosphere What are the major chemical components of the atmosphere? Atmospheric Layers and their major characteristics: Troposphere, Stratosphere Mesosphere, Thermosphere
Convective Dynamics. Jeremy A. Gibbs. March 3, University of Oklahoma
 Convective Dynamics Jeremy A. Gibbs University of Oklahoma gibbz@ou.edu March 3, 2015 1 / 70 Overview Administrative Homework 2 Exam 1 Convective Dynamics Introduction to Thunderstorms/Moist Atm. Convection
MET Lecture 26 Tornadoes I
 MET 4300 Lecture 26 Tornadoes I A Large Tornado approaches Lyndon, Kansas, on May 8, 2003 Outline Definition, life cycle Tornado formation within supercells Tornado formation within nonsupercell thunderstorms
1. Which weather map symbol is associated with extremely low air pressure? A) B) C) D) 2. The diagram below represents a weather instrument.
 B) C) D) 2. The diagram below represents a weather instrument.") 1. Which weather map symbol is associated with extremely low air pressure? 2. The diagram below represents a weather instrument. Which weather variable was this instrument designed to measure? A) air pressure
1. Which weather map symbol is associated with extremely low air pressure? 2. The diagram below represents a weather instrument. Which weather variable was this instrument designed to measure? A) air pressure
Severe Thunderstorms. MET 200 Lecture 24 Flooding in Hawaii and Intro to Severe Thunderstorms. MET 200 Lecture 24 Severe Thunderstorms.
 MET 200 Lecture 24 Severe Thunderstorms Damage Swath 1 2 MET 200 Lecture 24 Flooding in Hawaii and Intro to Severe Thunderstorms Severe Thunderstorms Kona Lows Cause more flash floods in Hawaii than any
Jonathan M. Davies* Private Meteorologist, Wichita, Kansas
 4.3 RUC Soundings with Cool Season Tornadoes in Small CAPE Settings and the 6 November 2005 Evansville, Indiana Tornado Jonathan M. Davies* Private Meteorologist, Wichita, Kansas 1. Introduction Several
Inner core dynamics: Eyewall Replacement and hot towers
 Inner core dynamics: Eyewall Replacement and hot towers FIU Undergraduate Hurricane Internship Lecture 4 8/13/2012 Why inner core dynamics is important? Current TC intensity and structure forecasts contain
Aviation Hazards: Thunderstorms and Deep Convection
 Aviation Hazards: Thunderstorms and Deep Convection TREND Empirical thunderstorm forecasting techniques Contents Necessary conditions for convection: Instability Low-level moisture Trigger mechanism Forecasting
Chapter 3 Convective Dynamics Part VI. Supercell Storms. Supercell Photos
 Chapter 3 Convective Dynamics Part VI. Supercell Storms Photographs Todd Lindley (This part contains materials taken from UCAR MCS training module) Supercell Photos 1 Introduction A supercel storm is defined
Kenneth L. Pryor* and Gary P. Ellrod Center for Satellite Applications and Research (NOAA/NESDIS) Camp Springs, MD
 Camp Springs, MD") P1.57 GOES WMSI PROGRESS AND DEVELOPMENTS Kenneth L. Pryor* and Gary P. Ellrod Center for Satellite Applications and Research (NOAA/NESDIS) Camp Springs, MD 1. INTRODUCTION A multi-parameter index has
P1.57 GOES WMSI PROGRESS AND DEVELOPMENTS Kenneth L. Pryor* and Gary P. Ellrod Center for Satellite Applications and Research (NOAA/NESDIS) Camp Springs, MD 1. INTRODUCTION A multi-parameter index has
Section 13-1: Thunderstorms
 Section 13-1: Thunderstorms Chapter 13 Main Idea: The intensity and duration of thunderstorms depend on the local conditions that create them. Air-mass thunderstorm Mountain thunderstorm Sea-breeze thunderstorm
Chapter The transition from water vapor to liquid water is called. a. condensation b. evaporation c. sublimation d.
 Chapter-6 Multiple Choice Questions 1. The transition from water vapor to liquid water is called. a. condensation b. evaporation c. sublimation d. deposition 2. The movement of water among the great global
A more detailed and quantitative consideration of organized convection: Part I Cold pool dynamics and the formation of squall lines
 A more detailed and quantitative consideration of organized convection: Part I Cold pool dynamics and the formation of squall lines Note: Lecture notes presented here based on course Daily Weather Laboratory
NOAA S National Weather Service
 NOAA S National Weather Service Night Spotting Advanced Concepts of Severe Storm Spotting 2012 Rusty Kapela Milwaukee/Sullivan Weather.gov/milwaukee Problems Spotters Encounter Spotters can only see a
5.0 WHAT IS THE FUTURE ( ) WEATHER EXPECTED TO BE?
 WEATHER EXPECTED TO BE?") 5.0 WHAT IS THE FUTURE (2040-2049) WEATHER EXPECTED TO BE? This chapter presents some illustrative results for one station, Pearson Airport, extracted from the hour-by-hour simulations of the future period
5.0 WHAT IS THE FUTURE (2040-2049) WEATHER EXPECTED TO BE? This chapter presents some illustrative results for one station, Pearson Airport, extracted from the hour-by-hour simulations of the future period
Shear-Parallel Mesoscale Convective Systems in a Moist Low- Inhibition Mei-Yu Front Environment. Liu and Moncrieff (2017 JAS)
") Shear-Parallel Mesoscale Convective Systems in a Moist Low- Inhibition Mei-Yu Front Environment Liu and Moncrieff (2017 JAS) Introduction Balance of lower-tropospheric wind shear and strength of evaporation-generated
Shear-Parallel Mesoscale Convective Systems in a Moist Low- Inhibition Mei-Yu Front Environment Liu and Moncrieff (2017 JAS) Introduction Balance of lower-tropospheric wind shear and strength of evaporation-generated
Meteorology Lecture 19
 Meteorology Lecture 19 Robert Fovell rfovell@albany.edu 1 Important notes These slides show some figures and videos prepared by Robert G. Fovell (RGF) for his Meteorology course, published by The Great
Department of Earth & Climate Sciences Spring 2016 Meteorology 260
 Department of Earth & Climate Sciences Spring 2016 Meteorology 260 Name Laboratory #9: Joplin Tornado Day Subsynoptic, Thermodynamic, and Wind Shear Setting Part A: 1600 UTC Surface Chart Subsynoptic Analyses
Atmospheric Moisture, Precipitation, and Weather Systems
 Atmospheric Moisture, Precipitation, and Weather Systems 6 Chapter Overview The atmosphere is a complex system, sometimes described as chaotic in nature. In this chapter we examine one of the principal
1., annual precipitation is greater than annual evapotranspiration. a. On the ocean *b. On the continents
 CHAPTER 6 HUMIDITY, SATURATION, AND STABILITY MULTIPLE CHOICE QUESTIONS 1., annual precipitation is greater than annual evapotranspiration. a. On the ocean *b. On the continents 2., annual precipitation
Precipitation AOSC 200 Tim Canty. Cloud Development: Orographic Lifting
 Precipitation AOSC 200 Tim Canty Class Web Site: http://www.atmos.umd.edu/~tcanty/aosc200 Topics for today: Precipitation formation Rain Ice Lecture 14 Oct 11 2018 1 Cloud Development: Orographic Lifting
ATS 351, Spring 2010 Lab #11 Severe Weather 54 points
 ATS 351, Spring 2010 Lab #11 Severe Weather 54 points Question 1 (10 points): Thunderstorm development a) Sketch and describe the stages of development of a single cell thunderstorm. About how long does
The Jarrell Tornado of May 27, 1997
 The Jarrell Tornado of May 27, 1997 ANDREW MANKOWSKI University of Wisconsin Madison Atmospheric and Oceanic Sciences ABSTRACT A tornado outbreak occurred over Central Texas on May 27, 1997. This outbreak
Tornado Occurrences. Tornadoes. Tornado Life Cycle 4/12/17
 Chapter 19 Tornadoes Tornado Violently rotating column of air that extends from the base of a thunderstorm to the ground Tornado Statistics Over (100, 1000, 10000) tornadoes reported in the U.S. every
Synoptic Meteorology I: Skew-T Diagrams and Thermodynamic Properties
 Synoptic Meteorology I: Skew-T Diagrams and Thermodynamic Properties For Further Reading Most information contained within these lecture notes is drawn from Chapters 1, 2, 4, and 6 of The Use of the Skew
Proximity sounding analysis for derechos and supercells: an assessment of similarities and differences
 Atmospheric Research 67 68 (2003) 117 133 www.elsevier.com/locate/atmos Proximity sounding analysis for derechos and supercells: an assessment of similarities and differences Charles A. Doswell III a,
Air Mass Thunderstorms. Air Mass Thunderstorms. Air Mass Thunderstorms. Lecture 26 Air Mass Thunderstorms and Lightning
 Lecture 26 and Lightning Life Cycle Environment Climatology Lightning 1 2 Short-lived, isolated thunderstorms that are not severe are often called air-mass thunderstorms. There are three stages describing
Meteorology. I. The Atmosphere - the thin envelope of gas that surrounds the earth.
 Meteorology I. The Atmosphere - the thin envelope of gas that surrounds the earth. A. Atmospheric Structure - the atmosphere is divided into five distinct layers that are based on their unique characteristics.
WEATHER THEORY. Stability. In general:
 Weather Theory 69 Temperature, Pressure And Moisture WEATHER THEORY Pressure Systems (Cont) Every physical process of weather is a result of a heat exchange. The standard sea level temperature is 15 degrees
Monteverdi Metr 201 Quiz #4 100 pts.
 DEPARTMENT OF GEOSCIENCES Name San Francisco State University April 27, 2012 Monteverdi Metr 201 Quiz #4 100 pts. A. Definitions. (5 points each for a total of 25 points in this section). (a) Convective
Advanced Spotter Training: Anticipating Severe Weather Threats. Professor Paul Sirvatka College of DuPage Meteorology
 Advanced Spotter Training: Anticipating Severe Weather Threats College of DuPage Meteorology Preparing for Severe Weather Preparedness involves understanding the probable and potential threats. Understanding
Copyright 2015 Edmentum All rights reserved.
 Copyright 2015 Edmentum All rights reserved. weather 1 1. Sharon woke up on a sunny morning and ate breakfast. Then she looked outside and saw tall, quickly forming clouds. The clouds looked ready to rain.
Boundary-layer Decoupling Affects on Tornadoes
 Boundary-layer Decoupling Affects on Tornadoes Chris Karstens ABSTRACT The North American low-level jet is known to have substantial impacts on the climatology of central and eastern regions of the United
The atmosphere s water
 The atmosphere s water Atmospheric Moisture and Precipitation Properties of Water The Hydrosphere and the Hydrologic Cycle Humidity The Adiabatic Process Clouds Precipitation Air Quality Main points for
Marine Weather Primer
 1 of 73 Marine Weather Primer Mark A. Thornton LakeErieWX: Marine Weather Education and Forecasting Resources Mark@LakeErieWX.com 2 of 73 3 of 73 Marine Weather Seminars & Workshops Learn a little meteorology
Tuesday, September 13, 16
 Weather Weather State Objectives 4.c, 4.d, 4.h. Discussion What are some ways in which weather affects your everyday life? Discussion What are some ways in which weather affects your everyday life? What
3. As warm, moist air moves into a region, barometric pressure readings in the region will generally 1. decrease 2. increase 3.
 Teacher: Mr. Prizzi Castle Learning Review 1 1. Which process most directly results in cloud formation? 1. condensation 3. precipitation 2. transpiration 4. radiation 2. An air mass originating over north
Glider Flying Handbook FAA-H ADDENDUM December 1, 2003
 Glider Flying Handbook FAA-H-8083-13 ADDENDUM December 1, 2003 The Airman Testing Standards Branch (AFS-630) is responsible for the development and publication of the Glider Flying Handbook. We would like
MEA 214 Midterm Exam, Spring 2008 Tuesday 26 February
 MEA 214 Midterm Exam, Spring 2008 Tuesday 26 February Name: As usual, feel free to ask me if you are confused about the meaning of any question. Good luck, and have a great spring break! Don t forget that
Tornadoes. tornado: a violently rotating column of air
 Tornadoes tornado: a violently rotating column of air Tornadoes What is the typical size of a tornado? What are typical wind speeds for a tornado? Five-stage life cycle of a tornado Dust Swirl Stage Tornado
9D.3 THE INFLUENCE OF VERTICAL WIND SHEAR ON DEEP CONVECTION IN THE TROPICS
 9D.3 THE INFLUENCE OF VERTICAL WIND SHEAR ON DEEP CONVECTION IN THE TROPICS Ulrike Wissmeier, Robert Goler University of Munich, Germany 1 Introduction One does not associate severe storms with the tropics
Thunderstorm Downburst Prediction: An Integrated Remote Sensing Approach. Ken Pryor Center for Satellite Applications and Research (NOAA/NESDIS)
") Thunderstorm Downburst Prediction: An Integrated Remote Sensing Approach Ken Pryor Center for Satellite Applications and Research (NOAA/NESDIS) Topics of Discussion Thunderstorm Life Cycle Thunderstorm
Thunderstorm Downburst Prediction: An Integrated Remote Sensing Approach Ken Pryor Center for Satellite Applications and Research (NOAA/NESDIS) Topics of Discussion Thunderstorm Life Cycle Thunderstorm
Air Mass. 1. Air Mass : Large body of Air with similar temperature and humidity (or moisture) ; 4 types
 ; 4 types") Air Mass 1. Air Mass : Large body of Air with similar temperature and humidity (or moisture) ; 4 types A. Continental-relatively dry air masses that form over land. B. Maritime: relatively humid air masses
Air Mass 1. Air Mass : Large body of Air with similar temperature and humidity (or moisture) ; 4 types A. Continental-relatively dry air masses that form over land. B. Maritime: relatively humid air masses
Part. I Introduction. Part II Scale Characteristics and Climatology of MCSs
 Talking points for MCS teletraining session Part. I Introduction Slide 1 Slides 2-3 Title Objectives Part II Scale Characteristics and Climatology of MCSs Slides 4-5 Climatology of mesoscale convective