Satellites, Weather and Climate Module 1: Introduction to the Electromagnetic Spectrum
|
|
|
- Jordan Collins
- 6 years ago
- Views:
Transcription


1 Satellites, Weather and Climate Module 1: Introduction to the Electromagnetic Spectrum


2 What is remote sensing? = science & art of obtaining information through data analysis, such that the device is not in contact with object
3 Applications of RS data Earth resources changes of previously mapped areas water resources & land-use monitoring and management geologic mapping crop diseases agricultural yield forecasting Weather wind fields temperature humidity profiles cloud heights severe storm analysis

4 Seasonal Change at Harvard Forest
 SeaWiFS view of Hurricane Ivan was collected at 1:50 PM Central Daylight Time as it approached the U.S. Gulf Coast. The forth tropical storm to hit Florida in only 6 weeks.")
5 Hurricane Ivan: 15 Sept 04 approaching the Gulf Coast Gene Feldman, NASA GSFC, Laboratory for Hydrospheric Processes, SeaWiFS Project Office SeaWiFS view of Hurricane Ivan was collected at 1:50 PM Central Daylight Time as it approached the U.S. Gulf Coast. The forth tropical storm to hit Florida in only 6 weeks. Credit line for all images: Provided by the SeaWiFS Project, NASA Goddard Space Flight Center, and ORBIMAGE

6
7 Electromagnetic radiation electric field (E) magnetic field (M) perpendicular and travel at velocity, c (3x10 8 ms -1 )
8
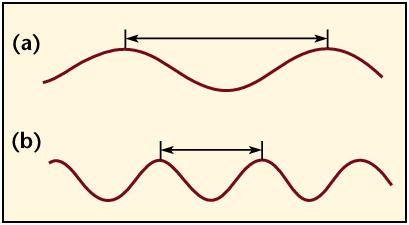
9 Wave: terms All waves characterised by: wavelength, (m) amplitude, a (m) velocity, v (m/s) frequency, f (s -1 or Hz) sometimes period, T (time for one oscillation i.e. 1/f) v

10
11
 When radiation passes from one medium to another, speed of light (c) and change, hence f")
12 EM Spectrum We will see how energy is related to frequency, f (and hence inversely proportional to wavelength, ) When radiation passes from one medium to another, speed of light (c) and change, hence f stays the same
 every object reflects or emits radiation = signature signatures recorded by")
13 use of different parts of spectrum visible infrared microwave Electromagnetic spectrum NASA: Echo the bat divided into different spectral bands (visible light, NIR, microwave) every object reflects or emits radiation = signature signatures recorded by remote-sensing devices
14
.")

15 First picture transmitted by a weather satellite First cloud picture from space, October, 1946 from V-2 rocket, altitude of 65 miles via 35 mm camera (top image). First weather satellite photo from TIROS-1, April 1, 1960 (bottom image). TIROS Pictures available only during daytime, between 48 deg N and S with poor resolution. Early satellites were geared for research community, but operational uses were evident.

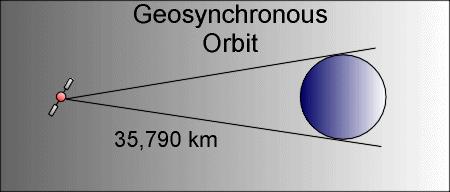
16 Satellite Orbits esu101/esu101page03.cfm?chapter_no=investigation

17
18 Geostationary satellites classified by longitude of their subsatellite point GMS (Geostationary Meteorological Satellite) Japan 140E Insat India 74E Meteosat Prime Meridian

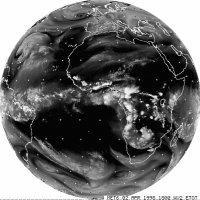
19 METEOSAT VIS IR WV

 altitude data every 30")
20 GOES Geostationary Operational Environmental Satellite geostationary orbit 75W, 135W 1-3 first series GOES 4 second generation 35,800 km (22,300 miles) altitude data every 30 minutes

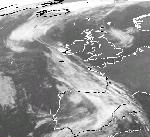
21 Sunsynchronous orbits satellite crosses the equator at the same local time every day orbit high latitudes - polar orbiters

22 NOAA AVHRR Tropical Storm Zeta in January 2006
23


24 Visible satellite Imagery represents sunlight scattered/reflected by objects such as clouds, land and water surfaces. visible images are only available during the day. generally, land areas are brighter than water. thick frontal clouds, as well as thunderstorms (western Mexico into Colorado and tropical system southeast of Texas) are bright.

. low clouds and fog are relatively warm and appear gray in IR satellite images.")
25 Infrared Satellite Imagery IR picture is a display of the infrared radiation emitted by a surface and converted to temperature. cold objects are white (Thunderstorm convective cloud tops) and hot surfaces appear black (land areas). low clouds and fog are relatively warm and appear gray in IR satellite images. IR satellite images are available day and night (A bonus).
")
26 A few satellite cloud imagery terms Visible Imagery Comma cloud Cloud shield Great Lakes do not reflect light thus are dark Cloud streets Cloud band Comma clouds are generally associated with counter-clockwise flow of low pressure Cloud shield is a broad area of clouds not defined by a long axis Cloud streets line up with the low level winds Cloud line Cloud bands (defined by long axis) are usually associated with multilayered frontal clouds

 and IR (cold cloud tops) Cumulus and stratocumulus clouds have a lumpy texture as in picture to left.")
27 Visible (VIS) versus Infrared (IR) satellite imagery Visible IR Visible images available during daylight hours (depend on reflectivity). IR available 24/7 as they measure cloud temperature. Visible images have better resolution than IR, showing cloud texture In visible, bright white clouds are thick or multi-layered clouds while thin clouds are medium grey. In IR, cold objects appear bright white and warm objects appear dark Bright grey/white clouds on visible that are difficult to see on IR are close to the earth's surface (warm), such as fog or stratus. Thunderstorms appear as bright white on visible (thick clouds) and IR (cold cloud tops) Cumulus and stratocumulus clouds have a lumpy texture as in picture to left. Stratus clouds have a flat dull grey texture. On visible images, the oceans and great lakes are generally black as to poor reflectivity (light absorbed) of water.
28 Clues to look for in satellite imagery Brightness in visible imagery, high brightness indicates thick clouds. In IR imagery bright clouds indicate cold high cloud tops. Cloud texture convective clouds appear lumpy and may cast shadows on surrounding lower clouds. Clouds with a smooth appearance are layered type clouds, and may cast shadows from their edges onto lower clouds. Organization or structure cellular or banded. Celluar clouds are usually convective while banded clouds are frequently associated with fronts.
Basic cloud Interpretation using Satellite Imagery
 Basic cloud Interpretation using Satellite Imagery Introduction Recall that images from weather satellites are actually measurements of energy from specified bands within the Electromagnetic (EM) spectrum.
Back to basics: From Sputnik to Envisat, and beyond: The use of satellite measurements in weather forecasting and research: Part 1 A history
 Back to basics: From Sputnik to Envisat, and beyond: The use of satellite measurements in weather forecasting and research: Part 1 A history Roger Brugge 1 and Matthew Stuttard 2 1 NERC Data Assimilation
Remote Sensing in Meteorology: Satellites and Radar. AT 351 Lab 10 April 2, Remote Sensing
 Remote Sensing in Meteorology: Satellites and Radar AT 351 Lab 10 April 2, 2008 Remote Sensing Remote sensing is gathering information about something without being in physical contact with it typically
Unit 11 Section 1 Computer Lab. Part 1: REMOTE SENSING OF THE EARTH SYSTEM BY SATELLITE
 Unit 11 Section 1 Computer Lab Part 1: REMOTE SENSING OF THE EARTH SYSTEM BY SATELLITE Educational Outcomes: Satellites orbiting the planet are ideal platforms for monitoring the Earth system from above
Weather is the of the Earth s atmosphere at a place and time. It is the movement of through the atmosphere o Energy comes from the
 Weather Notes Weather Weather is the of the Earth s atmosphere at a place and time It is the movement of through the atmosphere o Energy comes from the The sun is the force that weather The sun s energy
Weather Studies Introduction to Atmospheric Science
 Weather Studies Introduction to Atmospheric Science American Meteorological Society Chapter 1 Monitoring The Weather Credit: This presentation was prepared for AMS by Michael Leach, Professor of Geography
Which graph best shows the relationship between intensity of insolation and position on the Earth's surface? A) B) C) D)
 B) C) D)") 1. The hottest climates on Earth are located near the Equator because this region A) is usually closest to the Sun B) reflects the greatest amount of insolation C) receives the most hours of daylight D)
1. The hottest climates on Earth are located near the Equator because this region A) is usually closest to the Sun B) reflects the greatest amount of insolation C) receives the most hours of daylight D)
also known as barometric pressure; weight of the air above the surface of the earth; measured by a barometer air pressure, high
 Weather Vocabulary Vocabulary Term Meaning/Definition air mass * large bodies of air that have the similar properties throughout such as temperature, humidity, and air pressure; causes most of the weather
Evaporation - Water evaporates (changes from a liquid to a gas) into water vapor due to heat from the Sun.
 into water vapor due to heat from the Sun.") Erin Kathryn 2016 Weather is the conditions of Earth s atmosphere at a certain time and place. For example, sunshine, rain, hurricanes, and storms are all examples of weather. Weather is different at different
Erin Kathryn 2016 Weather is the conditions of Earth s atmosphere at a certain time and place. For example, sunshine, rain, hurricanes, and storms are all examples of weather. Weather is different at different
Weather Notes. Chapter 16, 17, & 18
 Weather Notes Chapter 16, 17, & 18 Weather Weather is the condition of the Earth s atmosphere at a particular place and time Weather It is the movement of energy through the atmosphere Energy comes from
Climate & Earth System Science. Introduction to Meteorology & Climate. Chapter 05 SOME OBSERVING INSTRUMENTS. Instrument Enclosure.
 Climate & Earth System Science Introduction to Meteorology & Climate MAPH 10050 Peter Lynch Peter Lynch Meteorology & Climate Centre School of Mathematical Sciences University College Dublin Meteorology
Land Surface Temperature Measurements From the Split Window Channels of the NOAA 7 Advanced Very High Resolution Radiometer John C.
 Land Surface Temperature Measurements From the Split Window Channels of the NOAA 7 Advanced Very High Resolution Radiometer John C. Price Published in the Journal of Geophysical Research, 1984 Presented
Activity: A Satellite Puzzle
 Activity: A Satellite Puzzle Introduction Satellites provide unique views of Earth. The imagery acquired by these space platforms reveal weather systems and broad-scale circulation patterns that can be
Moisture, Clouds, and Precipitation: Clouds and Precipitation. Dr. Michael J Passow
 Moisture, Clouds, and Precipitation: Clouds and Precipitation Dr. Michael J Passow What Processes Lift Air? Clouds require three things: water vapor, a condensation nucleus, and cooling Cooling usually
Chapter 12 Section 12.1 The causes of weather
 Chapter 12 Section 12.1 The causes of weather Main Idea: Air masses have different temperatures and amounts of moisture because of the uneven heating of earth's surface. What is Meteorology The study of
International Cooperation in Operational Environmental Satellites: The U.S. Experience
 Committee on the Peaceful Uses of Outer Space Science and Technology Sub committee Forty seventh session February 17, 2010 Vienna, Austria International Cooperation in Operational Environmental Satellites:
Clouds and Atmospheric convection
 Clouds and Atmospheric convection Caroline Muller carolinemuller123@gmail.com E406 L3 ENS A Year of Weather 2013 This visualisation, comprised of imagery from the geostationary satellites of EUMETSAT,
3 Severe Weather. Critical Thinking
 CHAPTER 2 3 Severe Weather SECTION Understanding Weather BEFORE YOU READ After you read this section, you should be able to answer these questions: What are some types of severe weather? How can you stay
Fifty Years of Operational Environmental Satellites: The U.S. Experience
 United Nations Committee on the Peaceful Uses of Outer Space Vienna, Austria June 15, 2010 Fifty Years of Operational Environmental Satellites: The U.S. Experience Mr. Charles Baker Deputy Assistant Administrator
Temperature AOSC 200 Tim Canty
 Temperature AOSC 200 Tim Canty Class Web Site: http://www.atmos.umd.edu/~tcanty/aosc200 Topics for today: Daily Temperatures Role of clouds, latitude, land/water Lecture 09 Feb 26 2019 1 Today s Weather
Figure 1. Idealized global atmospheric circulation (C= surface convergence, D= surface divergence).
.") page - 1 Laboratory Exercise #8 - Introduction to Atmospheric Science: Global Circulation and Weather Makers Section A - Global Atmospheric Circulation: To understand weather you need to understand how
page - 1 Laboratory Exercise #8 - Introduction to Atmospheric Science: Global Circulation and Weather Makers Section A - Global Atmospheric Circulation: To understand weather you need to understand how
Detailed Cloud Motions from Satellite Imagery Taken at Thirty Second One and Three Minute Intervals
 Detailed Cloud Motions from Satellite Imagery Taken at Thirty Second One and Three Minute Intervals James F.W. Purdom NOAA/NESDIS/RAMM Branch CIRA Colorado State University W. Laporte Avenue Fort Collins,
Fluid Circulation Review. Vocabulary. - Dark colored surfaces absorb more energy.
 Fluid Circulation Review Vocabulary Absorption - taking in energy as in radiation. For example, the ground will absorb the sun s radiation faster than the ocean water. Air pressure Albedo - Dark colored
The most abundant gas in the atmosphere by volume is. This gas comprises 78% of the Earth atmosphere by volume.
 The most abundant gas in the atmosphere by volume is. This gas comprises 78% of the Earth atmosphere by volume. A. Oxygen B. Water Vapor C. Carbon Dioxide D. Nitrogen An isobar is a line of constant. A.
Figure 1. Idealized global atmospheric circulation (C = surface convergence, D = surface divergence).
.") page - Laboratory Exercise #8 - Introduction to Atmospheric Science: Global Circulation and Weather Makers Section A - Global Atmospheric Circulation: To understand weather you need to understand how the
page - Laboratory Exercise #8 - Introduction to Atmospheric Science: Global Circulation and Weather Makers Section A - Global Atmospheric Circulation: To understand weather you need to understand how the
Lecture 4: Radiation Transfer
 Lecture 4: Radiation Transfer Spectrum of radiation Stefan-Boltzmann law Selective absorption and emission Reflection and scattering Remote sensing Importance of Radiation Transfer Virtually all the exchange
Aviation Hazards: Thunderstorms and Deep Convection
 Aviation Hazards: Thunderstorms and Deep Convection TREND Diagnosis of thunderstorm hazards using imagery Contents Satellite imagery Visible, infrared, water vapour Basic cloud identification Identifying
On my honor, I have neither given nor received unauthorized aid on this examination.
 PHYSICS DEPARTMENT MET 1010 Final Exam December 18, 2008 Name (print): Signature: On my honor, I have neither given nor received unauthorized aid on this examination. YOUR TEST NUMBER IS THE 5-DIGIT NUMBER
Lecture 4b: Meteorological Satellites and Instruments. Acknowledgement: Dr. S. Kidder at Colorado State Univ.
 Lecture 4b: Meteorological Satellites and Instruments Acknowledgement: Dr. S. Kidder at Colorado State Univ. US Geostationary satellites - GOES (Geostationary Operational Environmental Satellites) US
THE FEASIBILITY OF EXTRACTING LOWLEVEL WIND BY TRACING LOW LEVEL MOISTURE OBSERVED IN IR IMAGERY OVER CLOUD FREE OCEAN AREA IN THE TROPICS
 THE FEASIBILITY OF EXTRACTING LOWLEVEL WIND BY TRACING LOW LEVEL MOISTURE OBSERVED IN IR IMAGERY OVER CLOUD FREE OCEAN AREA IN THE TROPICS Toshiro Ihoue and Tetsuo Nakazawa Meteorological Research Institute
Unit: Weather Study Guide
 Name: Period: Unit: Weather Study Guide Define each vocabulary word on a separate piece of paper or index card. Weather Climate Temperature Wind chill Heat index Sky conditions UV index Visibility Wind
Science Chapter 13,14,15
 Science 1206 Chapter 13,14,15 1 Weather dynamics is the study of how the motion of water and air causes weather patterns. Energy from the Sun drives the motion of clouds, air, and water. Earth s tilt at
SAN FRANCISCO STATE UNIVERSITY NAME DEPARTMENT OF GEOSCIENCES Spring 2013
 SAN FRANCISCO STATE UNIVERSITY NAME DEPARTMENT OF GEOSCIENCES Spring 2013 METR 415/715: MONTEVERDI QUIZ 1 Open Book and Open Notes 200 points, 45 minutes 1. Compute the altitude of a geostationary orbit
Why There Is Weather?
 Lecture 6: Weather, Music Of Our Sphere Weather and Climate WEATHER The daily fluctuations in atmospheric conditions. The atmosphere on its own can produce weather. (From Understanding Weather & Climate)
MODULE 2 LECTURE NOTES 1 SATELLITES AND ORBITS
 MODULE 2 LECTURE NOTES 1 SATELLITES AND ORBITS 1. Introduction When a satellite is launched into the space, it moves in a well defined path around the Earth, which is called the orbit of the satellite.
1 What Is Climate? TAKE A LOOK 2. Explain Why do areas near the equator tend to have high temperatures?
 CHAPTER 17 1 What Is Climate? SECTION Climate BEFORE YOU READ After you read this section, you should be able to answer these questions: What is climate? What factors affect climate? How do climates differ
Warming Earth and its Atmosphere The Diurnal and Seasonal Cycles
 Warming Earth and its Atmosphere The Diurnal and Seasonal Cycles Or, what happens to the energy received from the sun? First We Need to Understand The Ways in Which Heat Can be Transferred in the Atmosphere
ESCI 344 Tropical Meteorology Lesson 7 Temperature, Clouds, and Rain
 ESCI 344 Tropical Meteorology Lesson 7 Temperature, Clouds, and Rain References: Forecaster s Guide to Tropical Meteorology (updated), Ramage Tropical Climatology, McGregor and Nieuwolt Climate and Weather
Meteorology Today. 1 Aug st Lt Libby Haynes Capt Kim Mevers
 Meteorology 1950 - Today 1 Aug 2018 1 st Lt Libby Haynes Capt Kim Mevers What is meteorology? Is it important to you? Meteorology is the science of the atmosphere embracing both weather and climate. It
National Maritime Center
 National Maritime Center Providing Credentials to Mariners (Sample Examination) Page 1 of 5 Choose the best answer to the following Multiple Choice Questions. 1. Fog is formed when which condition exists?
NATS 101 Section 13: Lecture 11. Clouds
 NATS 101 Section 13: Lecture 11 Clouds Cloud Classification Luke Howard (English naturalist) developed a system in 1803 that employed Latin words to describe clouds as they appear to a ground observer.
AOSC201: Weather and Climate Lab
 AOSC201: Weather and Climate Lab Week 8: Forecasting - Analysis Section 107/108 Instructor: Agniv Sengupta q Lab #7 of Lab Manual (pages 41-49) q 50 points in total q INDIVIDUAL Work for the entire lab
Which Earth latitude receives the greatest intensity of insolation when Earth is at the position shown in the diagram? A) 0 B) 23 N C) 55 N D) 90 N
 0 B) 23 N C) 55 N D) 90 N") 1. In which list are the forms of electromagnetic energy arranged in order from longest to shortest wavelengths? A) gamma rays, x-rays, ultraviolet rays, visible light B) radio waves, infrared rays, visible
1. In which list are the forms of electromagnetic energy arranged in order from longest to shortest wavelengths? A) gamma rays, x-rays, ultraviolet rays, visible light B) radio waves, infrared rays, visible
Fundamentals of Remote Sensing
 Division of Spatial Information Science Graduate School Life and Environment Sciences University of Tsukuba Fundamentals of Remote Sensing Prof. Dr. Yuji Murayama Surantha Dassanayake 10/6/2010 1 Fundamentals
Lecture 4: Meteorological Satellites and Instruments. Acknowledgement: Dr. S. Kidder at Colorado State Univ.
 Lecture 4: Meteorological Satellites and Instruments Acknowledgement: Dr. S. Kidder at Colorado State Univ. Homework for the Spring Break: get some tangible, preliminary results for your final project.
1. Which weather map symbol is associated with extremely low air pressure? A) B) C) D) 2. The diagram below represents a weather instrument.
 B) C) D) 2. The diagram below represents a weather instrument.") 1. Which weather map symbol is associated with extremely low air pressure? 2. The diagram below represents a weather instrument. Which weather variable was this instrument designed to measure? A) air pressure
1. Which weather map symbol is associated with extremely low air pressure? 2. The diagram below represents a weather instrument. Which weather variable was this instrument designed to measure? A) air pressure
Name Period 4 th Six Weeks Notes 2013 Weather
 Name Period 4 th Six Weeks Notes 2013 Weather Radiation Convection Currents Winds Jet Streams Energy from the Sun reaches Earth as electromagnetic waves This energy fuels all life on Earth including the
Answers to Clicker Questions
 Answers to Clicker Questions Chapter 1 What component of the atmosphere is most important to weather? A. Nitrogen B. Oxygen C. Carbon dioxide D. Ozone E. Water What location would have the lowest surface
GEOG Lecture 8. Orbits, scale and trade-offs
 Environmental Remote Sensing GEOG 2021 Lecture 8 Orbits, scale and trade-offs Orbits revisit Orbits geostationary (36 000 km altitude) polar orbiting (200-1000 km altitude) Orbits revisit Orbits geostationary
SATELLITE SIGNATURES ASSOCIATED WITH SIGNIFICANT CONVECTIVELY-INDUCED TURBULENCE EVENTS
 SATELLITE SIGNATURES ASSOCIATED WITH SIGNIFICANT CONVECTIVELY-INDUCED TURBULENCE EVENTS Kristopher Bedka 1, Wayne Feltz 1, John Mecikalski 2, Robert Sharman 3, Annelise Lenz 1, and Jordan Gerth 1 1 Cooperative
An Objective Algorithm for the Identification of Convective Tropical Cloud Clusters in Geostationary Infrared Imagery. Why?
 An Objective Algorithm for the Identification of Convective Tropical Cloud Clusters in Geostationary Infrared Imagery By Chip Helms Faculty Advisor: Dr. Chris Hennon Why? Create a database for the tropical
>>>>>>>>WHEN YOU FINISH <<<<<<<< Hand in the answer sheet separately.
 Instructor: Prof. Seiberling PHYSICS DEPARTMENT MET 1010 1st Midterm Exam Sept. 23, 2002 Name (print, last rst): Signature: On my honor, I have neither given nor received unauthorized aid on this examination.
The Atmosphere. Importance of our. 4 Layers of the Atmosphere. Introduction to atmosphere, weather, and climate. What makes up the atmosphere?
 The Atmosphere Introduction to atmosphere, weather, and climate Where is the atmosphere? Everywhere! Completely surrounds Earth February 20, 2010 What makes up the atmosphere? Argon Inert gas 1% Variable
Objective 3: Earth and Space Systems
 Name Class Period: Objective 3: Earth and Space Systems 1. The diagram above shows the orbit of the moon around Earth. At which point in the moon s orbit will a person standing on Earth see a waxing crescent
Chapter 3: Weather Fronts & Storms
 Chapter 3: Weather Fronts & Storms An AIR MASS is a large body of air that has similar characteristics (temperature, humidity) throughout. Air masses can be massively large. Air masses are classified by
Lecture 19: Operational Remote Sensing in Visible, IR, and Microwave Channels
 MET 4994 Remote Sensing: Radar and Satellite Meteorology MET 5994 Remote Sensing in Meteorology Lecture 19: Operational Remote Sensing in Visible, IR, and Microwave Channels Before you use data from any
4 Forecasting Weather
 CHAPTER 2 4 Forecasting Weather SECTION Understanding Weather BEFORE YOU READ After you read this section, you should be able to answer these questions: What instruments are used to forecast weather? How
Condensation: Dew, Fog and Clouds AT350
 Condensation: Dew, Fog and Clouds AT350 T=30 C Water vapor pressure=12mb What is Td? What is the sat. water vapor T=30 C Water vapor pressure=12mb What is Td? What is the sat. water vapor ~12/42~29% POLAR
The main components of Earth that affects weather are: 1)
") Weather Dynamics Weather Dynamics: The main components of Earth that affects weather are: 1) 2) 3) What's the difference between weather and climate? Weather -. ex. weeks weather in St. John's ion January
Weather Dynamics Weather Dynamics: The main components of Earth that affects weather are: 1) 2) 3) What's the difference between weather and climate? Weather -. ex. weeks weather in St. John's ion January
2) What general circulation wind belt is the place of origin for hurricanes? A) westerlies B) trade winds C) doldrums D) horse latitudes
 What general circulation wind belt is the place of origin for hurricanes? A) westerlies B) trade winds C) doldrums D) horse latitudes") Meteo 1010 Homework 6 1) What is the difference between a typhoon and a hurricane? A) A hurricane is a true tropical cyclone, but a typhoon is not. B) A hurricane is stronger than a typhoon. C) They represent
Meteo 1010 Homework 6 1) What is the difference between a typhoon and a hurricane? A) A hurricane is a true tropical cyclone, but a typhoon is not. B) A hurricane is stronger than a typhoon. C) They represent
Energy Balance and Temperature. Ch. 3: Energy Balance. Ch. 3: Temperature. Controls of Temperature
 Energy Balance and Temperature 1 Ch. 3: Energy Balance Propagation of Radiation Transmission, Absorption, Reflection, Scattering Incoming Sunlight Outgoing Terrestrial Radiation and Energy Balance Net
Energy Balance and Temperature
 Energy Balance and Temperature 1 Ch. 3: Energy Balance Propagation of Radiation Transmission, Absorption, Reflection, Scattering Incoming Sunlight Outgoing Terrestrial Radiation and Energy Balance Net
Why the Earth has seasons. Why the Earth has seasons 1/20/11
 Chapter 3 Earth revolves in elliptical path around sun every 365 days. Earth rotates counterclockwise or eastward every 24 hours. Earth closest to Sun (147 million km) in January, farthest from Sun (152
Image 1: Earth from space
 Image 1: Earth from space Credit: NASA Spacecraft: Apollo 17 Sensor: camera using visible light Image date: December 7, 1972 This image is a photograph of Earth taken by Harrison "Jack" Schmitt, an astronaut
Meteorological Satellite Image Interpretations, Part III. Acknowledgement: Dr. S. Kidder at Colorado State Univ.
 Meteorological Satellite Image Interpretations, Part III Acknowledgement: Dr. S. Kidder at Colorado State Univ. Dates EAS417 Topics Jan 30 Introduction & Matlab tutorial Feb 1 Satellite orbits & navigation
ATMOS 5140 Lecture 1 Chapter 1
 ATMOS 5140 Lecture 1 Chapter 1 Atmospheric Radiation Relevance for Weather and Climate Solar Radiation Thermal Infrared Radiation Global Heat Engine Components of the Earth s Energy Budget Relevance for
Page 1. Name:
 Name: 1) As the difference between the dewpoint temperature and the air temperature decreases, the probability of precipitation increases remains the same decreases 2) Which statement best explains why
Introduction to Electromagnetic Radiation and Radiative Transfer
 Introduction to Electromagnetic Radiation and Radiative Transfer Temperature Dice Results Visible light, infrared (IR), ultraviolet (UV), X-rays, γ-rays, microwaves, and radio are all forms of electromagnetic
Earth Science Chapter 16 and 17. Weather and Climate
 Earth Science Chapter 16 and 17 Weather and Climate Prediction Old way Groundhog Color of the sky Modern way satellites instruments computers Goal Weather Factors Studied by meteorologists Several factors
Interpretation of Polar-orbiting Satellite Observations. Atmospheric Instrumentation
 Interpretation of Polar-orbiting Satellite Observations Outline Polar-Orbiting Observations: Review of Polar-Orbiting Satellite Systems Overview of Currently Active Satellites / Sensors Overview of Sensor
Atmospheric Motion Vectors (AMVs) and their forecasting significance
 and their forecasting significance") Atmospheric Motion Vectors (AMVs) and their forecasting significance Vijay Garg M.M. College, Modi Nagar, Ghaziabad, Uttar Pradesh R.K. Giri Meteorological Center India Meteorological Department, Patna-14
Atmospheric Motion Vectors (AMVs) and their forecasting significance Vijay Garg M.M. College, Modi Nagar, Ghaziabad, Uttar Pradesh R.K. Giri Meteorological Center India Meteorological Department, Patna-14
SEASONAL AND DAILY TEMPERATURES
 1 2 3 4 5 6 7 8 9 10 11 12 SEASONAL AND DAILY TEMPERATURES Chapter 3 Earth revolves in elliptical path around sun every 365 days. Earth rotates counterclockwise or eastward every 24 hours. Earth closest
P3.24 EVALUATION OF MODERATE-RESOLUTION IMAGING SPECTRORADIOMETER (MODIS) SHORTWAVE INFRARED BANDS FOR OPTIMUM NIGHTTIME FOG DETECTION
 SHORTWAVE INFRARED BANDS FOR OPTIMUM NIGHTTIME FOG DETECTION") P3.24 EVALUATION OF MODERATE-RESOLUTION IMAGING SPECTRORADIOMETER (MODIS) SHORTWAVE INFRARED BANDS FOR OPTIMUM NIGHTTIME FOG DETECTION 1. INTRODUCTION Gary P. Ellrod * NOAA/NESDIS/ORA Camp Springs, MD
P3.24 EVALUATION OF MODERATE-RESOLUTION IMAGING SPECTRORADIOMETER (MODIS) SHORTWAVE INFRARED BANDS FOR OPTIMUM NIGHTTIME FOG DETECTION 1. INTRODUCTION Gary P. Ellrod * NOAA/NESDIS/ORA Camp Springs, MD
WATER IN THE ATMOSPHERE
 WATER IN THE ATMOSPHERE I. Humidity A. Defined as water vapor or moisture in the air (from evaporation and condensation). B. The atmosphere gains moisture from the evaporation of water from oceans, lakes,
3) What is the difference between latitude and longitude and what is their affect on local and world weather and climate?
 What is the difference between latitude and longitude and what is their affect on local and world weather and climate?") www.discoveryeducation.com 1) Describe the difference between climate and weather citing an example of each. Describe how water (ocean, lake, river) has a local effect on weather and climate and provide
www.discoveryeducation.com 1) Describe the difference between climate and weather citing an example of each. Describe how water (ocean, lake, river) has a local effect on weather and climate and provide
Lecture #14 March 29, 2010, Monday. Air Masses & Fronts
 Lecture #14 March 29, 2010, Monday Air Masses & Fronts General definitions air masses source regions fronts Air masses formation types Fronts formation types Air Masses General Definitions a large body
DEPARTMENT OF EARTH & CLIMATE SCIENCES Name SAN FRANCISCO STATE UNIVERSITY Nov 29, ERTH 360 Test #2 200 pts
 DEPARTMENT OF EARTH & CLIMATE SCIENCES Name SAN FRANCISCO STATE UNIVERSITY Nov 29, 2018 ERTH 360 Test #2 200 pts Each question is worth 4 points. Indicate your BEST CHOICE for each question on the Scantron
Clever Catch Weather Ball Question and Answer Sheets
 Clever Catch Weather Ball Question and Answer Sheets 1. Too much exposure to can cause skin cancer. B. Ultraviolet radiation 2. The layer of the atmosphere closest to the Earth s surface is the 3. Some
WEATHER. Review Note Cards
 WEATHER Review Note Cards Thermometer Weather instrument that measures air temperature Units include F, C, and K ESRT 13 Sling Psychrometer Weather instrument that measures relative humidity and dewpoint
Weather Systems Study Guide:
 Weather Systems Study Guide: 1. Draw a diagram of Earth s water cycle and label each part. 2. Explain how the water cycle works. 3. What happens in the troposphere and stratosphere? Atmosphere Level What
Journal of the Meteorological Society of Japan, Vol. 75, No. 1, pp , Day-to-Night Cloudiness Change of Cloud Types Inferred from
 Journal of the Meteorological Society of Japan, Vol. 75, No. 1, pp. 59-66, 1997 59 Day-to-Night Cloudiness Change of Cloud Types Inferred from Split Window Measurements aboard NOAA Polar-Orbiting Satellites
National Maritime Center
 National Maritime Center Providing Credentials to Mariners (Sample Examination) Page 1 of 5 Choose the best answer to the following Multiple Choice Questions. 1. In a weather report, the term "visibility"
1. The frequency of an electromagnetic wave is proportional to its wavelength. a. directly *b. inversely
 CHAPTER 3 SOLAR AND TERRESTRIAL RADIATION MULTIPLE CHOICE QUESTIONS 1. The frequency of an electromagnetic wave is proportional to its wavelength. a. directly *b. inversely 2. is the distance between successive
Principles of Satellite Remote Sensing
 Chapter 5 Principles of Satellite Remote Sensing Goal: Give a overview on the characteristics of satellite remote sensing. Satellites have several unique characteristics which make them particularly useful
Hurricanes. Where's the Really Bad Weather 1. What: Rotating wind/rain storm Winds from 75 to 200 mph As big as 600 miles wide
 Where's the Really Bad Weather 1 Hurricanes What: Rotating wind/rain storm Winds from 75 to 200 mph As big as 600 miles wide Where: Start over oceans, fizzle out over land Investigation 1 What is Weather?
L.O: THE ANGLE OF INSOLATION ANGLE INSOLATION: THE ANGLE SUNLIGHT HITS THE EARTH
 L.O: THE ANGLE OF INSOLATION ANGLE INSOLATION: THE ANGLE SUNLIGHT HITS THE EARTH 1. The graph below shows air temperatures on a clear summer day from 7 a.m. to 12 noon at two locations, one in Florida
Global Weather Trade Winds etc.notebook February 17, 2017
 Global Weather 1 north pole northern hemisphere equator southern hemisphere south pole 2 We have seasons because of the Earth's tilt The seasons are opposite in the northern and southern hemispheres winter
Weather - is the state of the atmosphere at a specific time & place
 Weather Section 1 Weather - is the state of the atmosphere at a specific time & place Includes such conditions as air pressure, wind, temperature, and moisture in the air The Sun s heat evaporates water
A) usually less B) dark colored and rough D) light colored with a smooth surface A) transparency of the atmosphere D) rough, black surface
 usually less B) dark colored and rough D) light colored with a smooth surface A) transparency of the atmosphere D) rough, black surface") 1. Base your answer to the following question on the diagram below which shows two identical houses, A and B, in a city in North Carolina. One house was built on the east side of a factory, and the other
1. Base your answer to the following question on the diagram below which shows two identical houses, A and B, in a city in North Carolina. One house was built on the east side of a factory, and the other
Light The EM Spectrum
 Light The EM Spectrum 1 Spectrum of Electromagnetic Radiation Region Wavelength (Angstroms) Wavelength (centimeters) Frequency (Hz) Energy (ev) Radio > 10 9 > 10 < 3 x 10 9 < 10-5 Microwave 10 9-10 6 10-0.01
Chapter 2. Heating Earth's Surface & Atmosphere
 Chapter 2 Heating Earth's Surface & Atmosphere Topics Earth-Sun Relationships Energy, Heat and Temperature Mechanisms of Heat Transfer What happens to Incoming Solar Radiation? Radiation Emitted by the
Science 1206 SAMPLE Test ( Weather Dynamics)
") Science 1206 SAMPLE Test ( Weather Dynamics) Name:. Part A: Multiple Choice (60%) Shade the letter of the best answer on the Scantron sheet provided. 1. Which term refers to the current atmospheric conditions?
Science 1206 SAMPLE Test ( Weather Dynamics) Name:. Part A: Multiple Choice (60%) Shade the letter of the best answer on the Scantron sheet provided. 1. Which term refers to the current atmospheric conditions?
Maps and Remote Sensing AOSC 200 Tim Canty
 Maps and Remote Sensing AOSC 200 Tim Canty Class Web Site: http://www.atmos.umd.edu/~tcanty/aosc200 Topics for today: Weather Maps Radar Satellite Observations Lecture 04 Feb 7 2019 1 Today s Weather Map
Polar regions Temperate Regions Tropics High ( cirro ) 3-8 km 5-13 km 6-18 km Middle ( alto ) 2-4 km 2-7 km 2-8 km Low ( strato ) 0-2 km 0-2 km 0-2 km
 3-8 km 5-13 km 6-18 km Middle ( alto ) 2-4 km 2-7 km 2-8 km Low ( strato ) 0-2 km 0-2 km 0-2 km") Clouds and Climate Clouds (along with rain, snow, fog, haze, etc.) are wet atmospheric aerosols. They are made up of tiny spheres of water from 2-100 m which fall with terminal velocities of a few cm/sec.
Clouds and Climate Clouds (along with rain, snow, fog, haze, etc.) are wet atmospheric aerosols. They are made up of tiny spheres of water from 2-100 m which fall with terminal velocities of a few cm/sec.
Comparison of cloud statistics from Meteosat with regional climate model data
 Comparison of cloud statistics from Meteosat with regional climate model data R. Huckle, F. Olesen, G. Schädler Institut für Meteorologie und Klimaforschung, Forschungszentrum Karlsruhe, Germany (roger.huckle@imk.fzk.de
Lectures 7 and 8: 14, 16 Oct Sea Surface Temperature
 Lectures 7 and 8: 14, 16 Oct 2008 Sea Surface Temperature References: Martin, S., 2004, An Introduction to Ocean Remote Sensing, Cambridge University Press, 454 pp. Chapter 7. Robinson, I. S., 2004, Measuring
KEY. 7th Grade Science: Weather and Climate Core Assessment Study Guide
 KEY 7th Grade Science: Weather and Climate Core Assessment Study Guide Ch. 1 The Air Around You (pg. 6-26) 1. The chart on the right shows the percentage of gases that comprise our atmosphere. Use the
Ch22&23 Test. Multiple Choice Identify the choice that best completes the statement or answers the question.
 Ch22&23 Test Multiple Choice Identify the choice that best completes the statement or answers the question. 1. The two most abundant compounds in the atmosphere are carbon dioxide and a. particulates.
Weather and Energy Review
 Weather and Energy Review Name 1. Base your answer to the following question on the diagram below, which represents the greenhouse effect in which heat energy is trapped in Earth's atmosphere Which type
RGB Products: an easy and practical way to display multispectral satellite data (in combination with derived products)
") RGB Products: an easy and practical way to display multispectral satellite data (in combination with derived products) Dr. Jochen Kerkmann Training Officer EUMETSAT Multi-channel GEO satellites today Him-08
RGB Products: an easy and practical way to display multispectral satellite data (in combination with derived products) Dr. Jochen Kerkmann Training Officer EUMETSAT Multi-channel GEO satellites today Him-08