THE STATE OF SURFACE WATER GAUGING IN THE NAVAJO NATION
|
|
|
- Alberta Hamilton
- 5 years ago
- Views:
Transcription
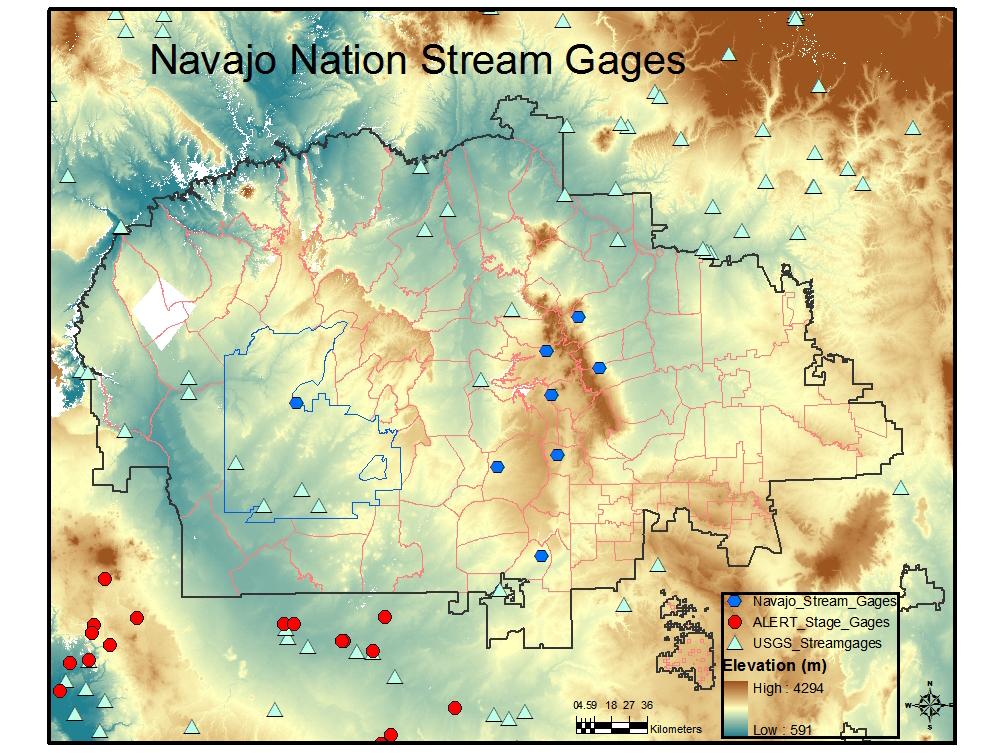
1 THE STATE OF SURFACE WATER GAUGING IN THE NAVAJO NATION Aregai Tecle Professor of Hydrology Northern Arizona University Flagstaff, AZ Acknowledgement Many thanks to my research team mates and Elisabeth Alden for taking the photographs
2 A MEASUREMENT OF STREAM DISCHARGE RATE IS NEEDED FOR PRECISE ESTIMATE OF THE TOTALAMOUNT OF WATER LEAVING A WATERSHED. THE WATER COMES FROM SURFACE AND SUBSURFACE SOURCES. KNOWLEDGE OF THE AMOUNT OF FLOW IS IMPORTANT FOR MANY REASONS.
3 PURPOSES OF STREAM GAUGING To enhance the public safety by providing data for forecasting and managing floods To delineate and manage flood plains To characterize current water-quality conditions To operate and design multipurpose reservoirs To design highway bridges and culverts To set minimum flow requirements to meet aquatic life goals To monitor compliance with minimum flow requirements To develop or operate recreation facilities To allocate water for municipal, industrial, and irrigation uses To determine impacts of phreatophyte water consumption To evaluate surface- and ground-water interaction For scientific studies of long-term changes in the hydrologic
4 CHARACTERISTICS THAT INFLUENCE DATA QUALITY AND RELIABILITY INSTRUMENT RELIABILITY DATA HANDLING DATA PROCESSING INSTRUMENT MAINTENANCE DATA ACCESSIBILITY (Location) SPATIAL DISTRIBUTION AND REPRESENTATIVENESS OF DATA AVAILABILITY OF KNOWLEDGEABLE AND DEDICATED PERSONNEL
5
6 STREAM GAUGING ASSESSMENT IN THE NAVAJO NATION Information sources On-site examination of stream flow gauging sites and instruments Relevant literature review Downloading available USGS data on Navajo streams Interview of relevant personnel (NDWR and USGS) Historical data acquisition
7 STREAM GAUGING ASSESSMENT IN THE NAVAJO NATION Data analysis Evaluation of NDWR stream flow data collection, reporting, communication, and integration needs Arranging data and trend analysis Comparing data from USGS and NDWR operated gauges Determining weaknesses and strengths Providing appropriate recommendings
8 CURRENT CONDITIONS OF STREAMS AND ASSOCIATED DATA IN THE NAVAJO NATION
9 SAN JUAN RIVER STREAM FLOW CHARACTERISTICS The San Juan River is operated by the USGS. Compared to those operated by the NDWR, the data can be used for many purposes. Here we use it to show the wet season in the lower right hand side and to show the decreasing streeam flow (or drying) condition in the lower left hand side. The 3-D D figure to the right shows the monthly average stream flow for 27 years. The figure can show us years of high or low flows. We can also use the data for modeling water yield and peak flow or flood forecasting 35 Streamflow rate (in cfs) Years Jan Mar May Jul Sep Nov Months Stream flow of San Juan River in New Mexico near the border with the Navajo Nation 3 5 Stream flow rate (in cfs) Annual average streamdlow (in cfs) Jan Feb Mar Apr May Jun Jul Aug Sep Oct Nov Dec Years of record Months of the year A five year running average of stream flow rate (in cfs) at San Juan River Monthly average hydrograph of flow rate at San Juan River (in cfs)
10 5-year running average stream flow (in cfs) LITTLE COLORADO RIVER NEAR CAMEROON: ANOTHER EXAMPLE OF A USGS-OPERATED STREAM GAUGE year running average of Little Colorad River discharge (in cfs) near Cameroon, Arizona Monthly average stream flow (in cfs) Years of record Jan Feb Mar Apr May Jun Jul Aug Sep Oct Nov Dec 1981 Months of the year Monthly average stream flow (in cfs) of Little Colorado River near Cameron, Arizona This is a long term data which can be manipulated to show different hydrologic conditions around the area of measurement. The graphs on the right hand side show wet and dry years for 58 year, the upper one on a monthly basis in 3-D and below it as yearly average. The graphs to the left show a 5-year running average and monthly average hydrographs to show annual and seasonal behaviors of the river. Stream flow rate (in cfs) Monthly average stream flow (in cfs) Years of record Jan May Sep Months stream flow record in the Little Colorado River near Cameron, Arizona Years of data record Annual average stream flow (in cfs) of Little Colorado River near Cameron, Arizona


11 BLACK CREEK: GAUGE CONDITION Instrument has been operating continuously Data arrangement follows a USGS format Data recording has been interrupted a number of times Problems with the gauging station Stilling well & vegetation Channel invasion by vegetation Channel bed sediment accumulation Sediment accumulation
12 Oct NovDec Jan Feb Total monthly stream discharge (in cfs) Months of the year BLACK CREEK STREAMFLOW CHART Jul Aug Sep Years Mar Apr May Jun


13 ASSAYI CREEK: GAUGE CONDITION Problems with Assayi Creek 1. Invasion by vegetation 3. Data have not been regularly 2. Sediment accumulation taken and processed
14 ASSAYI CREEK DATA The graph on the left shows sporadic stream flow data while the dotted graph on the right is stage- discharge relationship of the recorded data. The chart shows little flows for high stage which can be due to errors in data recording or instrument reading. Assayi Creek Sporadic Stream Flow Measurement Stage height versus Stream flow rate for Assayi Creek Stream flow rate (in cfs) Years of record stage height (in feet) Stream flow rate (in cfs)
 stream")
 lots of sediment accumulation and 3)")

15 Stilling well CHINLE CREEK: GAUGE CONDITION Three major problems are apparent in this gauging station: 1) stream braiding resulting in most of the flow taking place away from the gauge, 2) lots of sediment accumulation and 3) stream bottom plant and tree growth The consequences of these conditions are both under and over estimation of stream flow
16 CHINLE CREEK DATA The graph on the left hand side shows the sporadic nature of the data collected form the gauge at Chinle,, and there is nothing one can do with such data. The dotted graph of stage-discharge relationship on the right shows low correlation between the two forms of stream flow measurement, which reflects the channel problem. Chart of sporadic flow rate data for Chinle Creek Chinle Creek stage height versus stream flow rate 45 3 Stream flow rate (in cfs) Stage hieght (in ft) Years data were taken Stream flow rate (in cfs)


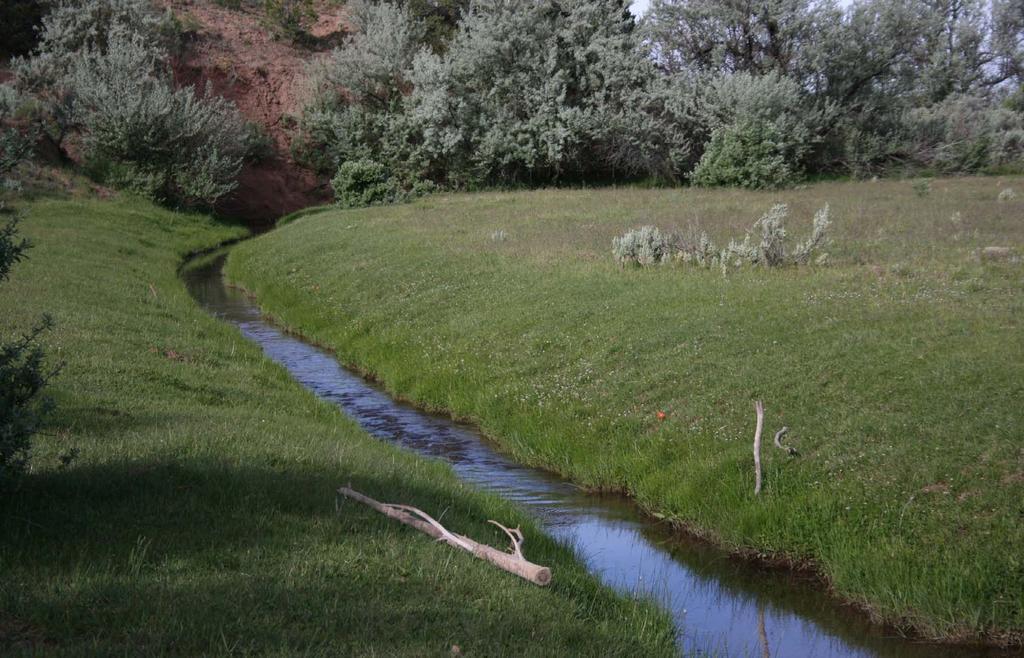
17 TSAILE CREEK: GAUGE CONDITION This stream gauge is located in a very stable and clean reach and there are no problems associated with channel aggradation or degradation nor with sediment accumulation. The only problem is that the instrument is not calibrated for flows that rise well above bankful stage.
18 TSAILE CREEK DATA The measured stream flow record for the gauge at Tsaile is sporadic like those in most of the other NDWR- operated gauges. However the condition of the stream makes the stage-discharge points on the right look good. Stream flow rate chart at Tsaile Stage-discharge relationship at Tsaile stream gauging station Stream flow rate (in cfs) Stage height (in ft) Years in which stream discharge were recorded Stream flow rate (in cfs)

 18 16 14 12 1 8 6 4 2 1989 199 1991 1992 1993 1995 1995 21 21 22 22 23 23 24 24 26 27 Years in which stream flow rate records were taken The higher correlation between stage")
19 WHEATFIELDS CREEK: GAUGE CONDITION Stream flow record at Wheatfieklds gauging station The gauge is in a stable cross-section. However there is a great deal of vegetation invasion above the bankful stage to affect the accuracy of a stream flow measurement. As in the other gauges, we do not have a continuous record to make much sense of the data. Stream flow rate (in cfs) Years in which stream flow rate records were taken The higher correlation between stage and discharge at low flows comopared to at higher flows is reflective of the stream cross-section. section. It is stable near the bottom of the stilling well but have vegetation at higher level. Stage-discharge relationship of stream flow at Wheatfield gauging station Daily stage height (in feet) Daily stream flow (in cfs)


20 LUKACHUKAI CREEK: GAUGE CONDITION As the data from the other gauging stations those from Lukachukai Creek have not folowed proper protocol to provide any important information on the stream flow nor can they be used in any modeling or decision-making scheme. Stream flow rate (in cfs) Stream flow record at Wheatfieklds gauging station Years in which stream flow rate records were taken The order less spread of the stage-discharge relationship points on the right hand side graph shows the poor gauging station condition. Large sediment accumulation and in-channel vegetation growth give a false high stage height. Stream flow stage (in ft) Stage-discharge relationship at Lukachukai Creek Stream flow discharge rate (in cfs) Observe the tremendous amount of sediment accumulation along the stream bed. There is also plenty of vegetation growth along the stream bed.


 Stage-discharge relationship at Captain Tom gauging station 3 2.5 2 1.5 1.")
21 CAPTAIN TOM CREEK: GAUGE CONDITION The are lots of boulders in the stream cross-section section where the stilling well is located. We could also see the sediment accumulation inside the stilling well. These along with the vegetation in the stream can Stream flow rate record chart at Captain Tom Creek affect the reliability of the flow data significantly Stream flow rate (in cfs) Stream flow stage height (in ft) Stage-discharge relationship at Captain Tom gauging station Stream flow discharge rate (in cfs Yearsin which stream flow records were taken

 16 14 12 1 8 6 4 Stream flow stage height (in ft) 2.5 2 1.5 1.")
22 KINLICHEE CREEK: GAUGE CONDITION The gauge at kinlichee Creek is located under a bridge which is stable with no vegetation growth and little sediment accumulation. The effect can be see in the near-perfect stage-discharge relationship curve below Stream flow stage-discharge relationship at kinlichee Creek Streamflow rate chart at Kinlichee Creek gauging station 3 18 Stream flow rate (in cfs) Stream flow stage height (in ft) Years stream flow rate measurement were taken Stream flow discharge rate (in cfs)

 Stage-discharge relationship at")
23 WHISKEY CREEK: GAUGE CONDITION Daily stream flow (in cfs) Stream flow record chart from Whiskey Creek gauging station Years in which stream flow measurements were taken The flume in this station has some vegetation growth problems, but it is relatively in good condition. The stage- discharge data on the right shows this relatively in good condition Daily gage height (in ft) Stage-discharge relationship at Whiskey Creek gauging station Daily stream flow rate (in cfs)
24 SOME CONCLUDING REMARKS The condition of the different streams in the Navajo Nation and the data gathered from those streams tell us many things. 1. The NDWR operated gauges do not provide useable data because: - the gauges are not well-maintained to provide reliable data - data are not gathered following USGS protocols and if they are - the data are not properly processed for any use from most of the gauges 2. The available gauges are concentrated in a small portion of the Nation to represent hydrologic conditions in the Navajo Nation 3. The main reasons we found out are lack of manpower and lack of funding to properly operate existing gauges, put new ones, process and make data available for various uses, and to train and hire technical personal to make all these possible. 4. The currently available work force (generally consisting of two hard working technicians) is too small to handle all weather, snow courses and stream flow instrumentation in the Nation.
25 SOME RECOMMENDATIONS Since availability of accurate and reliable stream flow data are important for the various reasons stated above, we recommend that: 1. The Navajo nation consider having adequate hydrological information a priority as many conditions such as flood forecasting, reservoir operation, agricultural and domestic water supply and drought management as well as wildlife and ecosystem maintenance depend on it; 1. The federal government through the USGS and other outlets support the Navajo Nation to have proper hydrological data collection, maintenance and processing capabilities to meet its needs; 1. Develop a collaborative effort among local (Navajo) and relevant state and federal agencies to work together to ensure availability of needed hydrological information.
26 THANK YOU
Webinar and Weekly Summary February 15th, 2011
 Webinar and Weekly Summary February 15th, 2011 -Assessment of current water conditions - Precipitation Forecast - Recommendations for Drought Monitor Upper Colorado Normal Precipitation Upper Colorado
3.0 TECHNICAL FEASIBILITY
 3.0 TECHNICAL FEASIBILITY 3.1 INTRODUCTION To enable seasonal storage and release of water from Lake Wenatchee, an impoundment structure would need to be constructed on the lake outlet channel. The structure
REDWOOD VALLEY SUBAREA
 Independent Science Review Panel Conceptual Model of Watershed Hydrology, Surface Water and Groundwater Interactions and Stream Ecology for the Russian River Watershed Appendices A-1 APPENDIX A A-2 REDWOOD
2015 Fall Conditions Report
 2015 Fall Conditions Report Prepared by: Hydrologic Forecast Centre Date: December 21 st, 2015 Table of Contents Table of Figures... ii EXECUTIVE SUMMARY... 1 BACKGROUND... 2 SUMMER AND FALL PRECIPITATION...
2003 Water Year Wrap-Up and Look Ahead
 2003 Water Year Wrap-Up and Look Ahead Nolan Doesken Colorado Climate Center Prepared by Odie Bliss http://ccc.atmos.colostate.edu Colorado Average Annual Precipitation Map South Platte Average Precipitation
Science Standard 1: Students analyze monthly precipitation and temperature records, displayed in bar charts, collected in metric units (mm).
.") Title: Precipitation Patterns across the Globe NSF GK-12 Fellow: Terry Legg Type of Lesson: STEM Grade Level(s): 4 th - 7 th grade This activity can be tailored to older, more advanced students by having
Title: Precipitation Patterns across the Globe NSF GK-12 Fellow: Terry Legg Type of Lesson: STEM Grade Level(s): 4 th - 7 th grade This activity can be tailored to older, more advanced students by having
PRELIMINARY DRAFT FOR DISCUSSION PURPOSES
 Memorandum To: David Thompson From: John Haapala CC: Dan McDonald Bob Montgomery Date: February 24, 2003 File #: 1003551 Re: Lake Wenatchee Historic Water Levels, Operation Model, and Flood Operation This
Climate also has a large influence on how local ecosystems have evolved and how we interact with them.
 The Mississippi River in a Changing Climate By Paul Lehman, P.Eng., General Manager Mississippi Valley Conservation (This article originally appeared in the Mississippi Lakes Association s 212 Mississippi
2003 Moisture Outlook
 2003 Moisture Outlook Nolan Doesken and Roger Pielke, Sr. Colorado Climate Center Prepared by Tara Green and Odie Bliss http://climate.atmos.colostate.edu Through 1999 Through 1999 Fort Collins Total Water
A Review of the 2007 Water Year in Colorado
 A Review of the 2007 Water Year in Colorado Nolan Doesken Colorado Climate Center, CSU Mike Gillespie Snow Survey Division, USDA, NRCS Presented at the 28 th Annual AGU Hydrology Days, March 26, 2008,
GAMINGRE 8/1/ of 7
 FYE 09/30/92 JULY 92 0.00 254,550.00 0.00 0 0 0 0 0 0 0 0 0 254,550.00 0.00 0.00 0.00 0.00 254,550.00 AUG 10,616,710.31 5,299.95 845,656.83 84,565.68 61,084.86 23,480.82 339,734.73 135,893.89 67,946.95
Sedimentation in the Nile River
 Advanced Training Workshop on Reservoir Sedimentation Sedimentation in the Nile River Prof. Dr. Abdalla Abdelsalam Ahmed 10-16 Oct. 2007, IRTCES, Beijing, China CWR,Sudan 1 Water is essential for mankind
Illinois State Water Survey Division
 Illinois State Water Survey Division SURFACE WATER SECTION SWS Miscellaneous Publication 108 SEDIMENT YIELD AND ACCUMULATION IN THE LOWER CACHE RIVER by Misganaw Demissie Champaign, Illinois June 1989
Lower Tuolumne River Accretion (La Grange to Modesto) Estimated daily flows ( ) for the Operations Model Don Pedro Project Relicensing
 Estimated daily flows ( ) for the Operations Model Don Pedro Project Relicensing") Lower Tuolumne River Accretion (La Grange to Modesto) Estimated daily flows (1970-2010) for the Operations Model Don Pedro Project Relicensing 1.0 Objective Using available data, develop a daily time series
Lower Tuolumne River Accretion (La Grange to Modesto) Estimated daily flows (1970-2010) for the Operations Model Don Pedro Project Relicensing 1.0 Objective Using available data, develop a daily time series
FORECAST-BASED OPERATIONS AT FOLSOM DAM AND LAKE
 FORECAST-BASED OPERATIONS AT FOLSOM DAM AND LAKE 255 237 237 237 217 217 217 200 200 200 0 163 131 Bridging the Gap163Conference 255 0 132 255 0 163 122 The Dana on Mission Bay San Diego, CA January 28,
Missouri River Basin Water Management
 Missouri River Basin Water Management US Army Corps of Engineers Missouri River Navigator s Meeting February 12, 2014 Bill Doan, P.E. Missouri River Basin Water Management US Army Corps of Engineers BUILDING
Colorado s 2003 Moisture Outlook
 Colorado s 2003 Moisture Outlook Nolan Doesken and Roger Pielke, Sr. Colorado Climate Center Prepared by Tara Green and Odie Bliss http://climate.atmos.colostate.edu How we got into this drought! Fort
Disentangling Impacts of Climate & Land Use Changes on the Quantity & Quality of River Flows in Southern Ontario
 Disentangling Impacts of Climate & Land Use Changes on the Quantity & Quality of River Flows in Southern Ontario by Trevor Dickinson & Ramesh Rudra, Water Resources Engineering University of Guelph Acknowledgements
Highlights of the 2006 Water Year in Colorado
 Highlights of the 2006 Water Year in Colorado Nolan Doesken, State Climatologist Atmospheric Science Department Colorado State University http://ccc.atmos.colostate.edu Presented to 61 st Annual Meeting
The Colorado Drought : 2003: A Growing Concern. Roger Pielke, Sr. Colorado Climate Center.
 The Colorado Drought 2001-2003: 2003: A Growing Concern Roger Pielke, Sr. Colorado Climate Center Prepared by Tara Green and Odie Bliss http://climate.atmos.colostate.edu 2 2002 Drought History in Colorado
Water Management for Environmental Restoration Flows In the Big Bend reach, Rio Grande Rio Bravo
 University of California, Davis Department of Land, Air and Water Resources Water Management for Environmental Restoration Flows In the Big Bend reach, Rio Grande Rio Bravo 46 th Annual Meeting 8 9 March,
Variability of Reference Evapotranspiration Across Nebraska
 Know how. Know now. EC733 Variability of Reference Evapotranspiration Across Nebraska Suat Irmak, Extension Soil and Water Resources and Irrigation Specialist Kari E. Skaggs, Research Associate, Biological
Stream Discharge and the Water Budget
 Regents Earth Science Unit 6: Water Cycle & Climate Name: Lab # Stream Discharge and the Water Budget Introduction: The United States Geological Survey (USGS) measures and publishes values for the daily
HYDROLOGIC AND WATER RESOURCES EVALUATIONS FOR SG. LUI WATERSHED
 HYDROLOGIC AND WATER RESOURCES EVALUATIONS FOR SG. LUI WATERSHED 1.0 Introduction The Sg. Lui watershed is the upper part of Langat River Basin, in the state of Selangor which located approximately 20
Typical Hydrologic Period Report (Final)
") (DELCORA) (Final) November 2015 (Updated April 2016) CSO Long-Term Control Plant Update REVISION CONTROL REV. NO. DATE ISSUED PREPARED BY DESCRIPTION OF CHANGES 1 4/26/16 Greeley and Hansen Pg. 1-3,
(DELCORA) (Final) November 2015 (Updated April 2016) CSO Long-Term Control Plant Update REVISION CONTROL REV. NO. DATE ISSUED PREPARED BY DESCRIPTION OF CHANGES 1 4/26/16 Greeley and Hansen Pg. 1-3,
Chiang Rai Province CC Threat overview AAS1109 Mekong ARCC
 Chiang Rai Province CC Threat overview AAS1109 Mekong ARCC This threat overview relies on projections of future climate change in the Mekong Basin for the period 2045-2069 compared to a baseline of 1980-2005.
APPLICATIONS OF DOWNSCALING: HYDROLOGY AND WATER RESOURCES EXAMPLES
 APPLICATIONS OF DOWNSCALING: HYDROLOGY AND WATER RESOURCES EXAMPLES Dennis P. Lettenmaier Department of Civil and Environmental Engineering For presentation at Workshop on Regional Climate Research NCAR
WHEN IS IT EVER GOING TO RAIN? Table of Average Annual Rainfall and Rainfall For Selected Arizona Cities
 WHEN IS IT EVER GOING TO RAIN? Table of Average Annual Rainfall and 2001-2002 Rainfall For Selected Arizona Cities Phoenix Tucson Flagstaff Avg. 2001-2002 Avg. 2001-2002 Avg. 2001-2002 October 0.7 0.0
MARMOT CREEK BASIN: MANAGING FORESTS FOR WATER
 MARMOT CREEK BASIN: MANAGING FORESTS FOR WATER CABIN AND TWIN CREEK EXPERIMENTS 1962-1987 MARMOT CREEK SUBBASINS Subbasin Drainage Treatment Area (ha) (completion date) Cabin Creek 212 (50%)* Commercial
Evapo-transpiration Losses Produced by Irrigation in the Snake River Basin, Idaho
 Nov 7, 2007 DRAFT Evapo-transpiration Losses Produced by Irrigation in the Snake River Basin, Idaho Wendell Tangborn and Birbal Rana HyMet Inc. Vashon Island, WA Abstract An estimated 8 MAF (million acre-feet)
The Colorado Drought of 2002 in Perspective
 The Colorado Drought of 2002 in Perspective Colorado Climate Center Nolan Doesken and Roger Pielke, Sr. Prepared by Tara Green and Odie Bliss http://climate.atmos.colostate.edu Known Characteristics of
Hydrogeology and Simulated Effects of Future Water Use and Drought in the North Fork Red River Alluvial Aquifer: Progress Report
 Hydrogeology and Simulated Effects of Future Water Use and Drought in the North Fork Red River Alluvial Aquifer: Progress Report Developed in partnership with the Oklahoma Water Resources Board S. Jerrod
Drought in Southeast Colorado
 Drought in Southeast Colorado Nolan Doesken and Roger Pielke, Sr. Colorado Climate Center Prepared by Tara Green and Odie Bliss http://climate.atmos.colostate.edu 1 Historical Perspective on Drought Tourism
February 10, Mr. Jeff Smith, Chairman Imperial Valley Water Authority E County Road 1000 N Easton, IL Dear Chairman Smith:
 February 1, 1 Mr. Jeff Smith, Chairman Imperial Valley Water Authority 8 E County Road 1 N Easton, IL Dear Chairman Smith: The Illinois State Water Survey (ISWS), under contract to the Imperial Valley
Drought and Future Water for Southern New Mexico
 Drought and Future Water for Southern New Mexico David S. Gutzler University of New Mexico gutzler@unm.edu * The big drought of 2018 * Longer term challenges for water supply * Forecasting streamflow Elephant
-Assessment of current water conditions. - Precipitation Forecast. - Recommendations for Drought Monitor
 June 1, 2010 -Assessment of current water conditions - Precipitation Forecast - Recommendations for Drought Monitor Snotel WYTD Precipitation as Percentage of Average Upper Colorado Headwaters 88% of
Folsom Dam Water Control Manual Update Joint Federal Project, Folsom Dam
 Folsom Dam Water Control Manual Update Joint Federal Project, Folsom Dam Public Workshop May 28, 2015 Library Galleria 828 I Street, Sacramento, CA US Army Corps of Engineers BUILDING STRONG WELCOME &
Hands On Applications of the Latin American and Caribbean Flood and Drought Monitor (LACFDM)
") Hands On Applications of the Latin American and Caribbean Flood and Drought Monitor (LACFDM) Colby Fisher, Eric F Wood, Justin Sheffield, Nate Chaney Princeton University International Training: Application
Hands On Applications of the Latin American and Caribbean Flood and Drought Monitor (LACFDM) Colby Fisher, Eric F Wood, Justin Sheffield, Nate Chaney Princeton University International Training: Application
CoCoRaHS Monitoring Colorado s s Water Resources through Community Collaborations
 CoCoRaHS Monitoring Colorado s s Water Resources through Community Collaborations Nolan Doesken Colorado Climate Center Atmospheric Science Department Colorado State University Presented at Sustaining
What Does It Take to Get Out of Drought?
 What Does It Take to Get Out of Drought? Nolan J. Doesken Colorado Climate Center Colorado State University http://ccc.atmos.colostate.edu Presented at the Insects, Diseases and Drought Workshop, May 19,
Folsom Dam Water Control Manual Update Joint Federal Project, Folsom Dam
 Folsom Dam Water Control Manual Update Joint Federal Project, Folsom Dam Public Workshop May 25, 2016 Sacramento Library Galleria 828 I Street, Sacramento, CA US Army Corps of Engineers BUILDING STRONG
Presentation Overview. Southwestern Climate: Past, present and future. Global Energy Balance. What is climate?
 Southwestern Climate: Past, present and future Mike Crimmins Climate Science Extension Specialist Dept. of Soil, Water, & Env. Science & Arizona Cooperative Extension The University of Arizona Presentation
YACT (Yet Another Climate Tool)? The SPI Explorer
? The SPI Explorer") YACT (Yet Another Climate Tool)? The SPI Explorer Mike Crimmins Assoc. Professor/Extension Specialist Dept. of Soil, Water, & Environmental Science The University of Arizona Yes, another climate tool for
YACT (Yet Another Climate Tool)? The SPI Explorer Mike Crimmins Assoc. Professor/Extension Specialist Dept. of Soil, Water, & Environmental Science The University of Arizona Yes, another climate tool for
Seasonal Hydrometeorological Ensemble Prediction System: Forecast of Irrigation Potentials in Denmark
 Seasonal Hydrometeorological Ensemble Prediction System: Forecast of Irrigation Potentials in Denmark Diana Lucatero 1*, Henrik Madsen 2, Karsten H. Jensen 1, Jens C. Refsgaard 3, Jacob Kidmose 3 1 University
2. PHYSICAL SETTING FINAL GROUNDWATER MANAGEMENT PLAN. 2.1 Topography. 2.2 Climate
 FINAL GROUNDWATER MANAGEMENT PLAN 2. PHYSICAL SETTING Lassen County is a topographically diverse area at the confluence of the Cascade Range, Modoc Plateau, Sierra Nevada and Basin and Range geologic provinces.
Changing Hydrology under a Changing Climate for a Coastal Plain Watershed
 Changing Hydrology under a Changing Climate for a Coastal Plain Watershed David Bosch USDA-ARS, Tifton, GA Jeff Arnold ARS Temple, TX and Peter Allen Baylor University, TX SEWRU Objectives 1. Project changes
San Francisco Public Utilities Commission Hydrological Conditions Report For April 2014
 San Francisco Public Utilities Commission Hydrological Conditions Report For April 2014 J. Chester, C. Graham, A. Mazurkiewicz, & M. Tsang, May 13, 2014 Snow in the High Country The view from Bond Pass
Streamflow, Sediment, and Nutrient Simulation of the Bitterroot Watershed using SWAT
 Streamflow, Sediment, and Nutrient Simulation of the Bitterroot Watershed using SWAT by Dr. Michael Van Liew Montana Department of Environmental Quality Helena, Montana, USA Site Map of SWAT Watersheds
Missouri River Basin Water Management Monthly Update
 Missouri River Basin Water Management Monthly Update Participating Agencies 255 255 255 237 237 237 0 0 0 217 217 217 163 163 163 200 200 200 131 132 122 239 65 53 80 119 27 National Oceanic and Atmospheric
San Francisco Public Utilities Commission Hydrological Conditions Report For March 2016
 San Francisco Public Utilities Commission Hydrological Conditions Report For March 2016 J. Chester, C. Graham, A. Mazurkiewicz, & M. Tsang, April 7, 2016 Snow Surveyor Chris Graham crossing Huckleberry
Applications/Users for Improved S2S Forecasts
 Applications/Users for Improved S2S Forecasts Nolan Doesken Colorado Climate Center Colorado State University WSWC Precipitation Forecasting Workshop June 7-9, 2016 San Diego, CA First -- A short background
What is the difference between Weather and Climate?
 What is the difference between Weather and Climate? Objective Many people are confused about the difference between weather and climate. This makes understanding the difference between weather forecasts
Unconventional Wisdom and the Effects of Dams on Downstream Coarse Sediment Supply. Byron Amerson, Jay Stallman, John Wooster, and Derek Booth
 Unconventional Wisdom and the Effects of Dams on Downstream Coarse Sediment Supply 3 February 2009 Byron Amerson, Jay Stallman, John Wooster, and Derek Booth Sultan River, WA OBJECTIVE Consider the landscape
Management of Natural and Environmental Resources for Sustainable Agricultural Development
 World Meteorological Organization (WMO) Management of Natural and Environmental Resources for Sustainable Agricultural Development Use of the Object Modeling System for Operational Water Supply Forecasting
Missouri River Basin Water Management Monthly Update
 Missouri River Basin Water Management Monthly Update Participating Agencies 255 255 255 237 237 237 0 0 0 217 217 217 163 163 163 200 200 200 131 132 122 239 65 53 80 119 27 National Oceanic and Atmospheric
President s Day Weekend Storm Community Meeting and Workshop April 17, 2017
 President s Day Weekend Storm Community Meeting and Workshop April 17, 2017 Meeting outline 1. Progress update on the City of San Jose s recovery efforts 2. Water district presentation on: Weather situation
January 22, Coronado National Forest 300 West Congress Street Tucson, AZ Jim Upchurch, Forest Supervisor. Dear Mr.
 January 22, 2015 Coronado National Forest 300 West Congress Street Tucson, AZ 85701 Attn: Jim Upchurch, Forest Supervisor Dear Mr. Upchurch: In your letter dated January 16, 2015, you requested that Hudbay
The Huong River the nature, climate, hydro-meteorological issues and the AWCI demonstration project
 The Huong River the nature, climate, hydro-meteorological issues and the AWCI demonstration project 7th GEOSS AP Symposium, the AWCI parallel session May 27, 214, Tokyo National Centre for Hydro-Meteorological
Assessing bias in satellite rainfall products and their impact in water balance closure at the Zambezi headwaters
 Assessing bias in satellite rainfall products and their impact in water balance closure at the Zambezi headwaters Omondi C.K. 1 Rientjes T.H.M. 1, Haile T.A. 2, Gumindoga W. 1,3 (1) Faculty ITC, University
Time Series Analysis
 Time Series Analysis A time series is a sequence of observations made: 1) over a continuous time interval, 2) of successive measurements across that interval, 3) using equal spacing between consecutive
Modeling of a River Basin Using SWAT Model and SUFI-2
 Modeling of a River Basin Using SWAT Model and SUFI-2 NINA OMANI MASOUD TAJRISHY AHMAD ABRISHAMCHI Sharif University of Technology, Tehran, Iran Karkheh Dam, Iran 1 Area of Gharasu Sub-basin : 5793 km2
Missouri River Basin Water Management Monthly Update
 Missouri River Basin Water Management Monthly Update Participating Agencies 255 255 255 237 237 237 0 0 0 217 217 217 163 163 163 200 200 200 131 132 122 239 65 53 80 119 27 National Oceanic and Atmospheric
Climatography of the United States No
 Climate Division: AK 5 NWS Call Sign: ANC Month (1) Min (2) Month(1) Extremes Lowest (2) Temperature ( F) Lowest Month(1) Degree s (1) Base Temp 65 Heating Cooling 90 Number of s (3) Jan 22.2 9.3 15.8
Forecast Challenges for the Colorado Basin River Forecast Center
 Forecast Challenges for the Colorado Basin River Forecast Center John Lhotak, Development and Operations Hydrologist Improving Sub-Seasonal to Seasonal (S2S) Workshop May 16th, 2018 1 River Forecast Centers
9. PROBABLE MAXIMUM PRECIPITATION AND PROBABLE MAXIMUM FLOOD
 9. PROBABLE MAXIMUM PRECIPITATION AND PROBABLE MAXIMUM FLOOD 9.1. Introduction Due to the size of Watana Dam and the economic importance of the Project to the Railbelt, the Probable Maximum Flood (PMF)
Algae and Dissolved Oxygen Dynamics of Landa Lake and the Upper Spring Run
 Algae and Dissolved Oxygen Dynamics of Landa Lake and the Upper Spring Run Why study algae and dissolved oxygen dynamics of Landa Lake and the Upper Spring Run? During low-flow conditions, extensive algal
WATER AVAILABILITY ASSESSMENT IN SHIPRA RIVER
 WATER AVAILABILITY ASSESSMENT IN SHIPRA RIVER K. Satish Kumar, H.L. Tiwari, R.V. Galkate M. Tech Student, Department of Civil Engineering, Maulana Azad National Institute of Technology, Bhopal, INDIA Assistant
Jackson County 2018 Weather Data 67 Years of Weather Data Recorded at the UF/IFAS Marianna North Florida Research and Education Center
 Jackson County 2018 Weather Data 67 Years of Weather Data Recorded at the UF/IFAS Marianna North Florida Research and Education Center Doug Mayo Jackson County Extension Director 1952-2008 Rainfall Data
CHAPTER 2 SOLUTIONS. Given: 333 houses; AWWA household average demand. a. The AWWA average household water use is 1,320 L/d
 CHAPTER 2 SOLUTIONS 2-1 Subdivision Demand Given: 333 houses; AWWA household average demand a. The AWWA average household water use is 1,320 L/d b. For the average day (333 houses)(1,320 L/d) = 439, 560
ZUMWALT WEATHER AND CLIMATE ANNUAL REPORT ( )
") ZUMWALT WEATHER AND CLIMATE ANNUAL REPORT (26-29) FINAL DRAFT (9 AUGUST 21) J.D. HANSEN 1, R.V. TAYLOR 2, AND V.S. JANSEN 3 INTRODUCTION The Zumwalt Prairie in northeastern Oregon is a unique grassland
ZUMWALT WEATHER AND CLIMATE ANNUAL REPORT (26-29) FINAL DRAFT (9 AUGUST 21) J.D. HANSEN 1, R.V. TAYLOR 2, AND V.S. JANSEN 3 INTRODUCTION The Zumwalt Prairie in northeastern Oregon is a unique grassland
FINAL STREAM. Prepared For: Discharge. Draft Stream. Level Hay Street, Subiaco WA Indiana Street. Golden, CO USA
 Draft Stream Discharge and Water Supply Estimates S F FINAL STREAM DISCHARGE AND WATER SUPPLYS ESTIMATES CITRONEN FJORD F DEVELOPMENT PROJECT Prepared For: Ironbark Zinc Limited Level 1 350 Hay Street,
Climate Change and Water Supply Research. Drought Response Workshop October 8, 2013
 Climate Change and Water Supply Research Drought Response Workshop October 8, 2013 DWR Photo Oroville Reservoir, 2009 Talk Overview Expectations History Atmospheric Rivers and Water Supply Current Research
Jackson County 2013 Weather Data
 Jackson County 2013 Weather Data 61 Years of Weather Data Recorded at the UF/IFAS Marianna North Florida Research and Education Center Doug Mayo Jackson County Extension Director 1952-2008 Rainfall Data
Fenhe (Fen He) Map of River. Table of Basic Data. China 10
 Map of River. Table of Basic Data. China 10") Fenhe (Fen He) Map of River Table of Basic Data Name(s): Fenhe (in Huanghe River) Location: Shanxi Province, Northern China Area: 39,471 km 2 Origin: Mt. Guancen (2,147 m) Outlet: Huanghe Serial No. :
Fenhe (Fen He) Map of River Table of Basic Data Name(s): Fenhe (in Huanghe River) Location: Shanxi Province, Northern China Area: 39,471 km 2 Origin: Mt. Guancen (2,147 m) Outlet: Huanghe Serial No. :
Long-term Precipitation Trends in Colorado. Nolan Doesken Colorado State Climatologist Presented: Friday, December 12, 2008
 Long-term Precipitation Trends in Colorado Nolan Doesken Colorado State Climatologist Presented: Friday, December 12, 28 Colorado Mean Annual Precipitation (1971-2) Of All Our Climate Observing Stations
HYDROLOGICAL MODELING OF HIGHLY GLACIERIZED RIVER BASINS. Nina Omani, Raghavan Srinivasan, Patricia Smith, Raghupathy Karthikeyan, Gerald North
 HYDROLOGICAL MODELING OF HIGHLY GLACIERIZED RIVER BASINS Nina Omani, Raghavan Srinivasan, Patricia Smith, Raghupathy Karthikeyan, Gerald North Problem statement Glaciers help to keep the earth cool High
Climate Impacts to Southwest Water Sector. Dr. Dave DuBois New Mexico State Climatologist
 Climate Impacts to Southwest Water Sector Dr. Dave DuBois New Mexico State Climatologist Presented at EPA Extreme Events and Climate Adaptation Planning Workshop June 3, 2015 Water Year Precip. % of Average
Integrating Weather Forecasts into Folsom Reservoir Operations
 Integrating Weather Forecasts into Folsom Reservoir Operations California Extreme Precipitation Symposium September 6, 2016 Brad Moore, PE US Army Corps of Engineers Biography Brad Moore is a Lead Civil
Big Wood River. General Information
 General Information The flows out of the southern portion of the Sawtooth National Recreation Area in central Idaho. The study reach is about a,200 ft length of river about.5 miles upstream from the discontinued
A Report on a Statistical Model to Forecast Seasonal Inflows to Cowichan Lake
 A Report on a Statistical Model to Forecast Seasonal Inflows to Cowichan Lake Prepared by: Allan Chapman, MSc, PGeo Hydrologist, Chapman Geoscience Ltd., and Former Head, BC River Forecast Centre Victoria
National Integrated Drought Information System. Southeast US Pilot for Apalachicola- Flint-Chattahoochee River Basin 20-March-2012
 National Integrated Drought Information System Southeast US Pilot for Apalachicola- Flint-Chattahoochee River Basin 20-March-2012 Current drought status from Drought Monitor http://www.drought.unl.edu/dm/monitor.html
NIDIS Intermountain West Drought Early Warning System November 14, 2017
 NIDIS Intermountain West Drought Early Warning System November 14, 2017 Precipitation The images above use daily precipitation statistics from NWS COOP, CoCoRaHS, and CoAgMet stations. From top to bottom,
Missouri River Basin Climate Outlook 1 May Dr. Dennis Todey State Climatologist South Dakota State Univ.
 Missouri River Basin Climate Outlook 1 May 2014 Dr. Dennis Todey State Climatologist South Dakota State Univ. dennis.todey@sdstate.edu 605-688-5141 Photo taken Feb 19, 2013 General Information Providing
Colorado Water Supply Outlook Report April 1, 2016
 Colorado Water Supply Outlook Report April 1, 216 Kevin Houck and Allison Franz of the Colorado Water Conservation Board measure the Willow Creek Pass snow course. This snow course recorded 129% of normal
Flooding. April 21, Notes 4/20 CONGRATULATIONS!!!!! Activity 2: AZ State Museum due TODAY. Extra Credit 2: Returned at end of class
 April 21, 2011 Flooding 1927 Mississippi Flood Notes 4/20 Activity 2: AZ State Museum due TODAY Extra Credit 2: Returned at end of class CONGRATULATIONS!!!!! Andrew Richard Undergraduate Research Grant
NIDIS Intermountain West Drought Early Warning System December 11, 2018
 NIDIS Drought and Water Assessment NIDIS Intermountain West Drought Early Warning System December 11, 2018 Precipitation The images above use daily precipitation statistics from NWS COOP, CoCoRaHS, and
Attachment B to Technical Memorandum No.2. Operations Plan of Ross Valley Detention Basins
 Attachment B to Technical Memorandum No.2 Operations Plan of Ross Valley Detention Basins Operations Plan of Ross Valley Detention Basins Stetson Engineers Inc. January 26, 2011 1.0 Introduction Achieving
Updated 2018 Restoration Allocation & Default Flow Schedule February 16, 2018
 Updated 2018 Restoration Allocation & Default Schedule February 16, 2018 Bureau of Reclamation 2800 Cottage Way, MP-170 Sacramento, California 95825 Introduction The following transmits the updated 2018
Global Climates. Name Date
 Global Climates Name Date No investigation of the atmosphere is complete without examining the global distribution of the major atmospheric elements and the impact that humans have on weather and climate.
Geostatistical Analysis of Rainfall Temperature and Evaporation Data of Owerri for Ten Years
 Atmospheric and Climate Sciences, 2012, 2, 196-205 http://dx.doi.org/10.4236/acs.2012.22020 Published Online April 2012 (http://www.scirp.org/journal/acs) Geostatistical Analysis of Rainfall Temperature
NIDIS Drought and Water Assessment
 NIDIS Drought and Water Assessment PRECIPITATION The images above use daily precipitation statistics from NWS COOP, CoCoRaHS, and CoAgMet stations. From top to bottom, and left to right: most recent 7-days
Communicating Climate Change Consequences for Land Use
 Communicating Climate Change Consequences for Land Use Site: Prabost, Skye. Event: Kyle of Lochalsh, 28 th February 28 Further information: http://www.macaulay.ac.uk/ladss/comm_cc_consequences.html Who
DROUGHT IN MAINLAND PORTUGAL
 DROUGHT IN MAINLAND Ministério da Ciência, Tecnologia e Ensino Superior Instituto de Meteorologia, I. P. Rua C Aeroporto de Lisboa Tel.: (351) 21 844 7000 e-mail:informacoes@meteo.pt 1749-077 Lisboa Portugal
Climatic and Ecological Conditions in the Klamath Basin of Southern Oregon and Northern California: Projections for the Future
 Climatic and Ecological Conditions in the Klamath Basin of Southern Oregon and Northern California: Projections for the Future A Collaborative Effort by: CLIMATE LEADERSHIP INITIATIVE INSTITUTE FOR A SUSTAINABLE
January 25, Summary
 January 25, 2013 Summary Precipitation since the December 17, 2012, Drought Update has been slightly below average in parts of central and northern Illinois and above average in southern Illinois. Soil
N 2 3. Lake Huron. St. Clair River. Black River Assessment. Figure 1. Major tributaries to the Black River. 1. Berry Drain 2. Elk Creek.
 1. Berry Drain 2. Elk Creek Deckerville 3. Arnot Creek 4. Black Creek 5. Silver Creek 6. Plum Creek 7. Mill Creek 1 Sandusky Carsonville 8. Stocks Creek Applegate N 2 3 Croswell Peck 0 5 10 Brown City
Midwest and Great Plains Climate and Drought Update
 Midwest and Great Plains Climate and Drought Update June 20,2013 Laura Edwards Climate Field Specialist Laura.edwards@sdstate.edu 605-626-2870 2012 Board of Regents, South Dakota State University General
NATIONAL HYDROPOWER ASSOCIATION MEETING. December 3, 2008 Birmingham Alabama. Roger McNeil Service Hydrologist NWS Birmingham Alabama
 NATIONAL HYDROPOWER ASSOCIATION MEETING December 3, 2008 Birmingham Alabama Roger McNeil Service Hydrologist NWS Birmingham Alabama There are three commonly described types of Drought: Meteorological drought
Incorporating Large-Scale Climate Information in Water Resources Decision Making
 Incorporating Large-Scale Climate Information in Water Resources Decision Making Balaji Rajagopalan Dept. of Civil, Env.. And Arch. Engg.. And CIRES Katrina Grantz, Edith Zagona (CADSWES) Martyn Clark
Impacts of climate change on flooding in the river Meuse
 Impacts of climate change on flooding in the river Meuse Martijn Booij University of Twente,, The Netherlands m.j.booij booij@utwente.nlnl 2003 in the Meuse basin Model appropriateness Appropriate model