Integrating Weather Forecasts into Folsom Reservoir Operations
|
|
|
- Silas Lloyd
- 5 years ago
- Views:
Transcription


1 Integrating Weather Forecasts into Folsom Reservoir Operations California Extreme Precipitation Symposium September 6, 2016 Brad Moore, PE US Army Corps of Engineers
2 Biography Brad Moore is a Lead Civil Engineer at the Sacramento District of the U.S. Army Corps of Engineers. He works in the Hydrology and Hydraulics Branch and is the Engineering Technical Lead for the Folsom Dam Water Control Manual Update. In addition to 10 years with the Sacramento District, he has 8 years experience in flood risk management in the Sacramento private sector. He holds a B.S. in Mechanical Engineering, M.S. in Hydrologic Science, and Civil P.E. license. 2
3 Abstract Completion of the Joint Federal Project spillway at Folsom Dam requires the U.S. Army Corps of Engineers to update the Folsom Water Control Manual. The manual defines the maximum allowable storage before flood releases are required and required flood releases when the allowable storage is exceeded. This presentation will describe the tentatively selected flood operation, which relies on inflow forecasts provided by the California Nevada River Forecast Center. The presentation will compare the operation to other alternatives, describe how forecast information is processed and used, and describe testing to account for forecast uncertainty. 3

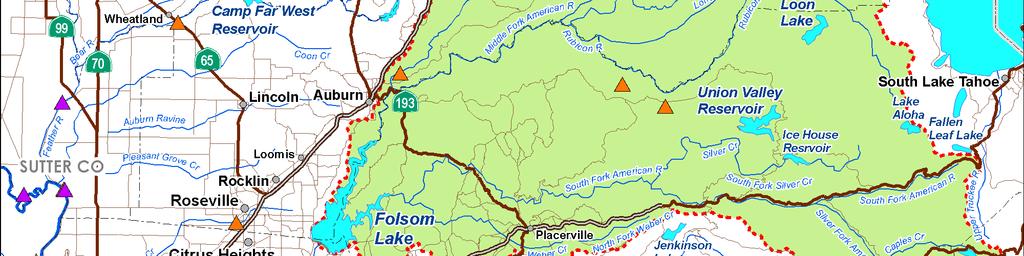
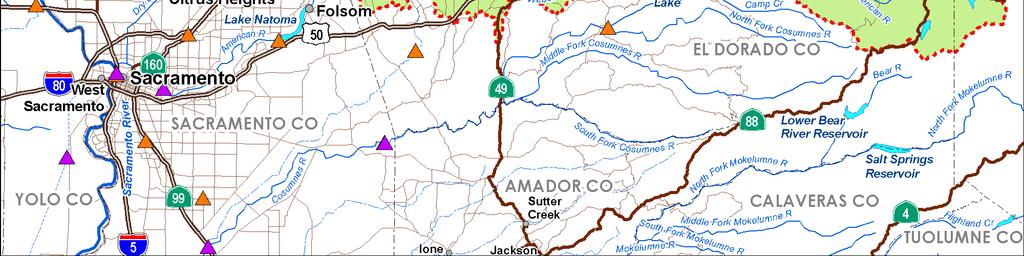
4 American River Basin 2
5 Folsom Lake and Dam 967 TAF storage (gross pool). Objective flood release is 115 kcfs. Channel capacity ~ 160 kcfs. Steep watershed most precip is in reservoir within 12 hours of hitting ground. Winter snow pack relied upon for Spring refill. No downstream control point. 5

6 Folsom Dam 6

7 JFP Gate Install 7
8 Main Dam and JFP 8
9 (no inflow) 9
 0 800 Storage (TAF) 600 400 Existing")


10 Water Control Diagrams 1,000 Flood Space (TAF) Storage (TAF) Existing (Corps) Basin Wetness Existing (BOR-SAFCA) Upstream Storage Credit JFP + Upstream Credit JFP + Forecast-based Oct Nov Dec Jan Feb Mar Apr May Jun Jul Aug Sep Oct 10
11 Forecast-based Operation Components CNRFC ensemble forecasts 6 hour updates Forecast-based top of conservation (TOC) Forecast-based releases 11
12 Forecast-based TOC DRAFT 12
13 Forecast-based TOC DRAFT 13


14 Forecast-based Release 115k 80k 50k 25k Typical American River Cross Section 14
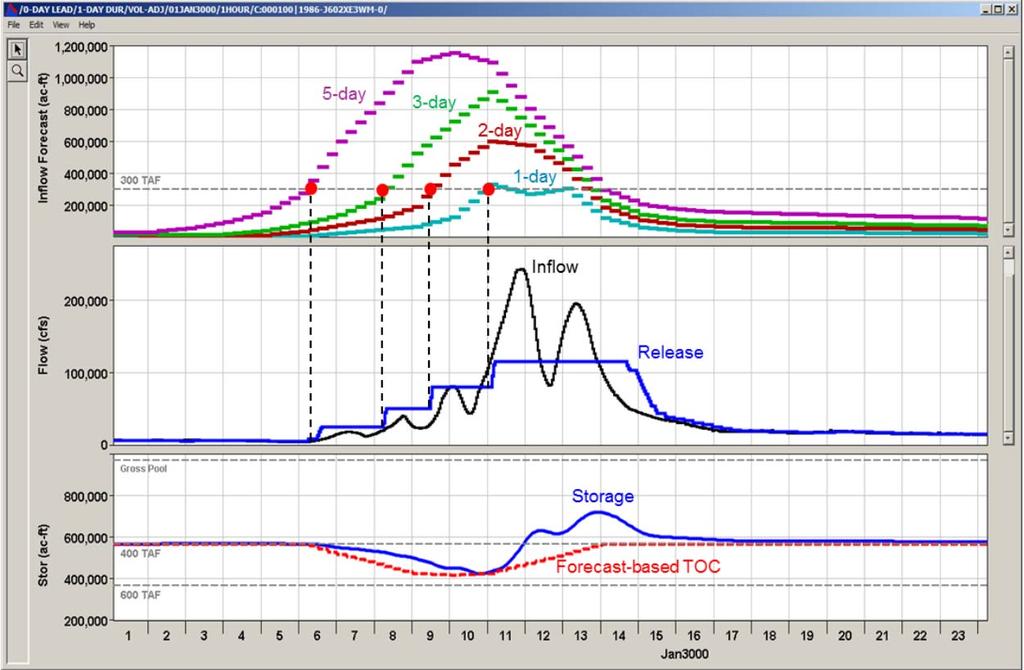
15 Forecast-based Release 15

16 Water Control Diagram 16 DRAFT
17 Routing comparisons 17
18 1986 event pattern scaled to 100-yr Forecast operation reflects perfect forecast Existing (BOR/SAFCA) JFP + US credit JFP + Forecast-based 18
19 1986 event pattern scaled to 200-yr Forecast operation reflects perfect forecast Existing (BOR/SAFCA) JFP + US credit JFP + Forecast-based 19
20 Use of Forecast Ensembles 20
21 Forecast Ensemble 12/22 61 ensemble traces 21
22 Forecast Ensemble 12/23 22
23 Forecast Ensemble 12/24 23
24 Forecast Ensemble 12/25 24
25 Forecast Ensemble 12/26 25
26 Forecast Ensemble 12/27 26
27 Forecast Ensemble 12/28 27
28 Forecast Ensemble 12/29 28
29 Forecast Ensemble 12/30 29
30 Forecast Ensemble 12/31 30
31 Forecast Ensemble 1/1 31
32 Forecast Ensemble 1/2 32
33 Forecast Ensemble 1/3 33

34 Compute Forecasted Inflow Volumes 1-day 2-day 3-day 5-day

35 1997 event hindcast series 3-day volume updated daily 61 ensemble traces 21 probabilistic traces Each trace reflects one value of Non- Exceedence Probability (NEP) 35

36 Robustness Testing Considers uncertainty in forecast indicated by the forecast ensemble. Tests operation using imperfect forecasts. Used to identify operational NEP value. 36
37 Robustness Test Example 1986 event pattern scaled to 200-yr 21 simulations corresponding to NEP values ranging from 0% to 100% (5% increments). Perfect forecast shown as black dashed line for reference. 37
38 Robustness Summary Metric Minimum NEP (%) (1986 / 1997 patterns) Pass 100-yr event at 115 kcfs Pass 200-yr event at 160 kcfs Pass 200-yr event at 160 kcfs (24-hr late forecast) 0% / 0% (ALL PASS) 0% / 0% (ALL PASS) 55% / 60% 38
39 Peak Flow-Frequency DRAFT See handout notes 39
40 Lessons Learned Simple vs. Complex Corps more comfortable with: designated (and limited) variable flood space work within TOC framework demonstrate well-behaved releases 40
41 Moving Forward Draft engineering report complete Agency Technical Review of final report Division / Headquarters / IEPR review 4/15/2017 final signatures 41
42 Questions? 42
FORECAST-BASED OPERATIONS AT FOLSOM DAM AND LAKE
 FORECAST-BASED OPERATIONS AT FOLSOM DAM AND LAKE 255 237 237 237 217 217 217 200 200 200 0 163 131 Bridging the Gap163Conference 255 0 132 255 0 163 122 The Dana on Mission Bay San Diego, CA January 28,
Folsom Dam Water Control Manual Update Joint Federal Project, Folsom Dam
 Folsom Dam Water Control Manual Update Joint Federal Project, Folsom Dam Public Workshop May 28, 2015 Library Galleria 828 I Street, Sacramento, CA US Army Corps of Engineers BUILDING STRONG WELCOME &
Folsom Dam Water Control Manual Update Joint Federal Project, Folsom Dam
 Folsom Dam Water Control Manual Update Joint Federal Project, Folsom Dam Public Workshop May 25, 2016 Sacramento Library Galleria 828 I Street, Sacramento, CA US Army Corps of Engineers BUILDING STRONG
Folsom Dam Water Control Manual Update
 Folsom Dam Water Control Manual Update Public Workshop April 3, 2014 Location: Sterling Hotel Ballroom 1300 H Street, Sacramento US Army Corps of Engineers BUILDING STRONG WELCOME & INTRODUCTIONS 2 BUILDING
2015 Fall Conditions Report
 2015 Fall Conditions Report Prepared by: Hydrologic Forecast Centre Date: December 21 st, 2015 Table of Contents Table of Figures... ii EXECUTIVE SUMMARY... 1 BACKGROUND... 2 SUMMER AND FALL PRECIPITATION...
NRC Workshop Probabilistic Flood Hazard Assessment (PFHA) Jan 29-31, Mel Schaefer Ph.D. P.E. MGS Engineering Consultants, Inc.
 Jan 29-31, Mel Schaefer Ph.D. P.E. MGS Engineering Consultants, Inc.") Stochastic Event Flood Model (SEFM) Stochastic Modeling of Extreme Floods A Hydrological Tool for Analysis of Extreme Floods Mel Schaefer Ph.D. P.E. MGS Engineering Consultants, Inc. Olympia, WA NRC Workshop
Stochastic Event Flood Model (SEFM) Stochastic Modeling of Extreme Floods A Hydrological Tool for Analysis of Extreme Floods Mel Schaefer Ph.D. P.E. MGS Engineering Consultants, Inc. Olympia, WA NRC Workshop
GAMINGRE 8/1/ of 7
 FYE 09/30/92 JULY 92 0.00 254,550.00 0.00 0 0 0 0 0 0 0 0 0 254,550.00 0.00 0.00 0.00 0.00 254,550.00 AUG 10,616,710.31 5,299.95 845,656.83 84,565.68 61,084.86 23,480.82 339,734.73 135,893.89 67,946.95
Modeling of peak inflow dates for a snowmelt dominated basin Evan Heisman. CVEN 6833: Advanced Data Analysis Fall 2012 Prof. Balaji Rajagopalan
 Modeling of peak inflow dates for a snowmelt dominated basin Evan Heisman CVEN 6833: Advanced Data Analysis Fall 2012 Prof. Balaji Rajagopalan The Dworshak reservoir, a project operated by the Army Corps
Proposal to limit Namakan Lake to 1970 Upper Rule Curve for remainder of summer
 July 7, 214 Subject: Proposal to limit Namakan Lake to 197 Upper Rule Curve for remainder of summer Background: Flooding in 214 has resulted in the highest water levels on Namakan Lake since 1968, and
Appendix E Plots from the Evaluation of the CNRFC Operational Hydrologic Model
 Appendix E Plots from the Evaluation of the CNRFC Operational Hydrologic Model APE-1 2 Trinity Lake Inflow 2 1 Simulated 1 1 1 2 2 Observed Figure APE-1. Simulated daily flow versus observed (FNF) flow
Evapo-transpiration Losses Produced by Irrigation in the Snake River Basin, Idaho
 Nov 7, 2007 DRAFT Evapo-transpiration Losses Produced by Irrigation in the Snake River Basin, Idaho Wendell Tangborn and Birbal Rana HyMet Inc. Vashon Island, WA Abstract An estimated 8 MAF (million acre-feet)
Missouri River Basin Water Management
 Missouri River Basin Water Management US Army Corps of Engineers Missouri River Navigator s Meeting February 12, 2014 Bill Doan, P.E. Missouri River Basin Water Management US Army Corps of Engineers BUILDING
 Water Supply Forecast - THE DALLES http://www.nwrfc.noaa.gov/water_supply/ws_forecasts.php?id=tdao3 Page 1 of 1 3/7/2013 Close Archive Data/Normals Rankings Adjustments Verification Verify All Years Help
Kootenai Basin Water Supply Update and Sturgeon Flow Augmentation Kootenai Valley Resource Initiative
 Kootenai Basin Water Supply Update and Sturgeon Flow Augmentation Kootenai Valley Resource Initiative Greg Hoffman Fishery Biologist / Kootenai River Basin Flood Engineer Libby Dam 15 May 2017 US Army
Attachment B to Technical Memorandum No.2. Operations Plan of Ross Valley Detention Basins
 Attachment B to Technical Memorandum No.2 Operations Plan of Ross Valley Detention Basins Operations Plan of Ross Valley Detention Basins Stetson Engineers Inc. January 26, 2011 1.0 Introduction Achieving
PRELIMINARY DRAFT FOR DISCUSSION PURPOSES
 Memorandum To: David Thompson From: John Haapala CC: Dan McDonald Bob Montgomery Date: February 24, 2003 File #: 1003551 Re: Lake Wenatchee Historic Water Levels, Operation Model, and Flood Operation This
San Francisco Public Utilities Commission Hydrological Conditions Report For April 2014
 San Francisco Public Utilities Commission Hydrological Conditions Report For April 2014 J. Chester, C. Graham, A. Mazurkiewicz, & M. Tsang, May 13, 2014 Snow in the High Country The view from Bond Pass
9. PROBABLE MAXIMUM PRECIPITATION AND PROBABLE MAXIMUM FLOOD
 9. PROBABLE MAXIMUM PRECIPITATION AND PROBABLE MAXIMUM FLOOD 9.1. Introduction Due to the size of Watana Dam and the economic importance of the Project to the Railbelt, the Probable Maximum Flood (PMF)
Missouri River Basin Water Management Monthly Update
 Missouri River Basin Water Management Monthly Update Participating Agencies 255 255 255 237 237 237 0 0 0 217 217 217 163 163 163 200 200 200 131 132 122 239 65 53 80 119 27 National Oceanic and Atmospheric
Missouri River Basin Water Management Monthly Update
 Missouri River Basin Water Management Monthly Update Participating Agencies 255 255 255 237 237 237 0 0 0 217 217 217 163 163 163 200 200 200 131 132 122 239 65 53 80 119 27 National Oceanic and Atmospheric
APR-SEP. Forecast Are in KAF % Average 10 % 30 Year. Forecast Period
 Water Supply Forecast - THE DALLES file://v:\nwrfc_forecast\2013\tdao3\04-05.html Page 1 of 1 4/8/2013 Header for Water Supply Information Page Close Archive Data/Normals Rankings Adjustments Verification
Operator and Modeler Collaboration on Truckee- Carson River Operations Using Ensembles River Ware User Group Meeting Thursday February 1, 2018
 Operator and Modeler Collaboration on Truckee- Carson River Operations Using Ensembles River Ware User Group Meeting Thursday February 1, 2018 Caleb Erkman, P.E. PWRE David Wathen Deputy TROA Administrator
AN OVERVIEW OF ENSEMBLE STREAMFLOW PREDICTION STUDIES IN KOREA
 AN OVERVIEW OF ENSEMBLE STREAMFLOW PREDICTION STUDIES IN KOREA DAE-IL JEONG, YOUNG-OH KIM School of Civil, Urban & Geosystems Engineering, Seoul National University, San 56-1, Sillim-dong, Gwanak-gu, Seoul,
Albeni Falls Operations Meeting 2015
 Albeni Falls Operations Meeting 2015 Katherine Rowden NWS Joel Fenolio Corps of Engineers Agenda Introductions Drought-Weather Conditions Free flow operations Review of Clarified Operations Albeni Falls
Missouri River Basin Water Management Monthly Update
 Missouri River Basin Water Management Monthly Update Participating Agencies 255 255 255 237 237 237 0 0 0 217 217 217 163 163 163 200 200 200 131 132 122 239 65 53 80 119 27 National Oceanic and Atmospheric
California Nevada River Forecast Center Updates
 California Nevada River Forecast Center Updates Alert Users Group Meeting Riverside County Flood Control and Water Conservation District October 16 th, 2014 Alan Haynes Service Coordination Hydrologist
Impacts of climate change on flooding in the river Meuse
 Impacts of climate change on flooding in the river Meuse Martijn Booij University of Twente,, The Netherlands m.j.booij booij@utwente.nlnl 2003 in the Meuse basin Model appropriateness Appropriate model
Updated 2018 Restoration Allocation & Default Flow Schedule May 22, 2018
 Updated 2018 Restoration Allocation & Default Schedule May 22, 2018 Bureau of Reclamation 2800 Cottage Way, MP-170 Sacramento, California 95825 Introduction The following transmits the updated 2018 Restoration
USA National Weather Service Community Hydrologic Prediction System
 USA National Weather Service Community Hydrologic Prediction System Rob Hartman Hydrologist in Charge NOAA / National Weather Service California-Nevada River Forecast Center Sacramento, CA Background Outline
Cost of Inflow Forecast Uncertainty for Day Ahead Hydropower Production Scheduling
 Cost of Inflow Forecast Uncertainty for Day Ahead Hydropower Production Scheduling HEPEX 10 th University Workshop June 25 th, 2014 NOAA Center for Weather and Climate Thomas D. Veselka and Les Poch Argonne
Updated 2018 Restoration Allocation & Default Flow Schedule February 16, 2018
 Updated 2018 Restoration Allocation & Default Schedule February 16, 2018 Bureau of Reclamation 2800 Cottage Way, MP-170 Sacramento, California 95825 Introduction The following transmits the updated 2018
2011 Flood: Technical Review of Lake Manitoba, Lake St. Martin and Assiniboine River Water Levels Summary
 2011 Flood: Technical Review of Lake Manitoba, Lake St. Martin and Assiniboine River Water Levels Summary October 2013 Introduction Manitoba experienced unprecedented flooding in 2011. While flooding was
Lake Winnebago Regulation Meeting
 Lake Winnebago Regulation Meeting USACE Detroit District October 9, 2014 US Army Corps of Engineers Agenda Basin Overview Major Stakeholders Maintenance a and Repair Work Weather Conditions 2013-20142014
QPF? So it s a Land-falling Atmospheric River, Can That Help the Forecaster Make a Better. David W. Reynolds
 So it s a Land-falling Atmospheric River, Can That Help the Forecaster Make a Better QPF? David W. Reynolds Cooperative Institute for Research in Environmental Sciences Boulder, CO Brian Kawzenuk Center
Souris River Basin Spring Runoff Outlook As of March 1, 2019
 Souris River Basin Spring Runoff Outlook As of March 1, 2019 Prepared by: Flow Forecasting & Operations Planning Water Security Agency Basin Conditions Summer rainfall in 2018 over the Saskatchewan portion
Operational Perspectives on Hydrologic Model Data Assimilation
 Operational Perspectives on Hydrologic Model Data Assimilation Rob Hartman Hydrologist in Charge NOAA / National Weather Service California-Nevada River Forecast Center Sacramento, CA USA Outline Operational
Missouri River Basin Water Management Monthly Update
 Missouri River Basin Water Management Monthly Update Participating Agencies 255 255 255 237 237 237 0 0 0 217 217 217 163 163 163 200 200 200 131 132 122 239 65 53 80 119 27 National Oceanic and Atmospheric
3.0 TECHNICAL FEASIBILITY
 3.0 TECHNICAL FEASIBILITY 3.1 INTRODUCTION To enable seasonal storage and release of water from Lake Wenatchee, an impoundment structure would need to be constructed on the lake outlet channel. The structure
A Report on a Statistical Model to Forecast Seasonal Inflows to Cowichan Lake
 A Report on a Statistical Model to Forecast Seasonal Inflows to Cowichan Lake Prepared by: Allan Chapman, MSc, PGeo Hydrologist, Chapman Geoscience Ltd., and Former Head, BC River Forecast Centre Victoria
Climate also has a large influence on how local ecosystems have evolved and how we interact with them.
 The Mississippi River in a Changing Climate By Paul Lehman, P.Eng., General Manager Mississippi Valley Conservation (This article originally appeared in the Mississippi Lakes Association s 212 Mississippi
Three main areas of work:
 Task 2: Climate Information 1 Task 2: Climate Information Three main areas of work: Collect historical and projected weather and climate data Conduct storm surge and wave modeling, sea-level rise (SLR)
San Francisco Public Utilities Commission Hydrological Conditions Report For March 2016
 San Francisco Public Utilities Commission Hydrological Conditions Report For March 2016 J. Chester, C. Graham, A. Mazurkiewicz, & M. Tsang, April 7, 2016 Snow Surveyor Chris Graham crossing Huckleberry
ResSIMLite vs. ResSIM Model Comparison
 ResSIMLite vs. ResSIM Model Comparison 06/05/2013 M. Cox, OSU The outflow calculations represented in the Envision model have been closely modeled after the representation in the USACE HEC ResSIM model
U.S. ARMY CORPS OF ENGINEERS
 CORPS FACTS Regulating Mississippi River Navigation Pools U.S. ARMY CORPS OF ENGINEERS BUILDING STRONG Historical Background Federal improvements in the interest of navigation on the Mississippi River
Souris River Basin Spring Runoff Outlook As of March 15, 2018
 Souris River Basin Spring Runoff Outlook As of March 15, 2018 Prepared by: Flow Forecasting & Operations Planning Water Security Agency Basin Conditions Summer rainfall in 2017 in the Saskatchewan portion
January 25, Summary
 January 25, 2013 Summary Precipitation since the December 17, 2012, Drought Update has been slightly below average in parts of central and northern Illinois and above average in southern Illinois. Soil
Hydrologic Conditions in the Delaware River Basin
 2017 Hydrologic Conditions in the Delaware River Basin Prepared by Operations Staff June 2018 Hydrologic Highlights Hydrologic Conditions in the Delaware River Basin Annual Report 2017 At the start of
Disentangling Impacts of Climate & Land Use Changes on the Quantity & Quality of River Flows in Southern Ontario
 Disentangling Impacts of Climate & Land Use Changes on the Quantity & Quality of River Flows in Southern Ontario by Trevor Dickinson & Ramesh Rudra, Water Resources Engineering University of Guelph Acknowledgements
What Does It Take to Get Out of Drought?
 What Does It Take to Get Out of Drought? Nolan J. Doesken Colorado Climate Center Colorado State University http://ccc.atmos.colostate.edu Presented at the Insects, Diseases and Drought Workshop, May 19,
APPLICATIONS OF DOWNSCALING: HYDROLOGY AND WATER RESOURCES EXAMPLES
 APPLICATIONS OF DOWNSCALING: HYDROLOGY AND WATER RESOURCES EXAMPLES Dennis P. Lettenmaier Department of Civil and Environmental Engineering For presentation at Workshop on Regional Climate Research NCAR
SYSTEM BRIEF DAILY SUMMARY
 SYSTEM BRIEF DAILY SUMMARY * ANNUAL MaxTemp NEL (MWH) Hr Ending Hr Ending LOAD (PEAK HOURS 7:00 AM TO 10:00 PM MON-SAT) ENERGY (MWH) INCREMENTAL COST DAY DATE Civic TOTAL MAXIMUM @Max MINIMUM @Min FACTOR
RESERVOIR RELEASE FORECAST MODEL FOR FLOOD OPERATION OF THE FOLSOM PROJECT INCLUDING PRE-RELEASES ABSTRACT
 RESERVOIR RELEASE FORECAST MODEL FOR FLOOD OPERATION OF THE FOLSOM PROJECT INCLUDING PRE-RELEASES David S. Bowles 1, J. Dean Mathias 2, Sanjay S. Chauhan 3 and Joseph D. Countryman 4 ABSTRACT This paper
Development and Testing of Alternate Forecast-Based Flood Operations Rules for West Point Lake
 Development and Testing of Alternate Forecast-Based Flood Operations Rules for West Point Lake Dan Sheer and Sam Lebherz HydroLogics John C. Schaake NWS Ret. Wei Zeng Ga, Dept. of Natural Resources November
Climatography of the United States No
 Climate Division: AK 5 NWS Call Sign: ANC Month (1) Min (2) Month(1) Extremes Lowest (2) Temperature ( F) Lowest Month(1) Degree s (1) Base Temp 65 Heating Cooling 90 Number of s (3) Jan 22.2 9.3 15.8
Water Management for Environmental Restoration Flows In the Big Bend reach, Rio Grande Rio Bravo
 University of California, Davis Department of Land, Air and Water Resources Water Management for Environmental Restoration Flows In the Big Bend reach, Rio Grande Rio Bravo 46 th Annual Meeting 8 9 March,
Incorporating Large-Scale Climate Information in Water Resources Decision Making
 Incorporating Large-Scale Climate Information in Water Resources Decision Making Balaji Rajagopalan Dept. of Civil, Env.. And Arch. Engg.. And CIRES Katrina Grantz, Edith Zagona (CADSWES) Martyn Clark
Leveraging new models and data to improve flood stage forecast. Improving Flood Stage Forecasting in the Feather River Watershed. September 11 th 2015
 Leveraging new models and data to improve flood stage forecast Improving Flood Stage Forecasting in the Feather River Watershed September 11 th 2015 Mitch Russo, P.E. (DWR) Ashok Bathulla, P.E., CFM (GEI)
Application of Real-Time Rainfall Information System to CSO control. 2 October 2011 Naruhito Funatsu METAWATER Co., Ltd.
 Application of Real-Time Rainfall Information System to CSO control 2 October 2011 Naruhito Funatsu METAWATER Co., Ltd. Presentation Points Objectives To verify the applicability of the real-time rainfall
REDWOOD VALLEY SUBAREA
 Independent Science Review Panel Conceptual Model of Watershed Hydrology, Surface Water and Groundwater Interactions and Stream Ecology for the Russian River Watershed Appendices A-1 APPENDIX A A-2 REDWOOD
SYSTEM BRIEF DAILY SUMMARY
 SYSTEM BRIEF DAILY SUMMARY * ANNUAL MaxTemp NEL (MWH) Hr Ending Hr Ending LOAD (PEAK HOURS 7:00 AM TO 10:00 PM MON-SAT) ENERGY (MWH) INCREMENTAL COST DAY DATE Civic TOTAL MAXIMUM @Max MINIMUM @Min FACTOR
ENGINE SERIAL NUMBERS
 ENGINE SERIAL NUMBERS The engine number was also the serial number of the car. Engines were numbered when they were completed, and for the most part went into a chassis within a day or so. However, some
Lu, S., P. Craig, C. Wallen, Z. Liu, A. Stoddard, W. McAnnally and E. Maak. Dynamic Solutions, Knoxville, TN USACOE, Sacramento District
 An Extended-Delta Hydrodynamic Model Framework for Sea Level Rise Analysis to Support Resource Management Planning for the Sacramento-San Joaquin River Delta Lu, S., P. Craig, C. Wallen, Z. Liu, A. Stoddard,
A Review of the 2007 Water Year in Colorado
 A Review of the 2007 Water Year in Colorado Nolan Doesken Colorado Climate Center, CSU Mike Gillespie Snow Survey Division, USDA, NRCS Presented at the 28 th Annual AGU Hydrology Days, March 26, 2008,
Inter-linkage case study in Pakistan
 7 th GEOSS Asia Pacific Symposium GEOSS AWCI Parallel Session: 26-28 May, 2014, Tokyo, Japan Inter-linkage case study in Pakistan Snow and glaciermelt runoff modeling in Upper Indus Basin of Pakistan Maheswor
Colorado s 2003 Moisture Outlook
 Colorado s 2003 Moisture Outlook Nolan Doesken and Roger Pielke, Sr. Colorado Climate Center Prepared by Tara Green and Odie Bliss http://climate.atmos.colostate.edu How we got into this drought! Fort
Preliminary Viability Assessment (PVA) for Lake Mendocino Forecast Informed Reservoir Operations (FIRO)
 for Lake Mendocino Forecast Informed Reservoir Operations (FIRO)") Preliminary Viability Assessment (PVA) for Lake Mendocino Forecast Informed Reservoir Operations (FIRO) Rob Hartman Consultant to SCWA and CW3E May 30, 2017 Why Conduct a PVA? Key Questions for the PVA
Preliminary Viability Assessment (PVA) for Lake Mendocino Forecast Informed Reservoir Operations (FIRO) Rob Hartman Consultant to SCWA and CW3E May 30, 2017 Why Conduct a PVA? Key Questions for the PVA
Science Standard 1: Students analyze monthly precipitation and temperature records, displayed in bar charts, collected in metric units (mm).
.") Title: Precipitation Patterns across the Globe NSF GK-12 Fellow: Terry Legg Type of Lesson: STEM Grade Level(s): 4 th - 7 th grade This activity can be tailored to older, more advanced students by having
Title: Precipitation Patterns across the Globe NSF GK-12 Fellow: Terry Legg Type of Lesson: STEM Grade Level(s): 4 th - 7 th grade This activity can be tailored to older, more advanced students by having
Numerical modeling of sediment flushing from Lewis and Clark Lake
 University of Nebraska - Lincoln DigitalCommons@University of Nebraska - Lincoln US Army Research U.S. Department of Defense 2013 Numerical modeling of sediment flushing from Lewis and Clark Lake Jungkyu
Winter Season Resource Adequacy Analysis Status Report
 Winter Season Resource Adequacy Analysis Status Report Tom Falin Director Resource Adequacy Planning Markets & Reliability Committee October 26, 2017 Winter Risk Winter Season Resource Adequacy and Capacity
Inflow Forecasting for Hydro Catchments. Ross Woods and Alistair McKerchar NIWA Christchurch
 Inflow Forecasting for Hydro Catchments Ross Woods and Alistair McKerchar NIWA Christchurch Inflows Water flowing into hydro storages Usually measured by monitoring the levels and outflows from hydro storages
Appendix B - Alabama-Coosa-Tallapoosa (ACT) Basin
 Basin") Appendix B - Alabama-Coosa-Tallapoosa (ACT) Basin 1 ACT BASIN 1.1 DESCRIPTION OF BASIN The headwater streams of the Alabama-Coosa-Tallapoosa (ACT) System rise in the Blue Ridge Mountains of Georgia and
Appendix B - Alabama-Coosa-Tallapoosa (ACT) Basin 1 ACT BASIN 1.1 DESCRIPTION OF BASIN The headwater streams of the Alabama-Coosa-Tallapoosa (ACT) System rise in the Blue Ridge Mountains of Georgia and
Operational Hydrologic Ensemble Forecasting. Rob Hartman Hydrologist in Charge NWS / California-Nevada River Forecast Center
 Operational Hydrologic Ensemble Forecasting Rob Hartman Hydrologist in Charge NWS / California-Nevada River Forecast Center Mission of NWS Hydrologic Services Program Provide river and flood forecasts
Drought in Southeast Colorado
 Drought in Southeast Colorado Nolan Doesken and Roger Pielke, Sr. Colorado Climate Center Prepared by Tara Green and Odie Bliss http://climate.atmos.colostate.edu 1 Historical Perspective on Drought Tourism
Changing Hydrology under a Changing Climate for a Coastal Plain Watershed
 Changing Hydrology under a Changing Climate for a Coastal Plain Watershed David Bosch USDA-ARS, Tifton, GA Jeff Arnold ARS Temple, TX and Peter Allen Baylor University, TX SEWRU Objectives 1. Project changes
Operational water balance model for Siilinjärvi mine
 Operational water balance model for Siilinjärvi mine Vesa Kolhinen, Tiia Vento, Juho Jakkila, Markus Huttunen, Marie Korppoo, Bertel Vehviläinen Finnish Environment Institute (SYKE) Freshwater Centre/Watershed
National Integrated Drought Information System. Southeast US Pilot for Apalachicola- Flint-Chattahoochee River Basin 20-March-2012
 National Integrated Drought Information System Southeast US Pilot for Apalachicola- Flint-Chattahoochee River Basin 20-March-2012 Current drought status from Drought Monitor http://www.drought.unl.edu/dm/monitor.html
Forecast Methods, Products, and Services for the San Joaquin River Basin. Mission of NWS Hydrologic Services Program
 NOAA s s National Weather Service California-Nevada River Forecast Center Forecast Methods, Products, and Services for the San Joaquin River Basin Rob Hartman Hydrologist in Charge Mission of NWS Hydrologic
APPENDIX J MODELING TEHCNICAL MEMORANDUM (RESSIM MODELING)
") APPENDIX J MODELING TEHCNICAL MEMORANDUM (RESSIM MODELING) Technical Memorandum To: Michael J. Preszler, California Water Consulting From: Marieke Armstrong, Mead & Hunt Rahul Ranade, Mead & Hunt Date:
APPENDIX J MODELING TEHCNICAL MEMORANDUM (RESSIM MODELING) Technical Memorandum To: Michael J. Preszler, California Water Consulting From: Marieke Armstrong, Mead & Hunt Rahul Ranade, Mead & Hunt Date:
Climatography of the United States No
 Climate Division: CA 4 NWS Call Sign: Month (1) Min (2) Month(1) Extremes Lowest (2) Temperature ( F) Lowest Month(1) Degree s (1) Base Temp 65 Heating Cooling 100 Number of s (3) Jan 55.6 39.3 47.5 77
Climatography of the United States No
 Climate Division: CA 5 NWS Call Sign: Month (1) Min (2) Month(1) Extremes Lowest (2) Temperature ( F) Lowest Month(1) Degree s (1) Base Temp 65 Heating Cooling 100 Number of s (3) Jan 56.6 36.5 46.6 81
Climatography of the United States No
 Climate Division: CA 1 NWS Call Sign: Month (1) Min (2) Month(1) Extremes Lowest (2) Temperature ( F) Lowest Month(1) Degree s (1) Base Temp 65 Heating Cooling 100 Number of s (3) Jan 57.9 38.9 48.4 85
Climatography of the United States No
 Climate Division: CA 5 NWS Call Sign: Month (1) Min (2) Month(1) Extremes Lowest (2) Temperature ( F) Lowest Month(1) Degree s (1) Base Temp 65 Heating Cooling 100 Number of s (3) Jan 44.8 25.4 35.1 72
Climatography of the United States No
 Climate Division: CA 4 NWS Call Sign: Month (1) Min (2) Month(1) Extremes Lowest (2) Temperature ( F) Lowest Month(1) Degree s (1) Base Temp 65 Heating Cooling 100 Number of s (3) Jan 49.4 37.5 43.5 73
Climatography of the United States No
 Climate Division: CA 6 NWS Call Sign: Month (1) Min (2) Month(1) Extremes Lowest (2) Temperature ( F) Lowest Month(1) Degree s (1) Base Temp 65 Heating Cooling 100 Number of s (3) Jan 69.4 46.6 58.0 92
Climatography of the United States No
 Climate Division: CA 4 NWS Call Sign: Month (1) Min (2) Month(1) Extremes Lowest (2) Temperature ( F) Lowest Month(1) Degree s (1) Base Temp 65 Heating Cooling 1 Number of s (3) Jan 58.5 38.8 48.7 79 1962
Climatography of the United States No
 Climate Division: CA 6 NWS Call Sign: Month (1) Min (2) Month(1) Extremes Lowest (2) Temperature ( F) Lowest Month(1) Degree s (1) Base Temp 65 Heating Cooling 1 Number of s (3) Jan 67.5 42. 54.8 92 1971
Climatography of the United States No
 Climate Division: CA 1 NWS Call Sign: Month (1) Min (2) Month(1) Extremes Lowest (2) Temperature ( F) Lowest Month(1) Degree s (1) Base Temp 65 Heating Cooling 1 Number of s (3) Jan 57.8 39.5 48.7 85 1962
Climate Change and Flood Operations in the Sacramento Basin, California
 JULY 2011 Climate Change and Flood Operations in the Sacramento Basin, California Ann D. Willis 1, Jay R. Lund 2, Edwin S. Townsley 3, and Beth A. Faber 4 ABSTRACT Climate warming is likely to challenge
TILT, DAYLIGHT AND SEASONS WORKSHEET
 TILT, DAYLIGHT AND SEASONS WORKSHEET Activity Description: Students will use a data table to make a graph for the length of day and average high temperature in Utah. They will then answer questions based
Seasonal Climate Watch June to October 2018
 Seasonal Climate Watch June to October 2018 Date issued: May 28, 2018 1. Overview The El Niño-Southern Oscillation (ENSO) has now moved into the neutral phase and is expected to rise towards an El Niño
2003 Moisture Outlook
 2003 Moisture Outlook Nolan Doesken and Roger Pielke, Sr. Colorado Climate Center Prepared by Tara Green and Odie Bliss http://climate.atmos.colostate.edu Through 1999 Through 1999 Fort Collins Total Water
Applications/Users for Improved S2S Forecasts
 Applications/Users for Improved S2S Forecasts Nolan Doesken Colorado Climate Center Colorado State University WSWC Precipitation Forecasting Workshop June 7-9, 2016 San Diego, CA First -- A short background
Illinois State Water Survey Division
 Illinois State Water Survey Division SURFACE WATER SECTION SWS Miscellaneous Publication 108 SEDIMENT YIELD AND ACCUMULATION IN THE LOWER CACHE RIVER by Misganaw Demissie Champaign, Illinois June 1989
Climatography of the United States No
 Climate Division: ND 8 NWS Call Sign: BIS Month (1) Min (2) Month(1) Extremes Lowest (2) Temperature ( F) Lowest Month(1) Degree s (1) Base Temp 65 Heating Cooling 100 Number of s (3) Jan 21.1 -.6 10.2
Climatography of the United States No
 Climate Division: TN 1 NWS Call Sign: Month (1) Min (2) Month(1) Extremes Lowest (2) Temperature ( F) Lowest Month(1) Degree s (1) Base Temp 65 Heating Cooling 100 Number of s (3) Jan 47.6 24.9 36.3 81
Seasonal Hydrometeorological Ensemble Prediction System: Forecast of Irrigation Potentials in Denmark
 Seasonal Hydrometeorological Ensemble Prediction System: Forecast of Irrigation Potentials in Denmark Diana Lucatero 1*, Henrik Madsen 2, Karsten H. Jensen 1, Jens C. Refsgaard 3, Jacob Kidmose 3 1 University
Climatography of the United States No
 Climate Division: CA 5 NWS Call Sign: FAT Month (1) Min (2) Month(1) Extremes Lowest (2) Temperature ( F) Lowest Month(1) Degree s (1) Base Temp 65 Heating Cooling 1 Number of s (3) Jan 53.6 38.4 46. 78
Climatography of the United States No
 Climate Division: CA 6 NWS Call Sign: 1L2 N Lon: 118 3W Month (1) Min (2) Month(1) Extremes Lowest (2) Temperature ( F) Lowest Month(1) Degree s (1) Base Temp 65 Heating Cooling 1 Number of s (3) Jan 63.7
Fenhe (Fen He) Map of River. Table of Basic Data. China 10
 Map of River. Table of Basic Data. China 10") Fenhe (Fen He) Map of River Table of Basic Data Name(s): Fenhe (in Huanghe River) Location: Shanxi Province, Northern China Area: 39,471 km 2 Origin: Mt. Guancen (2,147 m) Outlet: Huanghe Serial No. :
Fenhe (Fen He) Map of River Table of Basic Data Name(s): Fenhe (in Huanghe River) Location: Shanxi Province, Northern China Area: 39,471 km 2 Origin: Mt. Guancen (2,147 m) Outlet: Huanghe Serial No. :
Climatography of the United States No
 Climate Division: CA 5 NWS Call Sign: BFL Month (1) Min (2) Month(1) Extremes Lowest (2) Temperature ( F) Lowest Month(1) Degree s (1) Base Temp 65 Heating Cooling 1 Number of s (3) Jan 56.3 39.3 47.8