Colorado Water Supply Outlook Report April 1, 2016
|
|
|
- Agnes Logan
- 5 years ago
- Views:
Transcription


1 Colorado Water Supply Outlook Report April 1, 216 Kevin Houck and Allison Franz of the Colorado Water Conservation Board measure the Willow Creek Pass snow course. This snow course recorded 129% of normal snow water equivalent, a large increase over the previous month, which is a result of the series of winter storms that hit central and northern Colorado throughout the month of March. Date: 3/31/216 Photo By: Joe Busto REMINDER: We are soliciting field work photos from our snow surveyors again this year. Each month we will pick one to grace the cover of this report! Please include information on where, when and of who/what the photo was taken.
2 Contents Statewide Water Supply Conditions... 3 Summary... 3 Snowpack... 4 Precipitation... 4 Reservoir Storage... 5 Streamflow... 7 GUNNISON RIVER BASIN... 9 UPPER COLORADO RIVER BASIN SOUTH PLATTE RIVER BASIN YAMPA, WHITE, NORTH PLATTE AND LARAMIE RIVER BASINS ARKANSAS RIVER BASIN UPPER RIO GRANDE RIVER BASIN SAN MIGUEL, DOLORES, ANIMAS, AND SAN JUAN RIVER BASINS How to Read Non-Exceedance Projections Graphs Explanation of Flow Comparison Charts How Forecasts Are Made The U.S. Department of Agriculture (USDA) prohibits discrimination against its customers. If you believe you experienced discrimination when obtaining services from USDA, participating in a USDA program, or participating in a program that receives financial assistance from USDA, you may file a complaint with USDA. Information about how to file a discrimination complaint is available from the Office of theassistant Secretary for Civil Rights. USDA prohibits discrimination in all its programs and activities on the basis of race, color, national origin, age, disability, and where applicable, sex (including genderidentity and expression), marital status, familial status, parental status, religion, sexual orientation, political beliefs, genetic information, reprisal, or because all or part of an individual s income is derived from any public assistance program. (Not all prohibited bases apply to all programs.) To file a complaint of discrimination, complete, sign, and mail a program discrimination complaint form,available at any USDA office location or online at or write to: USDA Office of the Assistant Secretary for Civil Rights 14 Independence Avenue, SW. Washington, DC Or call toll free at (866) (voice) to obtain additional information, the appropriate office or to request documents. Individuals who are deaf, hard of hearing, or have speech disabilities may contact USDA through the Federal Relay service at (8) or (8) (in Spanish). USDA is an equal opportunity provider, employer, and lender. Persons with disabilities who require alternative means for communication of program information (e.g., Braille, large print, audiotape, etc.) should contact USDA's TARGET Center at (22) (voice and TDD).
3 Snow Water Equivalent (inches) Summary Statewide Water Supply Conditions The beginning of March started off slow on the heels of a poor February but precipitation slowly ramped up, first in the northern half of the state then eventually working the wetter weather pattern throughout much of Colorado s mountains. Unfortunately by the time the wet weather had impacted the southern mountains it was too little, too late, and also too warm. In some mountain locations, March precipitation was between 5 and 65 percent of normal and at lower elevations fell in the form of rain instead of snow. Snowpack at the lower elevations of the southern mountains have experienced snowpack melt since the beginning of March. The Dolores and San Juan River basins as a whole gained little additional snowpack since February 1, where the losses in snowpack at lower elevations nullified the accumulations at the higher elevations. Fortunately the northern portion of the state not only avoided the dry, warm weather but made considerable improvements beyond March 1 snowpack levels. Peak snowpack typically occurs in early to mid-april for much of Colorado, which means streamflows will likely begin to crescendo in the near future. This month s forecasts are near normal in the Upper Colorado, North and South Platte watersheds but slightly below to below normal in all other basins Colorado Statewide Time Series Snowpack Summary Based on Provisional SNOTEL data as of Apr 4, 216 Current as Pct of Normal: 97% Current as Pct of Avg: 95% Current as Pct of Last Year: 147% Current as Pct of Peak: 96% Normal as Pct of Peak: 99% Pct of Normal Needed to Reach Peak: 577% Normal Peak Date: Apr Oct 1 Nov 1 Dec 1 Jan 1 Feb 1 Mar 1 Apr 1 May 1 Jun 1 Jul 1 Aug 1 Sep 1 Median WY213 WY214 WY215 WY216 Average

4 Snowpack There is a distinctive trend in April 1 st snowpack accumulation as one traverses from north to south across Colorado. March storms favored the northern and central river basins allowing these areas to continue to build on a healthy snowpack. Conversely, the southern basins are universally below normal and many lowelevation sites reached early snowpack peaks and have progressed into advanced stages of melt. The southeastern sub-basins of the Arkansas are especially low on snow, but as a result of the near-normal snowpack in the headwater tributaries, that river basin as a whole has only dropped to 92 percent of median snowpack. The Rio Grande has the lowest snowpack of the major river basins, at 79 percent of the median. The combined San Miguel, Dolores, Animas, and San Juan River basin is also below normal at 81 percent of the median. The Gunnison River basin is near normal at 95 percent of median and the other major river basins to the north are above normal. The North Platte has the most ample snowpack in the state compared to normal and currently sits at 19 percent of median. Despite the low snowpack levels in several of the southern basins, Colorado still has a snowpack that is near normal at 98 percent of the median. This is much better than was experienced last year on April 1 st when many of the low and mid-elevation SNOTEL sites had already begun to melt and the state had a snowpack that was only 69 percent of the median. Aside from the low-elevation SNOTEL sites in the southern river basins, the majority of Colorado SNOTEL sites represent snowpacks that have yet to exhibit signs of active melt.
5 Precipitation 2 Colorado Monthly Precipitation Summary for WY216 USDA Natural Resources Conservation Service Oct Nov Dec Jan Feb Mar Apr Percent of Average Gunnison Colorado South Platte Yampa & White Arkansas Rio Grande San Juan* State *Includes Animas, Dolores, San Miguel Basins Precipitation patterns varied widely across the state throughout March but averages across the whole state ended up being just below normal, at 98 percent of average, the same as the current water year-to-date precipitation. Precipitation accumulation in March was a very large increase over February, when the statewide average was only 56 percent. There was a very strong signal of basins in the southern half of Colorado receiving well below normal precipitation and the more northerly basins receiving well above normal amounts. The Upper Rio Grande and combined San Miguel, Dolores, Animas and San Juan basins were the lowest in the state receiving 5 and 53 percent of average precipitation, respectively. The Arkansas, also in southern Colorado, had 62 percent of average March precipitation. The Gunnison received more but was still well below normal at 77 percent of average. In stark contrast, the combined Yampa, White, and North Platte basins in the northern part of the state received the most monthly precipitation, relative to normal, at 142 percent. The Colorado and South Platte basins didn t receive quite as much but still had well above normal March precipitation, at 124 and 129 percent of average, respectively. Water year-to-date precipitation by basin varies across the state but is generally surrounding normal values, ranging from a low of 86 percent in the Upper Rio Grande to a high of 11 percent in the South Platte.
6 Percent of Average Useable Storage Reservoir Storage Colorado Reservoir Storage 16% Oct-15 Nov-15 Dec-15 Jan-16 Feb-16 Mar-16 Apr-16 May-16 Jun-16 Jul-16 Aug-16 Sep-16 14% 12% 1% 8% 6% 4% 2% % Gunnison Colorado South Platte Yampa, White & North Platte Arkansas Upper Rio Grande San Miguel, Dolores, Animas & San Juan Statewide Statewide reservoir storage experienced an increase in both net storage and percent of average over the last month, now at 111 percent and holding a total of 46, acre-feet above the average. The Arkansas and combined Yampa and White River basins currently have the highest percent of average reservoir storage in the state, at 12 percent. The Gunnison River basin showed a notable increase in percent of normal reservoir storage over the month of March, rising from 19 to 115 percent of its average stored volume. Much of this change was driven by Blue Mesa, Colorado s largest reservoir, which had a slight increase in storage since a month ago compared to the average storage volumes, which show a notable drop between March 1 st and April 1 st. Total reservoir storage in the Upper Colorado basin remains relatively similar to last month, exhibiting a one percent increase to where it resides now at 111 percent of average. Storage in the South Platte is 17 percent of average, up two percent from a month ago. Percent of average storage in the combined San Miguel, Dolores, Animas, and San Juan River basins has been steadily climbing throughout water year 216 and is currently slightly higher than last month, at 15 percent. The Upper Rio Grande continues to have the lowest, and the only below normal, percent of average reservoir storage in the state. That said, it has been steadily rising throughout the water year and continues to move towards normal values, with its current value at 94 percent of average.

7 Streamflow Water users in Colorado can expect a variety of streamflow conditions across Colorado this spring and summer. As a result of the disparity in precipitation and snowpack accumulation, streamflow forecasts for Colorado s southern basins decreased while forecasts in northern basins improved. The Upper Rio Grande collectively contains forecast points with the lowest predicted streamflow volumes, and most flows are expected to be below 8 percent of average. There are, however, a few forecast points along upper tributaries of the Rio Grande that are expected to be near normal. Forecasts in the Arkansas River basin are equally low, with no forecast points anticipated to experience streamflows above 9 percent of average. The Gunnison, Yampa and White, and combined San Miguel, Dolores, Animas, and San Juan basins are split with some streamflows predicted to be much below normal and others near normal. Following trends in above normal snowpack and precipitation, the Upper Colorado, South Platte, and North Platte River basins will likely see flows that are mostly near to above normal. Although forecasts along the upper South Platte and more southern tributaries of the Upper Colorado are currently projected to be below normal.
8 PAGE INTENTIONALLY LEFT BLANK

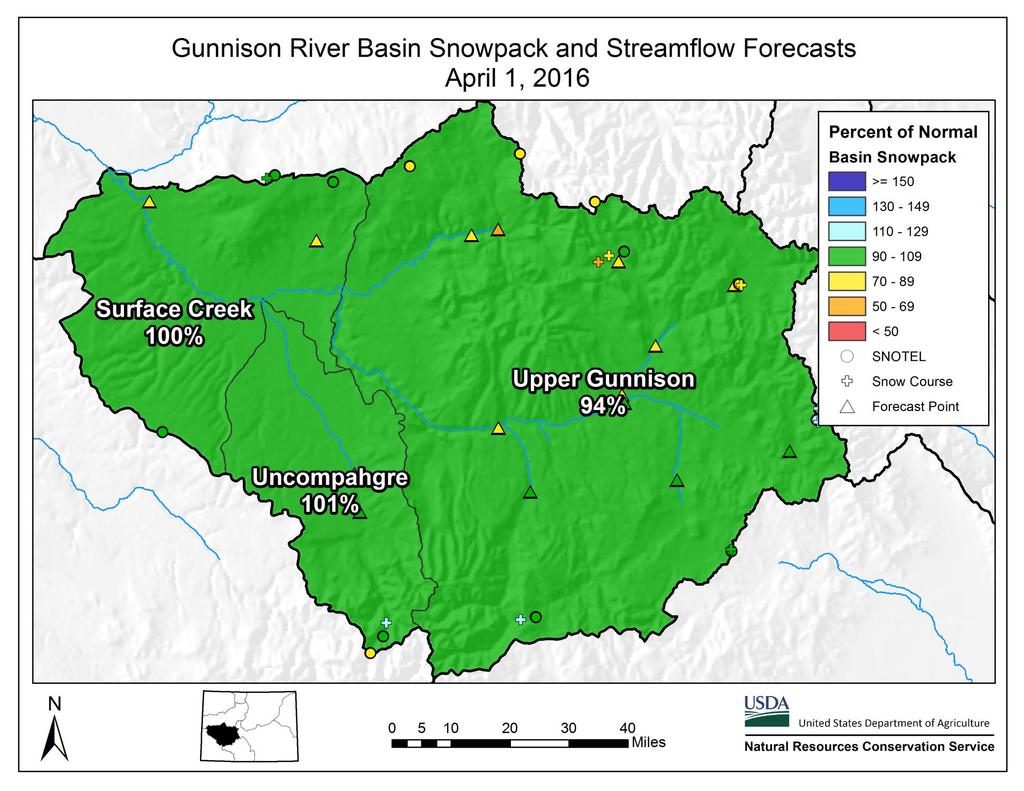
9 Water Equivalent (in) Percent of Average GUNNISON RIVER BASIN April 1, 216 Snowpack in the Gunnison River basin is below normal at 95% of the median. Precipitation for March was 77% of average which brings water year-to-date precipitation to 95% of average. Reservoir storage at the end of March was 115% of average compared to 12% last year. Current streamflow forecasts range from 97% of average for the inflow to Ridgeway Reservoir to 64% for the inflow to Paonia Reservoir. Mountain Snowpack* Mountain Precipitation 3 Median Current Maximum Minimum 16 Monthly Year-to-date Jan Feb Mar Apr May Jun Oct Nov Dec Jan Feb Mar Apr May
10
11
12 Adjusted Cumulative Monthly Discharge (KAF) Average Daily Flow (cfs) 1-Oct 1-Nov 1-Dec 1-Jan 1-Feb 1-Mar 1-Apr 1-May 1-Jun 1-Jul 1-Aug 1-Sep Snow Water Equivalent (Inches) 3 Gunnison River Basin with Non-Exceedence Projections Based on Provisional SNOTEL Data as of Apr 4, Averages Median WY216 Minimum 1% 3% 5% 7% 9% Maximum Gunnison River near Grand Junction, CO Daily and Cumulative Discharge Compared to Current Streamflow Forecasts (Apr - Jul) Mar 1-Apr 1-May 1-Jun 1-Jul 1-Aug % Exceedance Forecast 7% Exceedance Forecast 5% Exceedance Forecast 3% Exceedance Forecast 1% Exceedance Forecast Average Discharge 215 Cumulative Discharge 215 Hydrograph 216 Cumulative Discharge 216 Hydrograph Please refer to the sections at the end of this report for further explanation concerning these graphs.

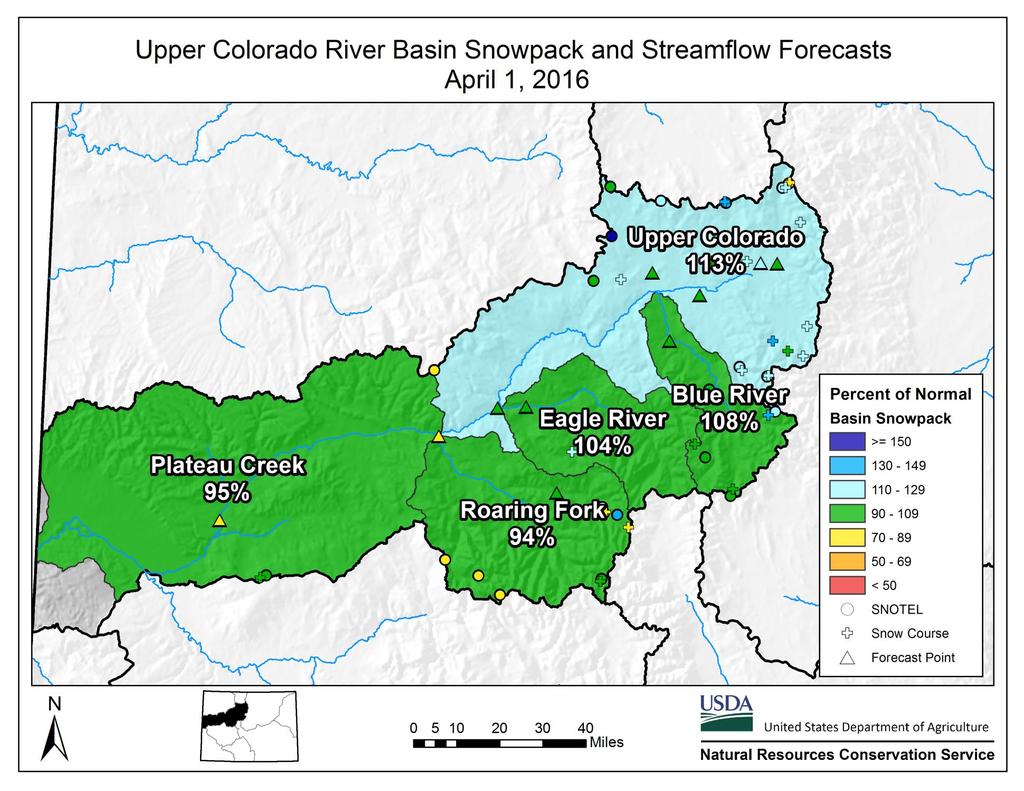
13 Water Equivalent (in) Percent of Average UPPER COLORADO RIVER BASIN April 1, 216 Snowpack in the Colorado River basin is above normal at 17% of the median. Precipitation for March was 124% of average which brings water year-to-date precipitation to 1% of average. Reservoir storage at the end of March was 111% of average compared to 125% last year. Current streamflow forecasts range from 115% of average for the inflow to Willow Creek Reservoir to 8% for the Roaring Fork at Glenwood Springs. Mountain Snowpack* Mountain Precipitation Median Current Maximum Minimum Monthly Year-to-date Jan Feb Mar Apr May Jun Oct Nov Dec Jan Feb Mar April May
14
15
16 Adjusted Cumulative Discharge (KAF) Daily Average Discharge (CFS) 1-Oct 1-Nov 1-Dec 1-Jan 1-Feb 1-Mar 1-Apr 1-May 1-Jun 1-Jul 1-Aug 1-Sep Snow Water Equivalent (Inches) 3 Upper Colorado River Basin with Non-Exceedence Projections Based on Provisional SNOTEL Data as of Apr 4, Averages Median WY216 Minimum 1% 3% 5% 7% 9% Maximum Colorado River near Cameo, CO Daily and Cumulative Discharge Compared to Current Streamflow Forecasts (Apr - Jul) Mar 1-Apr 1-May 1-Jun 1-Jul 1-Aug % Exceedance Forecast 7% Exceedance Forecast 5% Exceedance Forecast 3% Exceedance Forecast 1% Exceedance Forecast Average Discharge 215 Cumulative Discharge 215 Hydrograph 216 Cumulative Discharge 216 Hydrograph Please refer to the sections at the end of this report for further explanation concerning these graphs.


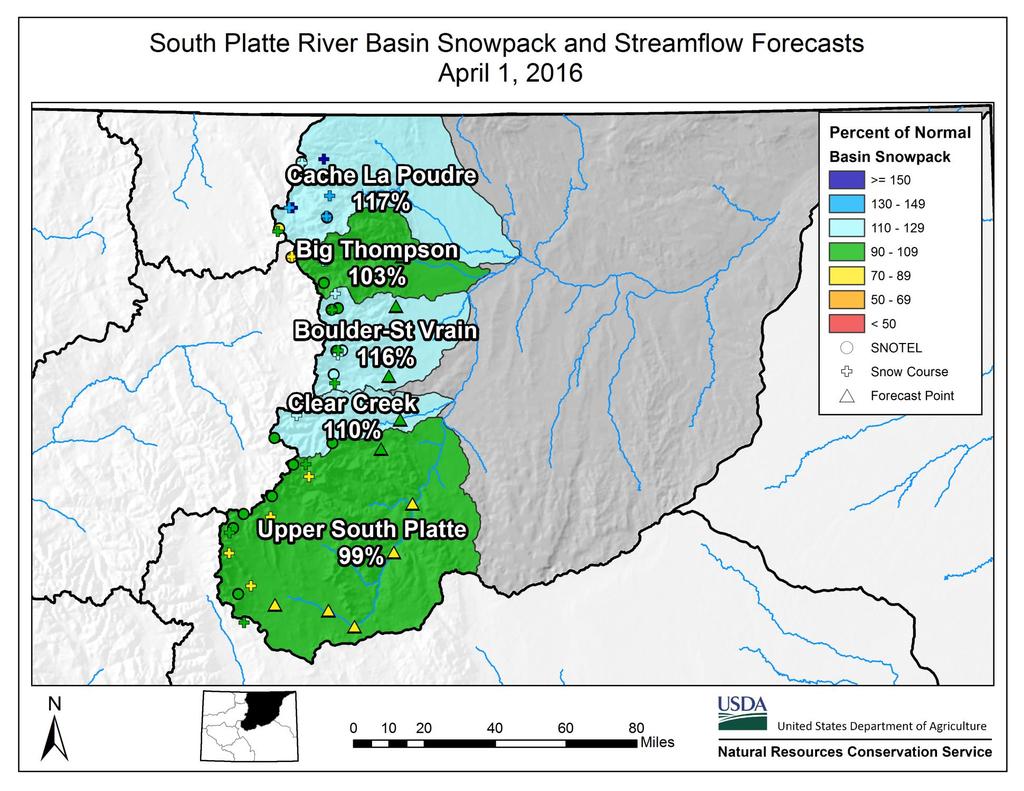
17 Water Equivalent (in) Percent of Average SOUTH PLATTE RIVER BASIN April 1, 216 Snowpack in the South Platte River basin is above normal at 18% of the median. Precipitation for March was 129% of average which brings water year-to-date precipitation to 11%. Reservoir storage at the end of March was 17% of average compared to 114% last year. Streamflow forecasts range from 19% of average for Boulder Creek near Orodell to 81% for the South Platte River at South Platte. Mountain Snowpack* Mountain Precipitation Median Current Maximum Minimum Monthly Year-to-date Jan Feb Mar Apr May Jun Oct Nov Dec Jan Feb Mar April May
18
19
20 Adjusted Cumulative Monthly Discharge (KAF) Average Daily Flow (cfs) 1-Oct 1-Nov 1-Dec 1-Jan 1-Feb 1-Mar 1-Apr 1-May 1-Jun 1-Jul 1-Aug 1-Sep Snow Water Equivalent (Inches) 3 South Platte River Basin with Non-Exceedence Projections Based on Provisional SNOTEL Data as of Apr 4, Averages Median WY216 Minimum 1% 3% 5% 7% 9% Maximum Cache La Poudre River at Canyon Mouth Daily and Cumulative Discharge Compared to Current Streamflow Forecasts (Apr - Jul) % Exceedance Forecast 7% Exceedance Forecast 5% Exceedance Forecast 3% Exceedance Forecast 1% Exceedance Forecast Average Discharge 215 Cumulative Discharge 215 Hydrograph 216 Cumulative Discharge 216 Hydrograph 1-Mar 1-Apr 1-May 1-Jun 1-Jul 1-Aug Please refer to the sections at the end of this report for further explanation concerning these graphs.

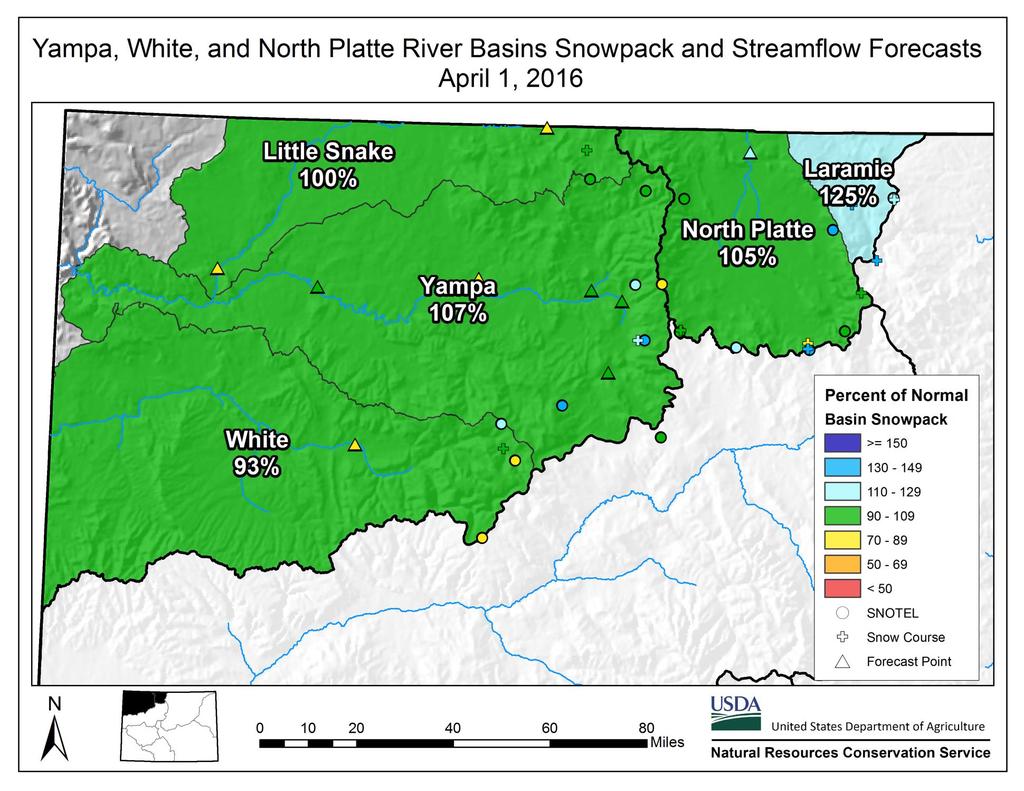
21 Water Equivalent (in) Percent of Average YAMPA, WHITE, NORTH PLATTE AND LARAMIE RIVER BASINS April 1, 216 Snowpack in the Yampa, White & North Platte basins is above normal at 16% of the median. Precipitation for March was 142% of average and water year-to-date precipitation is at 1% of average. Reservoir storage at the end of March was 12% of average compared to 125% last year. Streamflow forecasts range from 111% of average for the North Platte near Northgate to 75% for the Little Snake River near Dixon. Mountain Snowpack* Mountain Precipitation Median Current Maximum Minimum Monthly Year-to-date Jan Feb Mar Apr May Jun Oct Nov Dec Jan Feb Mar April May
22
23
24 1-Mar 1-Mar 19-Mar 28-Mar 6-Apr 15-Apr 24-Apr 3-May 12-May 21-May 3-May 8-Jun 17-Jun 26-Jun 5-Jul 14-Jul 23-Jul 1-Aug 1-Aug 19-Aug 28-Aug Adjusted Cumulative Monthly Discharge (KAF) Average Daily Flow (cfs) 1-Oct 1-Nov 1-Dec 1-Jan 1-Feb 1-Mar 1-Apr 1-May 1-Jun 1-Jul 1-Aug 1-Sep Snow Water Equivalent (Inches) 4 Yampa, White & North Platte River Basins with Non-Exceedence Projections Based on Provisional SNOTEL Data as of Apr 4, Averages Median WY216 Minimum 1% 3% 5% 7% 9% Maximum Yampa River near Maybell Daily and Cumulative Discharge Compared to Current Streamflow Forecasts (Apr - Jul) % Exceedance Forecast 7% Exceedance Forecast 5% Exceedance Forecast 3% Exceedance Forecast 1% Exceedance Forecast Average Discharge 215 Cumulative Discharge 215 Hydrograph 216 Cumulative Discharge 216 Hydrograph Please refer to the sections at the end of this report for further explanation concerning these graphs.
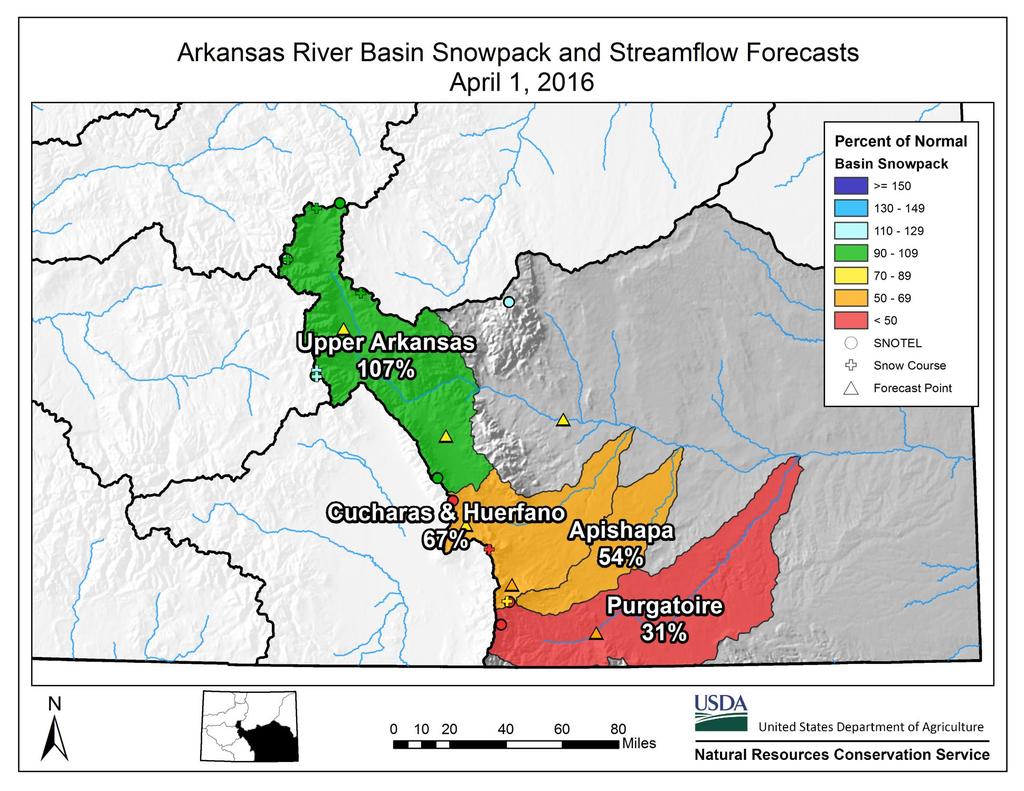
25 Water Equivalent (in) Percent of Average ARKANSAS RIVER BASIN April 1, 216 Snowpack in the Arkansas River basin is below normal at 92% of the median. Precipitation for March was 62% of average which brings water year-to-date precipitation to 9% of average. Reservoir storage at the end of March was 12% of average compared to 8% last year. Current streamflow forecasts range from 88% of average for the Arkansas at Salida and the Pueblo Reservoir inflow to 62% for the Cucharas River near La Veta. Mountain Snowpack* Mountain Precipitation Median Current Maximum Minimum Monthly Year-to-date Jan Feb Mar Apr May Jun Oct Nov Dec Jan Feb Mar April May
26
27
28 Adjusted Cumulative Monthly Discharge (KAF) Average Daily Flow (cfs) 1-Oct 1-Nov 1-Dec 1-Jan 1-Feb 1-Mar 1-Apr 1-May 1-Jun 1-Jul 1-Aug 1-Sep Snow Water Equivalent (Inches) 25 Arkansas River Basin with Non-Exceedence Projections Based on Provisional SNOTEL Data as of Apr 4, Averages Median WY216 Minimum 1% 3% 5% 7% 9% Maximum Arkansas River at Salida, CO Daily and Cumulative Discharge Compared to Current Streamflow Forecasts (Apr - Jul) % Exceedance Forecast 7% Exceedance Forecast 5% Exceedance Forecast 3% Exceedance Forecast 1% Exceedance Forecast Average Discharge 215 Cumulative Discharge 215 Hydrograph 216 Hydrograph 216 Cumulative Discharge 1-Mar 1-Apr 1-May 1-Jun 1-Jul 1-Aug Please refer to the sections at the end of this report for further explanation concerning these graphs.
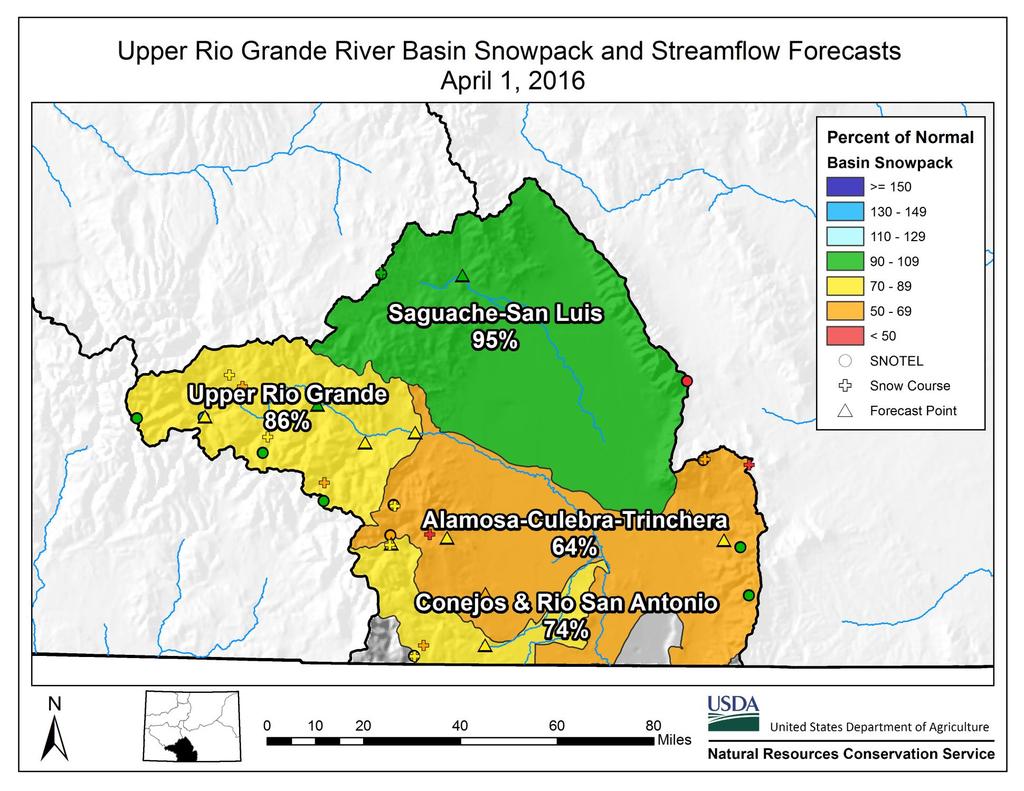
29 Water Equivalent (in) Percent of Average UPPER RIO GRANDE RIVER BASIN April 1, 216 Snowpack in the Upper Rio Grande River basin is below normal at 79% of median. Precipitation for March was 5% of average which brings water year-to-date precipitation to 86% of average. Reservoir storage at the end of March was 94% of average compared to 78% last year. Streamflow forecasts range from 97% of average for Saguache Creek near Saguache to 54% of average for the San Antonio River at Ortiz. Mountain Snowpack* Mountain Precipitation Median Current Maximum Minimum Monthly Year-to-date Jan Feb Mar Apr May Jun Oct Nov Dec Jan Feb Mar April May
30
31
32 Adjusted Cumulative Monthly Discharge (KAF) Average Daily Flow (cfs) 1-Oct 1-Nov 1-Dec 1-Jan 1-Feb 1-Mar 1-Apr 1-May 1-Jun 1-Jul 1-Aug 1-Sep Snow Water Equivalent (Inches) 25 Upper Rio Grande River Basin with Non-Exceedence Projections Based on Provisional SNOTEL Data as of Apr 4, Averages Median WY216 Minimum 1% 3% 5% 7% 9% Maximum Rio Grande at Wagon Wheel Gap Daily and Cumulative Discharge Compared to Current Streamflow Forecasts (Apr-Sep) % Exceedance Forecast 7% Exceedance Forecast 5% Exceedance Forecast 3% Exceedance Forecast 1% Exceedance Forecast Average Discharge 215 Cumulative Discharge 215 Hydrograph 216 Cumulative Discharge 216 Hydrograph 1-Mar 1-Apr 1-May 1-Jun 1-Jul 1-Aug Please refer to the sections at the end of this report for further explanation concerning these graphs.

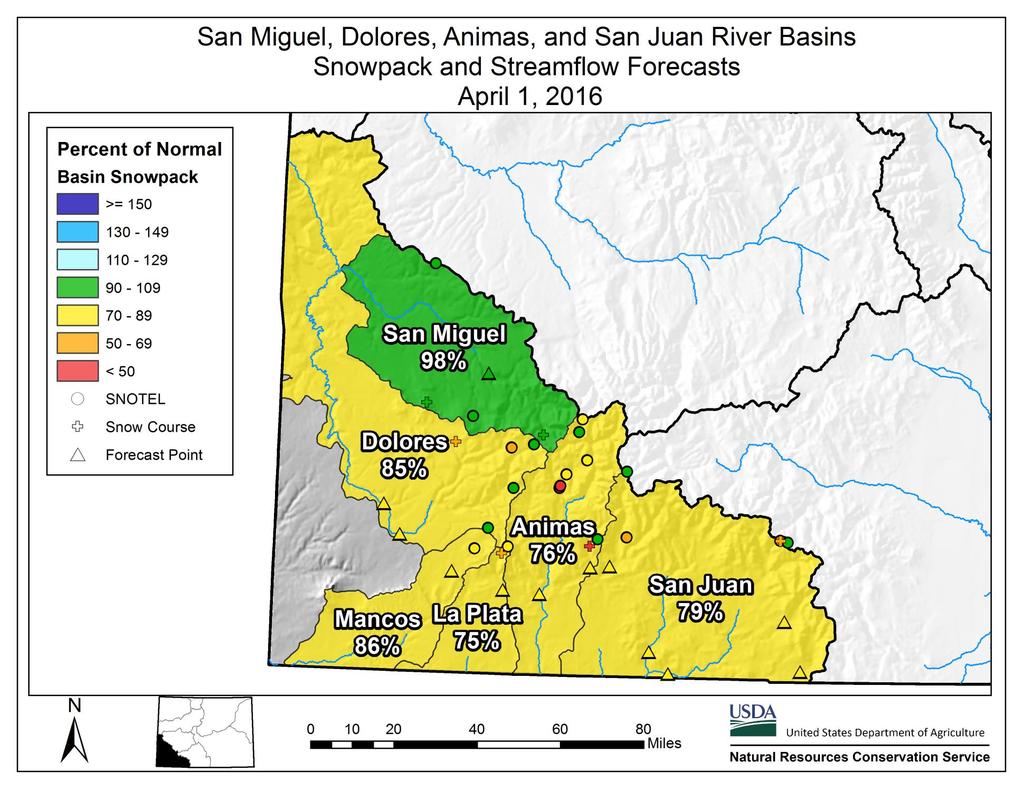
33 Water Equivalent (in) Percent of Average SAN MIGUEL, DOLORES, ANIMAS, AND SAN JUAN RIVER BASINS April 1, 216 Snowpack in the combined southwest river basins is below normal at 81% of median. Precipitation for March was 53% of average which brings water year-to-date precipitation to 96% of average. Reservoir storage at the end of March was 15% of average compared to 9% last year. Current streamflow forecasts range from 98% of average for the San Miguel at Placerville to 71% for the San Juan at Carracas and the Navajo Res. inflow. Mountain Snowpack* Mountain Precipitation Median Current Maximum Minimum Monthly Year-to-date Jan Feb Mar Apr May Jun Oct Nov Dec Jan Feb Mar April May
34
35
36 Adjusted Cumulative Monthly Discharge (KAF) Average Daily Flow (cfs) 1-Oct 1-Nov 1-Dec 1-Jan 1-Feb 1-Mar 1-Apr 1-May 1-Jun 1-Jul 1-Aug 1-Sep Snow Water Equivalent (Inches) San Miguel, Dolores, Animas and San Juan River Basin with Non-Exceedence Projections 35 Based on Provisional SNOTEL Data as of Apr 4, Averages Median WY216 Minimum 1% 3% 5% 7% 9% Maximum 5 Animas River at Durango, CO Daily and Cumulative Discharge Compared to Current Streamflow Forecasts (Apr - Jul) % Exceedance Forecast 7% Exceedance Forecast 5% Exceedance Forecast 3% Exceedance Forecast 1% Exceedance Forecast Average Discharge 215 Cumulative Discharge 215 Hydrograph 216 Cumulative Data 216 Hydrograph 1-Mar 1-Apr 1-May 1-Jun 1-Jul 1-Aug 1-Sep Please refer to the sections at the end of this report for further explanation concerning these graphs.

37 How to Read Non-Exceedance Projections Graphs The graphs show snow water equivalent (SWE) projections (in inches) for the October 1 through September 3 water year. Basin observed SWE values are computed using SNOTEL sites which are characteristic of the snowpack of the particular basin. The SWE observations at these sites are averaged and normalized to produce these basin snowpack graphs. This new graph format uses non-exceedance projections. Current water year is represented by the heavy red line terminating on the last day the graphic was updated. Historical observed percentile range is shown as a gray background area on the graph. Shades of gray indicate maximum, 9 percentile, 7 percentile, 5 percentile (solid black line), 3 percentile, 1 percentile, and minimum for the period of record. Projections for maximum, 9 percent, 7 percent, 5 percent (most probabilistic snowpack projection, based on median), 3 percent, 1 percent, and minimum exceedances are projected forward from the end of the current line as different colored lines. For more detailed information on these graphs visit: Projections
38 Explanation of Flow Comparison Charts The flow comparison charts were developed to provide a quick comparison between the previous years observed hydrograph, cumulative seasonal discharge, the current streamflow forecasts, and the current years observed discharge (both hydrograph and cumulative discharge, as the season progresses). Forecast points for these products were generally chosen to be lower in the basin to best represent the basin-wide streamflow response for the season; the true degree of representativeness will vary between basins. When making comparisons of how the shape of the hydrograph relates to the monthly (and seasonal) cumulative discharges it is important to note that the hydrograph represents observed daily flows at the forecast point while the cumulative values may be adjusted for changes in reservoir storage and diversions to best represent what would be natural flows if these impoundments and diversions did not exist. This product can provide additional guidance regarding how to most wisely utilize the five exceedance forecasts based on past observations, current trends, and future uncertainty for a wide variety of purposes and water users. The left y-axis represents values of adjusted cumulative discharge (KAF). This axis is to be used for comparing the current and previous years to the current five volumetric seasonal exceedance forecasts. This graphic only displays the previous years data but data for the current water year will be added as the season progresses. The legend displays the symbology and color schemes for the various parameters represented. Exceedance forecasts represent total cumulative discharge for the April through July time period with the exception of the Rio Grande at Wagon Wheel Gap (Apr-Sep). The right y-axis represents observed daily average discharge at the forecast point of interest. This graphic only displays the previous years data but data for the current water year will be added as the Season progresses.
39 How Forecasts Are Made For more water supply and resource management information, contact: Brian Domonkos Snow Survey Supervisor USDA, Natural Resources Conservation Service Denver Federal Center, Bldg 56, Rm 264 PO Box Denver, CO Phone (72) Website: Most of the annual streamflow in the western United States originates as snowfall that has accumulated in the mountains during the winter and early spring. As the snowpack accumulates, hydrologists estimate the runoff that will occur when it melts. Measurements of snow water equivalent at selected manual snow courses and automated SNOTEL sites, along with precipitation, antecedent streamflow, and indices of the El Niño / Southern Oscillation are used in computerized statistical and simulation models to prepare runoff forecasts. Unless otherwise specified, all forecasts are for flows that would occur naturally without any upstream influences. Forecasts of any kind, of course, are not perfect. Streamflow forecast uncertainty arises from three primary sources: (1) uncertain knowledge of future weather conditions, (2) uncertainty in the forecasting procedure, and (3) errors in the data. The forecast, therefore, must be interpreted not as a single value but rather as a range of values with specific probabilities of occurrence. The middle of the range is expressed by the 5% exceedance probability forecast, for which there is a 5% chance that the actual flow will be above, and a 5% chance that the actual flow will be below, this value. To describe the expected range around this 5% value, four other forecasts are provided, two smaller values (9% and 7% exceedance probability) and two larger values (3%, and 1% exceedance probability). For example, there is a 9% chance that the actual flow will be more than the 9% exceedance probability forecast. The others can be interpreted similarly. The wider the spread among these values, the more uncertain the forecast. As the season progresses, forecasts become more accurate, primarily because a greater portion of the future weather conditions become known; this is reflected by a narrowing of the range around the 5% exceedance probability forecast. Users should take this uncertainty into consideration when making operational decisions by selecting forecasts corresponding to the level of risk they are willing to assume about the amount of water to be expected. If users anticipate receiving a lesser supply of water, or if they wish to increase their chances of having an adequate supply of water for their operations, they may want to base their decisions on the 9% or 7% exceedance probability forecasts, or something in between. On the other hand, if users are concerned about receiving too much water (for example, threat of flooding), they may want to base their decisions on the 3% or 1% exceedance probability forecasts, or something in between. Regardless of the forecast value users choose for operations, they should be prepared to deal with either more or less water. (Users should remember that even if the 9% exceedance probability forecast is used, there is still a 1% chance of receiving less than this amount.) By using the exceedance probability information, users can easily determine the chances of receiving more or less water.
40
Colorado Water Supply Outlook Report January 1, 2018
 Colorado Water Supply Outlook Report January 1, 2018 A mid-mountain vantage point at Crested Butte Ski area provides a view of the low-snow conditions in the surrounding area. On December 19 th, when this
A Review of the 2007 Water Year in Colorado
 A Review of the 2007 Water Year in Colorado Nolan Doesken Colorado Climate Center, CSU Mike Gillespie Snow Survey Division, USDA, NRCS Presented at the 28 th Annual AGU Hydrology Days, March 26, 2008,
The Colorado Drought : 2003: A Growing Concern. Roger Pielke, Sr. Colorado Climate Center.
 The Colorado Drought 2001-2003: 2003: A Growing Concern Roger Pielke, Sr. Colorado Climate Center Prepared by Tara Green and Odie Bliss http://climate.atmos.colostate.edu 2 2002 Drought History in Colorado
Colorado s 2003 Moisture Outlook
 Colorado s 2003 Moisture Outlook Nolan Doesken and Roger Pielke, Sr. Colorado Climate Center Prepared by Tara Green and Odie Bliss http://climate.atmos.colostate.edu How we got into this drought! Fort
A Review of the 2003 Water Year in Colorado
 Hydrology Days 24 A Review of the 23 Water Year in Colorado Nolan J. Doesken 1 Colorado Climate Center, Atmospheric Science Department, Colorado State University, Fort Collins, Colorado Michael A. Gillespie
2003 Moisture Outlook
 2003 Moisture Outlook Nolan Doesken and Roger Pielke, Sr. Colorado Climate Center Prepared by Tara Green and Odie Bliss http://climate.atmos.colostate.edu Through 1999 Through 1999 Fort Collins Total Water
Webinar and Weekly Summary February 15th, 2011
 Webinar and Weekly Summary February 15th, 2011 -Assessment of current water conditions - Precipitation Forecast - Recommendations for Drought Monitor Upper Colorado Normal Precipitation Upper Colorado
Becky Bolinger Water Availability Task Force November 13, 2018
 Colorado Climate Center WATF Climate Update Becky Bolinger Water Availability Task Force November 13, 2018 COLORADO CLIMATE CENTER Water Year 2018 Colorado s Climate in Review COLORADO CLIMATE CENTER
Highlights of the 2006 Water Year in Colorado
 Highlights of the 2006 Water Year in Colorado Nolan Doesken, State Climatologist Atmospheric Science Department Colorado State University http://ccc.atmos.colostate.edu Presented to 61 st Annual Meeting
PRECIPITATION. Last Week Precipitation:
 2/24/2015 NIDIS Drought and Water Assessment PRECIPITATION The images above use daily precipitation statistics from NWS COOP, CoCoRaHS, and CoAgMet stations. From top to bottom, and left to right: most
PRECIPITATION. Last Week Precipitation:
 12/3/2014 NIDIS Drought and Water Assessment PRECIPITATION The images above use daily precipitation statistics from NWS COOP, CoCoRaHS, and CoAgMet stations. From top to bottom, and left to right: most
Drought and Future Water for Southern New Mexico
 Drought and Future Water for Southern New Mexico David S. Gutzler University of New Mexico gutzler@unm.edu * The big drought of 2018 * Longer term challenges for water supply * Forecasting streamflow Elephant
Oregon Water Conditions Report May 1, 2017
 Oregon Water Conditions Report May 1, 2017 Mountain snowpack in the higher elevations has continued to increase over the last two weeks. Statewide, most low and mid elevation snow has melted so the basin
NIDIS Drought and Water Assessment
 NIDIS Drought and Water Assessment PRECIPITATION The images above use daily precipitation statistics from NWS COOP, CoCoRaHS, and CoAgMet stations. From top to bottom, and left to right: most recent 7-days
2003 Water Year Wrap-Up and Look Ahead
 2003 Water Year Wrap-Up and Look Ahead Nolan Doesken Colorado Climate Center Prepared by Odie Bliss http://ccc.atmos.colostate.edu Colorado Average Annual Precipitation Map South Platte Average Precipitation
Upper Missouri River Basin February 2018 Calendar Year Runoff Forecast February 6, 2018
 Upper Missouri River Basin February 2018 Calendar Year Runoff Forecast February 6, 2018 Calendar Year Runoff Forecast Explanation and Purpose of Forecast U.S. Army Corps of Engineers, Northwestern Division
DK DM M EMORANDUM D ECEMBER 28, 2018 SUBJECT:
 TO: CC: FROM: SUBJECT: BOARD OF DIRECTORS M EMORANDUM D ECEMBER 28, 2018 ANDY MUELLER, GENERAL MANAGER DAVE DK KANZER, P.E. & DON MEYER, P.E. DK DM COLORADO RIVER BASIN WATER SUPPLY CONDITIONS UPDATE AND
The following information is provided for your use in describing climate and water supply conditions in the West as of April 1, 2003.
 Natural Resources Conservation Service National Water and Climate Center 101 SW Main Street, Suite 1600 Portland, OR 97204-3224 Date: April 8, 2003 Subject: April 1, 2003 Western Snowpack Conditions and
California Water Supply Outlook Report
 UNITED STATES DEPARTMENT OF AGRICULTURE NATURAL RESOURCES CONSERVATION SERVICE California Water Supply Outlook Report March, 2017 Photo taken on February 28, 2017 by NRCS. NRCS snow surveyors measuring
Missouri River Basin Water Management Monthly Update
 Missouri River Basin Water Management Monthly Update Participating Agencies 255 255 255 237 237 237 0 0 0 217 217 217 163 163 163 200 200 200 131 132 122 239 65 53 80 119 27 National Oceanic and Atmospheric
NIDIS Intermountain West Drought Early Warning System April 18, 2017
 1 of 11 4/18/2017 3:42 PM Precipitation NIDIS Intermountain West Drought Early Warning System April 18, 2017 The images above use daily precipitation statistics from NWS COOP, CoCoRaHS, and CoAgMet stations.
Modeling of peak inflow dates for a snowmelt dominated basin Evan Heisman. CVEN 6833: Advanced Data Analysis Fall 2012 Prof. Balaji Rajagopalan
 Modeling of peak inflow dates for a snowmelt dominated basin Evan Heisman CVEN 6833: Advanced Data Analysis Fall 2012 Prof. Balaji Rajagopalan The Dworshak reservoir, a project operated by the Army Corps
Missouri River Basin Water Management Monthly Update
 Missouri River Basin Water Management Monthly Update Participating Agencies 255 255 255 237 237 237 0 0 0 217 217 217 163 163 163 200 200 200 131 132 122 239 65 53 80 119 27 National Oceanic and Atmospheric
Drought in Southeast Colorado
 Drought in Southeast Colorado Nolan Doesken and Roger Pielke, Sr. Colorado Climate Center Prepared by Tara Green and Odie Bliss http://climate.atmos.colostate.edu 1 Historical Perspective on Drought Tourism
The Colorado Drought of 2002 in Perspective
 The Colorado Drought of 2002 in Perspective Colorado Climate Center Nolan Doesken and Roger Pielke, Sr. Prepared by Tara Green and Odie Bliss http://climate.atmos.colostate.edu Known Characteristics of
Missouri River Basin Water Management
 Missouri River Basin Water Management US Army Corps of Engineers Missouri River Navigator s Meeting February 12, 2014 Bill Doan, P.E. Missouri River Basin Water Management US Army Corps of Engineers BUILDING
Souris River Basin Spring Runoff Outlook As of March 1, 2019
 Souris River Basin Spring Runoff Outlook As of March 1, 2019 Prepared by: Flow Forecasting & Operations Planning Water Security Agency Basin Conditions Summer rainfall in 2018 over the Saskatchewan portion
Upper Missouri River Basin January 2018 Calendar Year Runoff Forecast January 3, 2018
 Calendar Year Runoff Forecast Upper Missouri River Basin January 2018 Calendar Year Runoff Forecast January 3, 2018 Explanation and Purpose of Forecast U.S. Army Corps of Engineers, Northwestern Division
PRELIMINARY DRAFT FOR DISCUSSION PURPOSES
 Memorandum To: David Thompson From: John Haapala CC: Dan McDonald Bob Montgomery Date: February 24, 2003 File #: 1003551 Re: Lake Wenatchee Historic Water Levels, Operation Model, and Flood Operation This
Oregon Water Conditions Report April 17, 2017
 Oregon Water Conditions Report April 17, 2017 Mountain snowpack continues to maintain significant levels for mid-april. By late March, statewide snowpack had declined to 118 percent of normal after starting
HyMet Company. Streamflow and Energy Generation Forecasting Model Columbia River Basin
 HyMet Company Streamflow and Energy Generation Forecasting Model Columbia River Basin HyMet Inc. Courthouse Square 19001 Vashon Hwy SW Suite 201 Vashon Island, WA 98070 Phone: 206-463-1610 Columbia River
2015 Fall Conditions Report
 2015 Fall Conditions Report Prepared by: Hydrologic Forecast Centre Date: December 21 st, 2015 Table of Contents Table of Figures... ii EXECUTIVE SUMMARY... 1 BACKGROUND... 2 SUMMER AND FALL PRECIPITATION...
Missouri River Basin Water Management Monthly Update
 Missouri River Basin Water Management Monthly Update Participating Agencies 255 255 255 237 237 237 0 0 0 217 217 217 163 163 163 200 200 200 131 132 122 239 65 53 80 119 27 National Oceanic and Atmospheric
NIDIS Intermountain West Regional Drought Early Warning System February 7, 2017
 NIDIS Drought and Water Assessment NIDIS Intermountain West Regional Drought Early Warning System February 7, 2017 Precipitation The images above use daily precipitation statistics from NWS COOP, CoCoRaHS,
Missouri River Basin Climate Outlook 1 May Dr. Dennis Todey State Climatologist South Dakota State Univ.
 Missouri River Basin Climate Outlook 1 May 2014 Dr. Dennis Todey State Climatologist South Dakota State Univ. dennis.todey@sdstate.edu 605-688-5141 Photo taken Feb 19, 2013 General Information Providing
Upper Missouri River Basin December 2017 Calendar Year Runoff Forecast December 5, 2017
 Upper Missouri River Basin December 2017 Calendar Year Runoff Forecast December 5, 2017 Calendar Year Runoff Forecast Explanation and Purpose of Forecast U.S. Army Corps of Engineers, Northwestern Division
Souris River Basin Spring Runoff Outlook As of March 15, 2018
 Souris River Basin Spring Runoff Outlook As of March 15, 2018 Prepared by: Flow Forecasting & Operations Planning Water Security Agency Basin Conditions Summer rainfall in 2017 in the Saskatchewan portion
CRP HEL CRP Ortho Imagery. Tract Cropland Total: acres
 United States Department of Agriculture Madison County, Iowa 17 4.09 23 1.26 6 10.74 14 2.89 12 1.7 1 18.02 230TH LN T 347 3 34 4.65 13 2.81 2 11.4 ELMWOOD AVE 16 3 6.49 18 6.5 1.59 21 2.35 8.76 24 11
San Francisco Public Utilities Commission Hydrological Conditions Report For March 2016
 San Francisco Public Utilities Commission Hydrological Conditions Report For March 2016 J. Chester, C. Graham, A. Mazurkiewicz, & M. Tsang, April 7, 2016 Snow Surveyor Chris Graham crossing Huckleberry
Let s Talk Climate! Nolan Doesken Colorado Climate Center Colorado State University. Yampatika Seminar February 16, 2011 Steamboat Springs, Colorado
 Let s Talk Climate! Nolan Doesken Colorado Climate Center Colorado State University Yampatika Seminar February 16, 2011 Steamboat Springs, Colorado First -- A short background In 1973 the federal government
March 1, 2003 Western Snowpack Conditions and Water Supply Forecasts
 Natural Resources Conservation Service National Water and Climate Center 101 SW Main Street, Suite 1600 Portland, OR 97204-3224 Date: March 17, 2003 Subject: March 1, 2003 Western Snowpack Conditions and
January 25, Summary
 January 25, 2013 Summary Precipitation since the December 17, 2012, Drought Update has been slightly below average in parts of central and northern Illinois and above average in southern Illinois. Soil
Preliminary Runoff Outlook February 2018
 Preliminary Runoff Outlook February 2018 Prepared by: Flow Forecasting & Operations Planning Water Security Agency General Overview The Water Security Agency (WSA) is preparing for 2018 spring runoff including
-Assessment of current water conditions. - Precipitation Forecast. - Recommendations for Drought Monitor
 April 27, 2010 -Assessment of current water conditions - Precipitation Forecast - Recommendations for Drought Monitor 7 Day Precipitation 19-25 April 2010 Month-to-Date Precipitation 1-25 April 2010
Lower Tuolumne River Accretion (La Grange to Modesto) Estimated daily flows ( ) for the Operations Model Don Pedro Project Relicensing
 Estimated daily flows ( ) for the Operations Model Don Pedro Project Relicensing") Lower Tuolumne River Accretion (La Grange to Modesto) Estimated daily flows (1970-2010) for the Operations Model Don Pedro Project Relicensing 1.0 Objective Using available data, develop a daily time series
Lower Tuolumne River Accretion (La Grange to Modesto) Estimated daily flows (1970-2010) for the Operations Model Don Pedro Project Relicensing 1.0 Objective Using available data, develop a daily time series
COLORADO WATER SUPPLY CONDITIONS UPDATE
 COLORADO WATER SUPPLY CONDITIONS UPDATE FROM THE OFFICE OF THE STATE ENGINEER: COLORADO DIVISION OF WATER RESOURCES December 211 ROOM 818, 1313 SHERMAN ST., DENVER, CO 823 33-866-3581; www.water.state.co.us
A Report on a Statistical Model to Forecast Seasonal Inflows to Cowichan Lake
 A Report on a Statistical Model to Forecast Seasonal Inflows to Cowichan Lake Prepared by: Allan Chapman, MSc, PGeo Hydrologist, Chapman Geoscience Ltd., and Former Head, BC River Forecast Centre Victoria
NIDIS Weekly Climate, Water and Drought Assessment Summary. Upper Colorado River Basin
 NIDIS Weekly Climate, Water and Drought Assessment Summary Upper Colorado River Basin August 3, 2010 Precipitation and Snowpack Fig. 1: July precipitation in inches Fig. 2: July precip as percent of average
Abbreviated 156 Farm Record
 MISSOURI HOWARD Form: FSA-156EZ See Page 3 for non-discriminatory Statements. United States Department of Agriculture Farm Service Agency Abbreviated 156 Farm Record FARM : Prepared : Crop Year : 4825
Montana Drought & Climate
 Montana Drought & Climate MARCH 219 MONITORING AND FORECASTING FOR AGRICULTURE PRODUCERS A SERVICE OF THE MONTANA CLIMATE OFFICE IN THIS ISSUE IN BRIEF PAGE 2 REFERENCE In a Word PAGE 3 REVIEW Winter 219:
Colorado weather and climate update: a bit more than halfway through the water year (Or: What s going on with the weather?? )
") Colorado weather and climate update: a bit more than halfway through the water year (Or: What s going on with the weather?? ) Russ S. Schumacher Colorado State Climatologist Director, Colorado Climate
Colorado weather and climate update: a bit more than halfway through the water year (Or: What s going on with the weather?? ) Russ S. Schumacher Colorado State Climatologist Director, Colorado Climate
A Recap of Colorado s Water Year 2018
 A Recap of Colorado s Water Year 2018 For further inquiries, please contact: Russ Schumacher, State Climatologist (970) 491-8084 Becky Bolinger, Assistant State Climatologist (970) 491-8506 Peter Goble,
NIDIS Intermountain West Drought Early Warning System January 15, 2019
 NIDIS Drought and Water Assessment NIDIS Intermountain West Drought Early Warning System January 15, 2019 Precipitation The images above use daily precipitation statistics from NWS COOP, CoCoRaHS, and
Water Supply Conditions and Outlook June 4, 2018
 Water Supply Conditions and Outlook June 4, 2018 Flow Forecasting & Operations Planning Water Security Agency Overview Water supply conditions across Saskatchewan are generally good with most reservoir
Wyoming Basin Outlook Report Feb 1, 2019
 United States Department of Agriculture Natural Resources Conservation Service Wyoming Basin Outlook Report Feb 1, 2019 Forecasted stream flows as of Feb 1 st, 2019 Basin Outlook Reports And Federal -
COLORADO WATER SUPPLY CONDITIONS UPDATE
 COLORADO WATER SUPPLY CONDITIONS UPDATE FROM THE OFFICE OF THE STATE ENGINEER: COLORADO DIVISION OF WATER RESOURCES January 215 ROOM 818, 1313 SHERMAN ST., DENVER, CO 823 33-866-3581; www.water.state.co.us
May 2016 Volume 23 Number 5
 The Weather Wire May 2016 Volume 23 Number 5 Contents: Winter Summary Current Colorado and West-wide Snow Pack Drought Monitor April Summary/Statistics May Preview Snowfall Totals Winter Summary The Front
NIDIS Weekly Climate, Water and Drought Assessment Summary. Upper Colorado River Basin July 31, 2012
 NIDIS Weekly Climate, Water and Drought Assessment Summary Upper Colorado River Basin July 31, 2012 Fig. 1: July month-to-date precipitation in inches. Fig. 2: SNOTEL WYTD precipitation percentiles (50%
FORECAST-BASED OPERATIONS AT FOLSOM DAM AND LAKE
 FORECAST-BASED OPERATIONS AT FOLSOM DAM AND LAKE 255 237 237 237 217 217 217 200 200 200 0 163 131 Bridging the Gap163Conference 255 0 132 255 0 163 122 The Dana on Mission Bay San Diego, CA January 28,
COLORADO WATER SUPPLY CONDITIONS UPDATE
 COLORADO WATER SUPPLY CONDITIONS UPDATE FROM THE OFFICE OF THE STATE ENGINEER: COLORADO DIVISION OF WATER RESOURCES February 1, 2017 ROOM 818, 1313 SHERMAN ST., DENVER, CO 80203 303-866-3581; www.water.state.co.us
Great Lakes Update. Volume 193: 2015 January through June Summary. Vol. 193 Great Lakes Update August 2015
 Great Lakes Update Volume 193: 2015 January through June Summary The U.S. Army Corps of Engineers (USACE) monitors the water levels of each of the Great Lakes. This report provides a summary of the Great
NIDIS Intermountain West Drought Early Warning System December 11, 2018
 NIDIS Drought and Water Assessment NIDIS Intermountain West Drought Early Warning System December 11, 2018 Precipitation The images above use daily precipitation statistics from NWS COOP, CoCoRaHS, and
January 2011 Calendar Year Runoff Forecast
 January 2011 Calendar Year Runoff Forecast 2010 Runoff Year Calendar Year 2010 was the third highest year of runoff in the Missouri River Basin above Sioux City with 38.8 MAF, behind 1978 and 1997 which
ACCUMULATED PRECIPITATION IN INCHES
 CUMULATIVE PRECIPITATION WATER YEAR COLUMBIA BASIN ABOVE GRAND COULEE 84% of Normal 1971- Average ACCUMULATED PRECIPITATION IN INCHES 8 6 82% of Normal 85% of Normal 82% of Normal SNAKE RIVER BASIN ABOVE
Upper Missouri River Basin May 2018 Calendar Year Runoff Forecast May 4, 2018
 Calendar Year Runoff Forecast Explanation and Purpose of Forecast Upper Missouri River Basin May 2018 Calendar Year Runoff Forecast May 4, 2018 U.S. Army Corps of Engineers, Northwestern Division Missouri
Precipitation. Standardized Precipitation Index. NIDIS Intermountain West Regional Drought Early Warning System January 3, 2017
 1/3/2017 NIDIS Drought and Water Assessment NIDIS Intermountain West Regional Drought Early Warning System January 3, 2017 Precipitation The images above use daily precipitation statistics from NWS COOP,
Forecast Challenges for the Colorado Basin River Forecast Center
 Forecast Challenges for the Colorado Basin River Forecast Center John Lhotak, Development and Operations Hydrologist Improving Sub-Seasonal to Seasonal (S2S) Workshop May 16th, 2018 1 River Forecast Centers
What Does It Take to Get Out of Drought?
 What Does It Take to Get Out of Drought? Nolan J. Doesken Colorado Climate Center Colorado State University http://ccc.atmos.colostate.edu Presented at the Insects, Diseases and Drought Workshop, May 19,
-Assessment of current water conditions. - Precipitation Forecast. - Recommendations for Drought Monitor
 2 May 8 th, 2012 -Assessment of current water conditions - Precipitation Forecast - Recommendations for Drought Monitor AHPS Analysis 5/7/12 7-day average discharge compared to historical
NIDIS Intermountain West Drought Early Warning System May 1, 2018
 NIDIS Intermountain West Drought Early Warning System May 1, 2018 Precipitation The images above use daily precipitation statistics from NWS COOP, CoCoRaHS, and CoAgMet stations. From top to bottom, and
Wyoming Basin & Water Supply Outlook Report March 1, 2019
 United States Department of Agriculture Natural Resources Conservation Service Wyoming Basin & Water Supply Outlook Report March 1, 2019 Forecasted stream flows for March 1 st, 2019 Basin Outlook Reports
 October 16 th, 2012 2010-12 La Niña event reached its biggest peak since the mid-70s in late 2010, followed by a brief excursion to ENSOneutral conditions during mid-2011; it reached a second peak last
-Assessment of current water conditions. - Precipitation Forecast. - Recommendations for Drought Monitor
 2 May 1 st, 2012 -Assessment of current water conditions - Precipitation Forecast - Recommendations for Drought Monitor AHPS Water Year Precipitation as Percentage of Normal 7-day average
NIDIS Weekly Climate, Water and Drought Assessment Summary Upper Colorado River Basin Pilot Project 13 July 2010
 NIDIS Weekly Climate, Water and Drought Assessment Summary Upper Colorado River Basin Pilot Project 13 July 2010 Precipitation and Snowpack Over the past week, precipitation in the Upper Colorado River
Wyoming Basin Outlook Report May 1, 2016
 United States Department of Agriculture Natural Resources Conservation Service Wyoming Basin Outlook Report May 1, 2016 Med Bow SNOTEL #1196 (Medicine Bow Forest above Saratoga, WY) ID O6H26S established
NIDIS Intermountain West Drought Early Warning System February 12, 2019
 NIDIS Intermountain West Drought Early Warning System February 12, 2019 Precipitation The images above use daily precipitation statistics from NWS COOP, CoCoRaHS, and CoAgMet stations. From top to bottom,
NIDIS Intermountain West Drought Early Warning System February 19, 2019
 NIDIS Intermountain West Drought Early Warning System February 19, 2019 Precipitation The images above use daily precipitation statistics from NWS COOP, CoCoRaHS, and CoAgMet stations. From top to bottom,
Utah Climate and Water Report
 Utah State University DigitalCommons@USU Water U.S. Government Documents (Utah Regional Depository) 2010 Utah Climate and Water Report U.S. Natural Resources Conservation Service Follow this and additional
NIDIS Weekly Climate, Water and Drought Assessment Summary. Upper Colorado River Basin June 21, 2011
 NIDIS Weekly Climate, Water and Drought Assessment Summary Upper Colorado River Basin June 21, 2011 PrecipitaEon and Snowpack Fig. 1: June month to date precipitaeon in inches. Fig. 2: 24 hour accumulated
YACT (Yet Another Climate Tool)? The SPI Explorer
? The SPI Explorer") YACT (Yet Another Climate Tool)? The SPI Explorer Mike Crimmins Assoc. Professor/Extension Specialist Dept. of Soil, Water, & Environmental Science The University of Arizona Yes, another climate tool for
YACT (Yet Another Climate Tool)? The SPI Explorer Mike Crimmins Assoc. Professor/Extension Specialist Dept. of Soil, Water, & Environmental Science The University of Arizona Yes, another climate tool for
2017 Fall Conditions Report
 2017 Fall Conditions Report Prepared by: Hydrologic Forecast Centre Date: November 15, 2017 Table of Contents TABLE OF FIGURES... ii EXECUTIVE SUMMARY... 1 BACKGROUND... 4 SUMMER AND FALL PRECIPITATION...
Midwest and Great Plains Drought and Climate Summary 20 February 2014
 Midwest and Great Plains Drought and Climate Summary 20 February 2014 Wendy Ryan Assistant State Climatologist Colorado Climate Center Colorado State University wendy.ryan@colostate.edu 970-491-8506 General
-Assessment of current water conditions. - Precipitation Forecast. - Recommendations for Drought Monitor
 2 June 12, 2012 -Assessment of current water conditions - Precipitation Forecast - Recommendations for Drought Monitor 7-day average discharge compared to historical discharge for the day
COLORADO WATER SUPPLY CONDITIONS UPDATE
 COLORADO WATER SUPPLY CONDITIONS UPDATE FROM THE OFFICE OF THE STATE ENGINEER: COLORADO DIVISION OF WATER RESOURCES February 1, 2016 ROOM 818, 1313 SHERMAN ST., DENVER, CO 80203 303-866-3581; www.water.state.co.us
Hydrologic Conditions in the Delaware River Basin
 Hydrologic Conditions in the Delaware River Basin April : Flooding in Lambertville, New Jersey Aerial photo used with permission of www.elevated-images.com Annual Report Prepared by Operations Staff June
THE STATE OF SURFACE WATER GAUGING IN THE NAVAJO NATION
 THE STATE OF SURFACE WATER GAUGING IN THE NAVAJO NATION Aregai Tecle Professor of Hydrology Northern Arizona University Flagstaff, AZ Acknowledgement Many thanks to my research team mates and Elisabeth
Changing Hydrology under a Changing Climate for a Coastal Plain Watershed
 Changing Hydrology under a Changing Climate for a Coastal Plain Watershed David Bosch USDA-ARS, Tifton, GA Jeff Arnold ARS Temple, TX and Peter Allen Baylor University, TX SEWRU Objectives 1. Project changes
San Francisco Public Utilities Commission Hydrological Conditions Report For April 2014
 San Francisco Public Utilities Commission Hydrological Conditions Report For April 2014 J. Chester, C. Graham, A. Mazurkiewicz, & M. Tsang, May 13, 2014 Snow in the High Country The view from Bond Pass
NIDIS Intermountain West Drought Early Warning System October 30, 2018
 10/30/2018 NIDIS Drought and Water Assessment NIDIS Intermountain West Drought Early Warning System October 30, 2018 Precipitation The images above use daily precipitation statistics from NWS COOP, CoCoRaHS,
Missouri River Basin Water Management Monthly Update
 Missouri River Basin Water Management Monthly Update Participating Agencies 255 255 255 237 237 237 0 0 0 217 217 217 163 163 163 200 200 200 131 132 122 239 65 53 80 119 27 National Oceanic and Atmospheric
NIDIS Intermountain West Drought Early Warning System October 17, 2017
 NIDIS Drought and Water Assessment NIDIS Intermountain West Drought Early Warning System October 17, 2017 Precipitation The images above use daily precipitation statistics from NWS COOP, CoCoRaHS, and
Monthly Long Range Weather Commentary Issued: APRIL 18, 2017 Steven A. Root, CCM, Chief Analytics Officer, Sr. VP,
 Monthly Long Range Weather Commentary Issued: APRIL 18, 2017 Steven A. Root, CCM, Chief Analytics Officer, Sr. VP, sroot@weatherbank.com MARCH 2017 Climate Highlights The Month in Review The average contiguous
Chiang Rai Province CC Threat overview AAS1109 Mekong ARCC
 Chiang Rai Province CC Threat overview AAS1109 Mekong ARCC This threat overview relies on projections of future climate change in the Mekong Basin for the period 2045-2069 compared to a baseline of 1980-2005.
NIDIS Drought and Water Assessment
 7/23/13 1:57 PM PRECIPITATION The images above use daily precipitation statistics from NWS COOP, CoCoRaHS, and CoAgMet stations. From top to bottom, and left to right: most recent 7-days of accumulated
NIDIS Intermountain West Drought Early Warning System February 6, 2018
 NIDIS Intermountain West Drought Early Warning System February 6, 2018 Precipitation The images above use daily precipitation statistics from NWS COOP, CoCoRaHS, and CoAgMet stations. From top to bottom,
-Assessment of current water conditions. - Precipitation Forecast. - Recommendations for Drought Monitor
 May 31 st, 2011 -Assessment of current water conditions - Precipitation Forecast - Recommendations for Drought Monitor Upper Colorado River Basin Snow Snowpack % of average to date: 347% Percent
-Assessment of current water conditions. - Precipitation Forecast. - Recommendations for Drought Monitor
 2 June 26 th, 2012 -Assessment of current water conditions - Precipitation Forecast - Recommendations for Drought Monitor CMPDSI Value Percentile Rank Characteristic -1.0 - -1.9 21-30 Abnormally
Sierra Weather and Climate Update
 Sierra Weather and Climate Update 2014-15 Kelly Redmond Western Regional Climate Center Desert Research Institute Reno Nevada Yosemite Hydroclimate Workshop Yosemite Valley, 2015 October 8-9 Percent of
Great Lakes Update. Volume 199: 2017 Annual Summary. Background
 Great Lakes Update Volume 199: 2017 Annual Summary Background The U.S. Army Corps of Engineers (USACE) tracks and forecasts the water levels of each of the Great Lakes. This report is primarily focused
Wind River Indian Reservation and Surrounding Area Climate and Drought Summary
 Northern Arapaho Tribe Wind River Indian Reservation and Surrounding Area Climate and Drought Summary Spring Events & Summer Outlook 2015 Spring Was Warm And Very Wet Across The Region The spring season