COLORADO WATER SUPPLY CONDITIONS UPDATE
|
|
|
- Flora Day
- 5 years ago
- Views:
Transcription
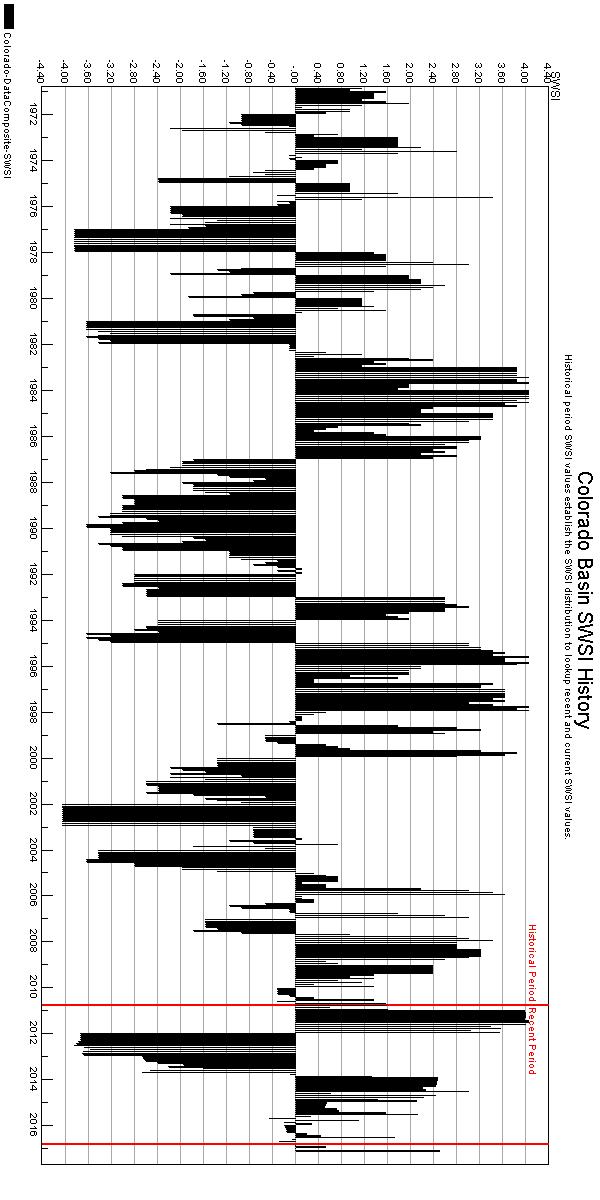
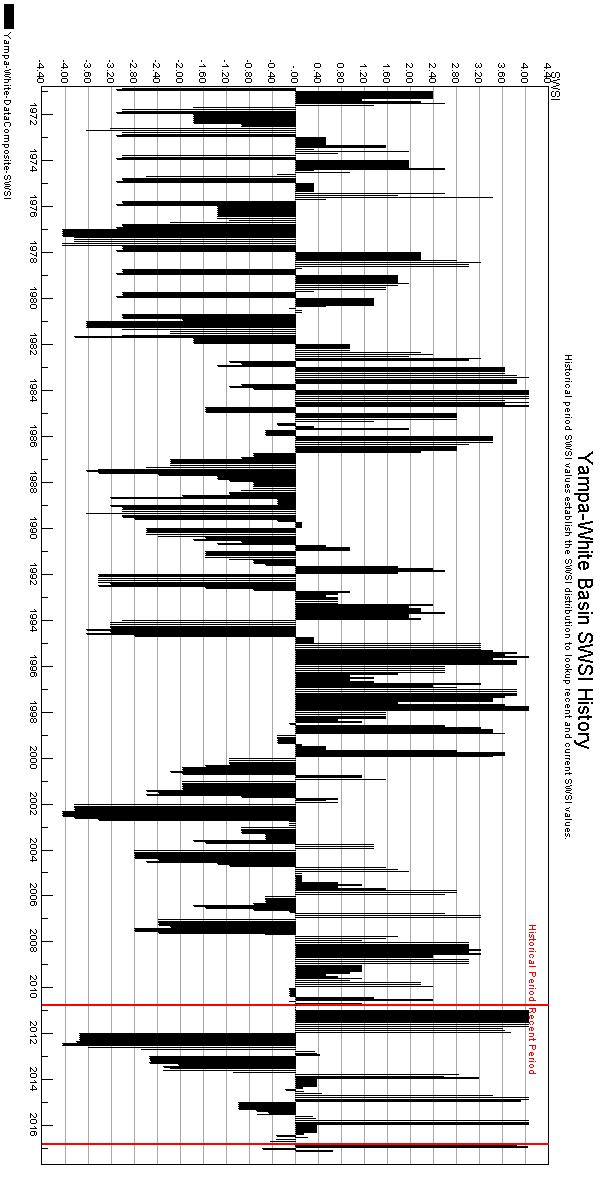
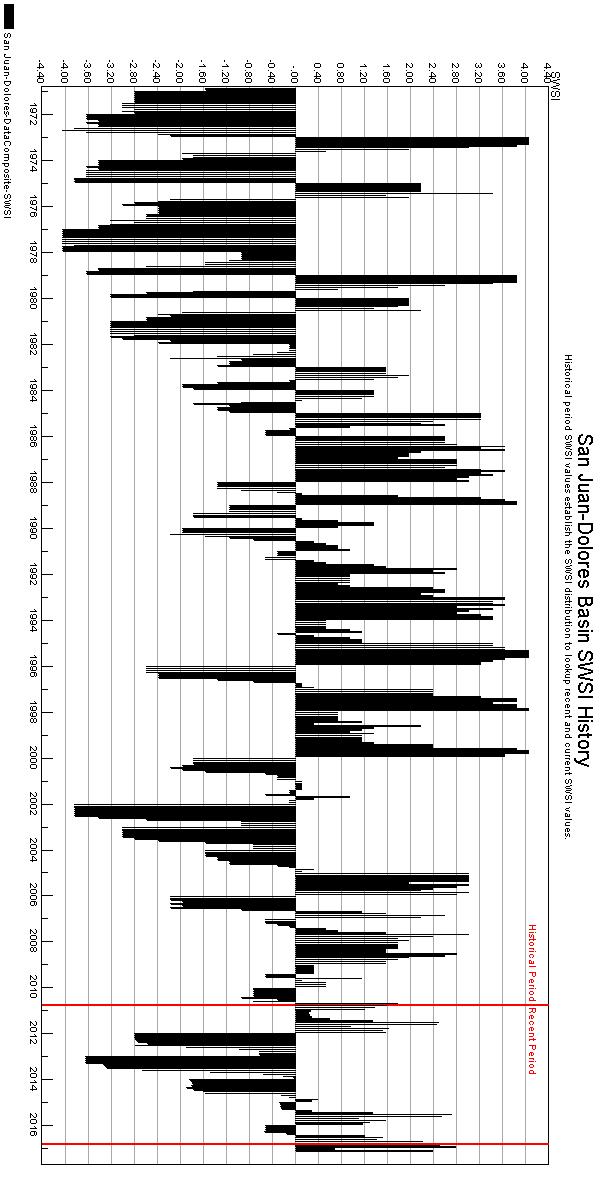
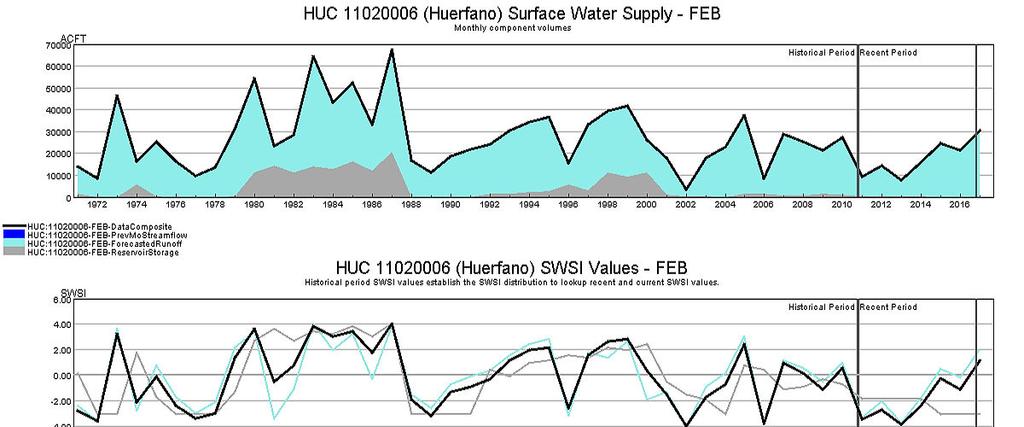
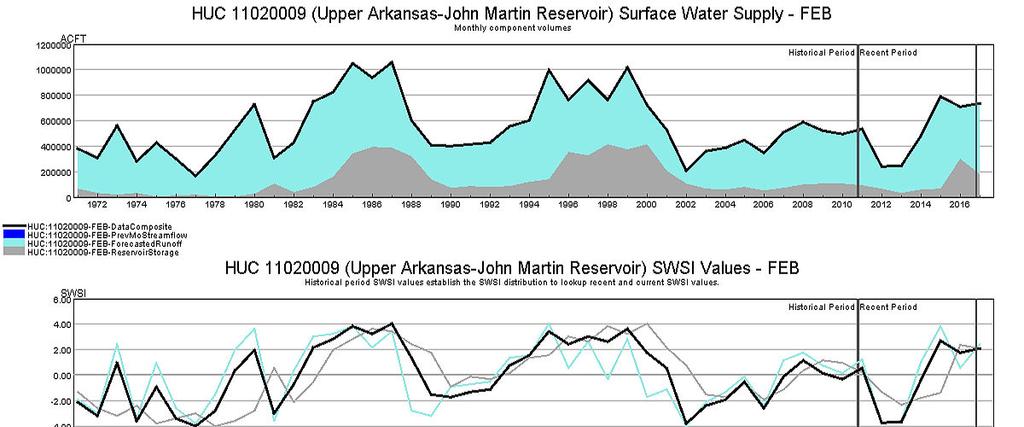
1 COLORADO WATER SUPPLY CONDITIONS UPDATE FROM THE OFFICE OF THE STATE ENGINEER: COLORADO DIVISION OF WATER RESOURCES February 1, 2017 ROOM 818, 1313 SHERMAN ST., DENVER, CO ; The Surface Water Supply Index (SWSI) is used as an indicator of water supply conditions in the seven major river basins of the state and in each of the 41 smaller watersheds, or HUCs. The Colorado Water Conservation Board (CWCB) completed a major revision to the Colorado Drought Plan in At that time, Colorado adopted a revised SWSI analysis based on the components shown below, which vary depending on the time of year. The revised SWSI is based on a ranking of total volume in a HUC or major river basin ranked against similar volumes in historical years. For instance, in January, the total volume in a HUC is based on the forecasted runoff at specific locations plus the volume in storage in specific reservoirs, all within the HUC. That total volume is ranked against similar total volumes that occurred each January between 1970 and Time Period January 1 June 1 July 1 September 1 October 1 December 1 SWSI Components Forecasted Runoff + Reservoir Storage Previous Month's Streamflow + Reservoir Storage Reservoir Storage In 2015, CWCB and the Division of Water Resources (DWR) (both Divisions of the Colorado Department of Natural Resources) completed a software project to implement an automated calculation of the SWSI and to document the underlying hydrologic data. July 1, 2015 was the first month that the automated DNR SWSI was published. The results of each month s analysis are summarized within this report and additional information, maps & data are available at: This report also contains updates about current regional conditions and water matters prepared by each DWR Division Office. The SWSI calculation for the winter season (January 1 to June 1) is based on forecasted runoff (total volume for runoff season) combined with reservoir storage at the end of last month, in this case January 31. The statewide SWSI values for February 1 are all above normal with most basins showing abundant supply. The SWSI values range from a low of +0.6 in the Yampa-White Basin a high of +2.9 in the Gunnison Basin. The following SWSI values were computed for each of the seven major basins for February 1, The results for each HUC are summarized on the following pages. Basin February 1 SWSI Change from Previous Month Change from Previous Year Arkansas Colorado Gunnison Rio Grande San Juan-Dolores South Platte Yampa-White SWSI Scale Severe Moderate Near Normal Above Normal Abundant Drought Drought Supply Supply Supply 1
2 SURFACE WATER SUPPLY INDEX FOR COLORADO BY MAJOR RIVER BASIN YAMPA - WHITE +0.6 SOUTH PLATTE +1.7 COLORADO +2.5 LEGEND Major River Basin Boundary SWSI Value GUNNISON +2.9 ARKANSAS SCALE +4 Abundant Supply RIO GRANDE Above Normal Supply 0 Near Normal Supply SAN JUAN - DOLORES Moderate Drought -4 Severe Drought February 1, 2017

3 SURFACE WATER SUPPLY INDEX FOR COLORADO BY HUC February 1, 2017
4 Arkansas Colorado Gunnison Rio Grande San Juan- Dolores South Platte Yampa- White February 1, 2017 SWSI Values by HUC and Non Exceedance Probabilities (NEP) Reservoir Streamflow Basin HUC ID HUC Name SWSI Storage NEP Forecast NEP Total Vol (AF) Arkansas Headwaters , Upper Arkansas , Upper Arkansas-Lake Meredith , Huerfano River , Upper Arkansas-John Martin Reservoir , Purgatoire River , Colorado Headwaters ,895, Blue River , Eagle River 1.7 NA , Roaring Fork , Colorado Headwaters-Plateau ,081, East-Taylor , Upper Gunnison ,866, Tomichi Creek , North Fork Gunnison , Lower Gunnison 2.6 NA 81 2,120, Uncompahgre River , San Miguel 2.6 NA , Rio Grande Headwaters , Alamosa-Trinchera , Saguache Creek 2.2 NA 77 40, Conejos River , Upper Dolores , Upper San Juan , Piedra River 1.4 NA , Animas River , Middle San Juan , Mancos River , South Platte Headwaters , Upper South Platte , Middle South Platte-Cherry Creek ,011, Clear Creek 2.2 NA , St. Vrain River , Big Thompson River , Cache La Poudre , Middle South Platte-Sterling ,108, North Platte Headwaters 1.8 NA , Upper Yampa , Lower Yampa 0.7 NA 58 1,110, Little Snake 0.5 NA , Upper White 0.9 NA ,000 NEP is non exceedance percentage for total reservoir storage and streamflow forecast in each HUC. NEP is calculated compared to either the actual volumes in storage historically occurring this month or streamflow during the runoff period for the years Some HUCs do not have any reservoirs considered in the SWSI. Total Vol is the volume of reservoir storage and streamflow forecast in the HUC. The following table lists each component considered in each HUC. SWSI Color Scale: -4.0 (Severe Drought) 0 (Normal) 4.0 (Abundant Supply) 4
5 February 1, 2017 SWSI Component Information By HUC HUC ID HUC Name Component Name Arkansas Headwaters Upper Arkansas Upper Arkansas- Lake Meredith Huerfano River Upper Arkansas- John Martin Reservoir Purgatoire River Colorado Headwaters Blue River 5 Component Volume (AF) Component NEP for Month CLEAR CREEK RESERVOIR 7, HOMESTAKE RESERVOIR 42, TWIN LAKES RESERVOIR 45, TURQUOISE LAKE 66, ARKANSAS RIVER AT SALIDA 310, PUEBLO RESERVOIR 226, PUEBLO RESERVOIR INFLOW 465, LAKE HENRY 6, HUERFANO RIVER NEAR REDWING 14, CUCHARAS RIVER AT BOYD RANCH NR LA VETA 15, MEREDITH RESERVOIR 33, PUEBLO RESERVOIR INFLOW 465, CUCHARAS RESERVOIR* 0 13 HUERFANO RIVER NEAR REDWING 14, CUCHARAS RIVER AT BOYD RANCH NR LA VETA 15, HUERFANO RIVER NEAR REDWING 14, CUCHARAS RIVER AT BOYD RANCH NR LA VETA 15, ADOBE CREEK RESERVOIR 58, PURGATOIRE RIVER AT TRINIDAD 61, JOHN MARTIN RESERVOIR 120, PUEBLO RESERVOIR INFLOW 465, TRINIDAD LAKE 24, PURGATOIRE RIVER AT TRINIDAD 61, WOLFORD MOUNTAIN RESERVOIR 50, WILLIAMS FORK RESERVOIR 74, COLORADO RIVER NEAR DOTSERO 1,770, GREEN MOUNTAIN RESERVOIR 60, BLUE RIVER INFLOW TO GREEN MOUNTAIN RES 345, Eagle River EAGLE RIVER BELOW GYPSUM 395, RUEDI RESERVOIR 67, Roaring Fork ROARING FORK AT GLENWOOD SPRINGS 900, Colorado Headwaters-Plateau East-Taylor Upper Gunnison Tomichi Creek VEGA RESERVOIR 11, COLORADO RIVER NEAR CAMEO 3,070, TAYLOR PARK RESERVOIR 69, TAYLOR R INF TO TAYLOR PARK RESERVOIR 140, EAST RIVER AT ALMONT 270, FRUITLAND RESERVOIR SILVER JACK RESERVOIR 2, CRAWFORD RESERVOIR 5, MORROW POINT RESERVOIR 111, LAKE FORK AT GATEVIEW, CO 160, BLUE MESA RESERVOIR 586, GUNNISON R INF TO BLUE MESA RESERVOIR 1,000, VOUGA RESERVOIR NEAR DOYLEVILLE TOMICHI CREEK AT GUNNISON, CO 110,000 80
6 HUC ID HUC Name Component Name Component Volume (AF) Component NEP for Month PAONIA RESERVOIR 1, North Fork Gunnison NORTH FORK GUNNISON R NR SOMERSET 400, Lower Gunnison GUNNISON RIVER NR GRAND JUNCTION 2,120, RIDGEWAY RESERVOIR 63, Uncompahgre River UNCOMPAHGRE RIVER AT COLONA 170, San Miguel SAN MIGUEL RIVER NEAR PLACERVILLE 170, Rio Grande Headwaters Alamosa-Trinchera CONTINENTAL RESERVOIR 9, SANTA MARIA RESERVOIR 16, RIO GRANDE RESERVOIR 24, RIO GRANDE NEAR DEL NORTE 600, MOUNTAIN HOME 3, TERRACE RESERVOIR 4, TRINCHERA CK 22, UTE CREEK 22, SANGRE DE CRISTO 30, CULEBRA CREEK AT SAN LUIS 41, ALAMOSA CREEK ABOVE TERRACE RESERVOIR 81, Saguache Creek SAGUACHE CREEK NEAR SAGUACHE, CO 40, Conejos River PLATORO RESERVOIR 15, CONEJOS RIVER NEAR MOGOTE 250, GROUNDHOG RESERVOIR 18, Upper Dolores MCPHEE RESERVOIR 294, DOLORES RIVER BELOW MCPHEE RESERVOIR 420, VALLECITO RESERVOIR 84, Upper San Juan LOS PINOS RIVER NEAR BAYFIELD 225, SAN JUAN RIVER NEAR CARRACAS 550, Piedra River PIEDRA RIVER NEAR ARBOLES 255, LEMON RESERVOIR 20, Animas River FLORIDA RIVER INFLOW TO LEMON RESERVOIR 65, ANIMAS RIVER AT DURANGO 520, Middle San Juan LONG HOLLOW RESERVOIR LA PLATA RIVER AT HESPERUS 31, Mancos River JACKSON GULCH RESERVOIR 5, MANCOS RIVER NEAR MANCOS 43, South Platte Headwaters Upper South Platte ANTERO RESERVOIR 14, SPINNEY MOUNTAIN RESERVOIR 27, ELEVENMILE CANYON RESV INFLOW 52, ELEVENMILE CANYON RESERVOIR 99, BEAR CREEK ABV EVERGREEN 17, CHEESMAN LAKE 70, SOUTH PLATTE RIVER AT SOUTH PLATTE 198, DILLON RESERVOIR 219,
7 HUC ID HUC Name Component Name Component Volume (AF) Component NEP for Month HORSECREEK RESERVOIR 7, BEAR CREEK ABV EVERGREEN 17, MILTON RESERVOIR 19, BARR LAKE 24, STANDLEY RESERVOIR 32, Middle South Platte- SOUTH BOULDER CK NR ELDORADO SPRINGS, CO 44, Cherry Creek BOULDER CREEK NEAR ORODELL 62, BIG THOMPSON R AT MOUTH, NR DRAKE, CO 107, SAINT VRAIN CREEK AT LYONS 109, CLEAR CREEK AT GOLDEN 126, SOUTH PLATTE RIVER AT SOUTH PLATTE 198, CACHE LA POUDRE R AT CANYON MOUTH 265, Clear Creek CLEAR CREEK AT GOLDEN 126, TERRY RESERVOIR 4, MARSHALL RESERVOIR 5, UNION RESERVOIR 9, St. Vrain River BUTTONROCK (RALPH PRICE) RESERVOIR 11, GROSS RESERVOIR 12, SOUTH BOULDER CK NR ELDORADO SPRINGS, CO 44, BOULDER CREEK NEAR ORODELL 62, SAINT VRAIN CREEK AT LYONS 109, MARIANO RESERVOIR 1, LAKE LOVELAND RESERVOIR 3,900 8 LONE TREE RESERVOIR 5, Big Thompson River WILLOW CREEK RESERVOIR 6, BOYD LAKE 27, CARTER LAKE 71, BIG THOMPSON R AT MOUTH, NR DRAKE, CO 107, LAKE GRANBY 351, CHAMBERS LAKE 2, BLACK HOLLOW RESERVOIR 3, HALLIGAN RESERVOIR 6, CACHE LA POUDRE 6, Cache La Poudre FOSSIL CREEK RESERVOIR 9, WINDSOR RESERVOIR 11, COBB LAKE 17, HORSETOOTH RESERVOIR 114, CACHE LA POUDRE R AT CANYON MOUTH 265,
8 HUC ID HUC Name Component Name Middle South Platte- Sterling Component Volume (AF) Component NEP for Month JULESBURG RESERVOIR 12,700 1 BEAR CREEK ABV EVERGREEN 17, EMPIRE RESERVOIR 23, JACKSON LAKE RESERVOIR 24, PREWITT RESERVOIR 24, SOUTH BOULDER CK NR ELDORADO SPRINGS, CO 44, RIVERSIDE RESERVOIR 45, POINT OF ROCKS RESERVOIR 50, BOULDER CREEK NEAR ORODELL 62, BIG THOMPSON R AT MOUTH, NR DRAKE, CO 107, SAINT VRAIN CREEK AT LYONS 109, CLEAR CREEK AT GOLDEN 126, SOUTH PLATTE RIVER AT SOUTH PLATTE 198, CACHE LA POUDRE R AT CANYON MOUTH 265, North Platte Headwaters NORTH PLATTE R NR NORTHGATE 305, YAMCOLO RESERVOIR 6, STAGECOACH RESERVOIR NR OAK CREEK 34, Upper Yampa ELKHEAD CREEK ABOVE LONG GULCH 86, YAMPA RIVER AT STEAMBOAT SPRINGS 310, ELK RIVER NEAR MILNER, CO 385, Lower Yampa YAMPA RIVER NEAR MAYBELL 1,110, Little Snake LITTLE SNAKE RIVER NEAR LILY 435, Upper White WHITE RIVER NEAR MEEKER 310, NEP is non exceedance percentage (percentile) for volume of the component compared to this month during the historical period *Empty, filling restriction Water Volume NEP Color Scale: 0 (Well Below Normal) 50 (Normal) 100 (Well Above Normal) 8
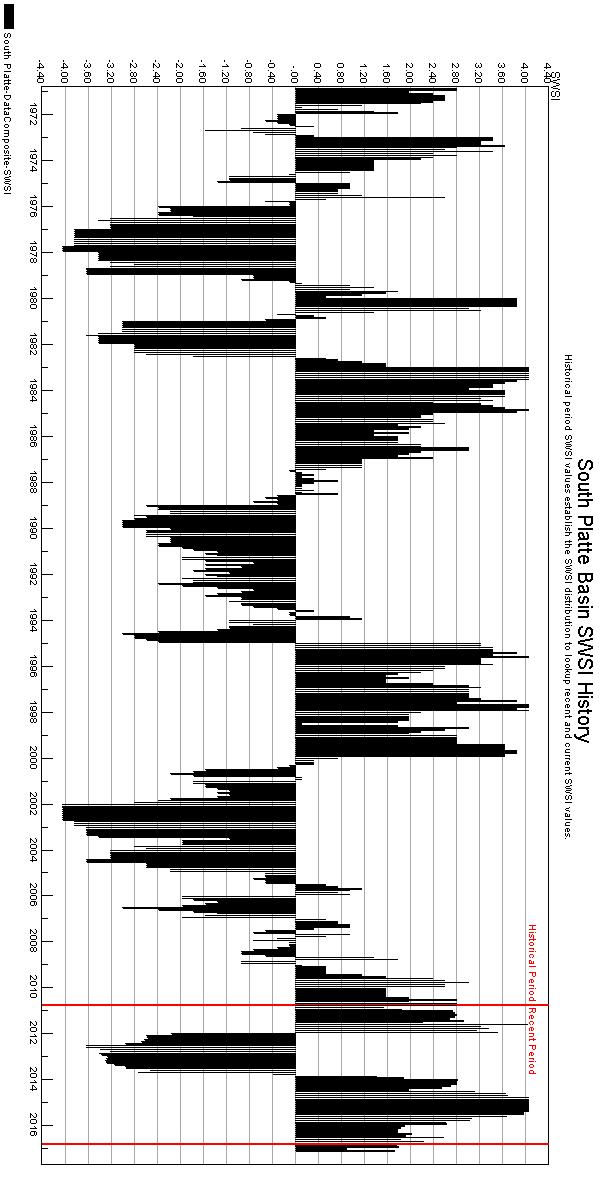
9 Usable Storage, acre-feet CUMULATIVE FLOW, Acre-Feet SOUTH PLATTE BASIN Feb-17 Basinwide Conditions Assessment The SWSI value for the month was All in all, January 2017 was a fairly typical January over the lower elevations of northeast Colorado. Temperatures over the area were almost universally a bit colder than the monthly average, due in large part to an extended cold snap during the middle of the month. There was a marked precipitation divide within northeast Colorado in January. Precipitation at the lower elevations was near normal while at the higher elevations it was way above normal, especially in the first ½ of the month. The snow water equivalent (SWE) at the higher elevations increased from 105% of normal on January to 140% of normal on February 1. In fact, the February 1 SWE is high enough that only about 50% of normal snowfall is need for the rest of the season to reach the average season SWE of about 15 inches. Similar to December, despite the much more normal precipitation and the increase in snowpack, the USDA Drought Monitor indicated only a slight improvement in drought conditions in northeast Colorado. The slight improvement is represented by the late January removal of the area of Severe Drought (D2) rating that persisted for almost 2 months over much of Larimer County. In an indication of the status quo, the areas in the D1 Moderate Drought and the D0 Abnormally Dry categories remained pretty much unchanged from the end of December to the end of January. January flows in the South Platte River at the Julesburg and Kersey index gages were above the long term average. The overall January mean flow at the Julesburg gage was about 994 cfs or approximately 194% of the period of record mean flow of 512 cfs. The overall December mean flow at the Kersey gage was approximately 703 cfs. This represents a flow of approximately 108% of the period of record mean flow of 652cfs. 3,000,000 2,500,000 2,000,000 1,500,000 SOUTH PLATTE RIVER NR. KERSEY, FLOW BY WATER YEAR The calls on the South Platte mainstem were generally typical for January. There were free river conditions on the mainstem below the Denver metro area for most of the month. The major South Platte tributaries were internally controlled for the month with calls also generally typical for January. 1,000, ,000 0 Oct Nov Dec Jan Feb March April May June July Aug Sept WET (1983) DRY (1964) AVG 2017 Overall storage in the South Platte remained good in January. The end of January 2017 storage was at 74% of capacity, as compared to the long term average end of January storage of 70% of capacity. 250, ,000 REPRESENTATIVE RESERVOIRS 150, ,000 50,000 0 Dillon Horsetooth Eleven Mile Cheesman Jackson Barr Lake Avg. 1/31 Contents 1/31/17 Contents 9
10 10
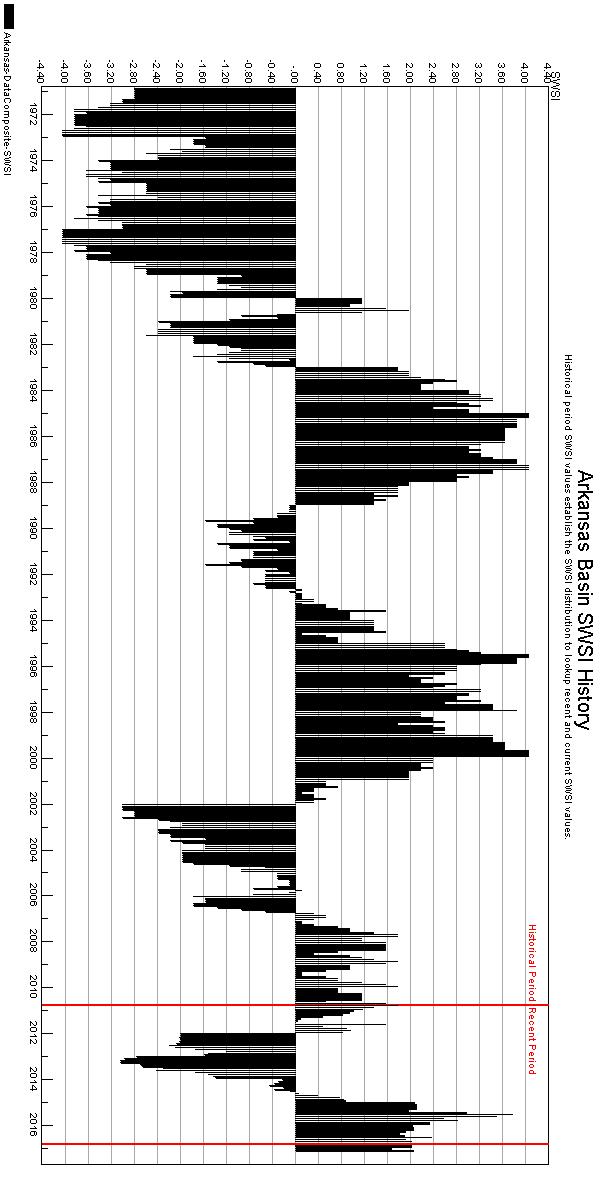
11 Usable Storage, acre-feet CUMULATIVE FLOW, Acre-Feet ARKANSAS BASIN Feb-17 Basinwide Conditions Assessment The SWSI value for the month was Outlook Reservoir storage in the Pueblo Winter Water Program totaled 92,058 acre-feet as of the end of January. This storage amount is less than last year s storage to date of 105,593 acre-feet, but represents 103% of the last twenty year average. Conservation storage in John Martin Reservoir has accumulated 17,530 acre-feet versus 22,655 acre-feet as of the end of January last year. Administrative/Management Concerns Although not as strong a threat as in 2015, due to a good winter storage period and a vastly improved snowpack level in both the Arkansas River Basin and the portion of the Colorado River ARKANSAS RIVER NR. PORTLAND, FLOW BY WATER YEAR Basin associated with the Fryingpan-Arkansas 1,200,000 Project, there is some concern about a spill of account water from Pueblo Reservoir. The 1,000,000 Southeastern Colorado Water Conservancy District and Bureau of Reclamation have been 800,000 evaluating changing conditions to figure out how best to manage upper reservoir and Pueblo 600,000 Reservoir storage to maximize storage of project water. To make room for 2017 west slope 400,000 imports, water will continue to be moved 200,000 downstream from Turquoise and Twin Lakes 0 Reservoirs to Pueblo Reservoir. That additional Oct storage may place temporary storage accounts Nov Dec Jan Feb March April May June July Aug Sept owned by some municipal interests, well WET (1984) DRY (2002) AVG 2017 associations and the Upper Arkansas Water Conservancy District and Lower Arkansas Valley REPRESENTATIVE RESERVOIRS Water Conservancy District, at some risk of spill 250,000 again by April , , ,000 50,000 0 John Martin Pueblo Turquoise Twin Lakes Avg.1/31 Contents 1/31/17 Contents 11
12 12
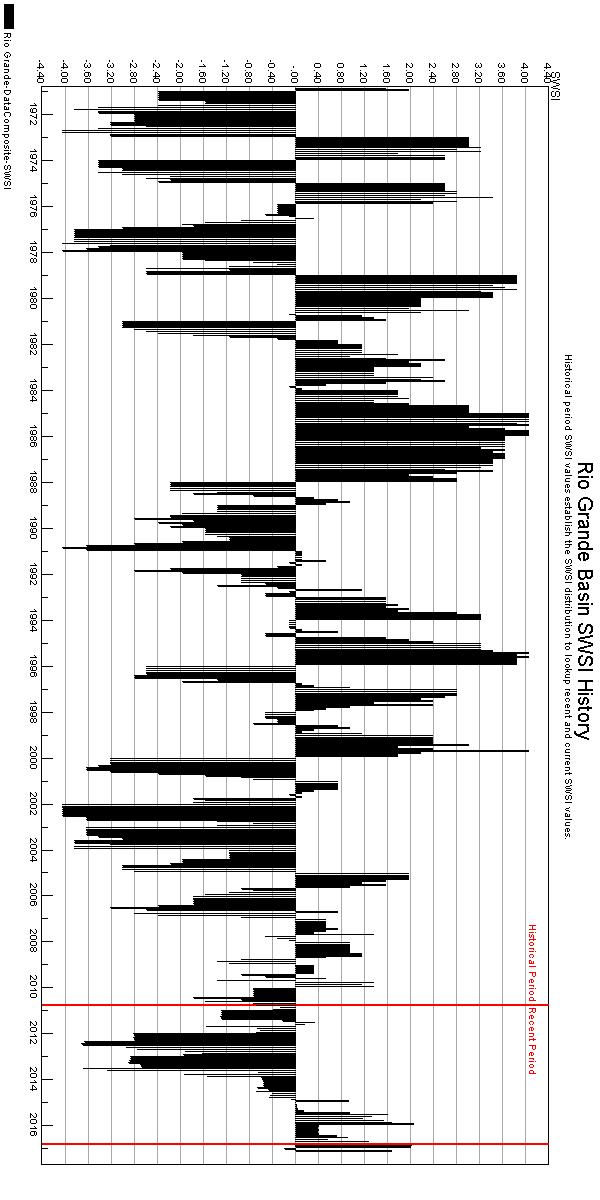
13 Usable Storage, acre-feet CUMULATIVE FLOW, Acre-Feet RIO GRANDE BASIN Feb-17 Basinwide Conditions Assessment The SWSI value for the month was Flow at the gaging station Rio Grande near Del Norte averaged 194 cfs (112% of normal). The Conejos River near Mogote had a mean flow of 64 cfs (129% of normal). Inflow to the basin s reservoirs is above normal this winter. There was abundant snowfall in the San Juans and Sangre de Cristos during late December and all of January. This was a remarkable recovery from a poor start in November. January was a month of extremes in the San Luis Valley! The minimum temperature dropped to -36 on the 7th but warmed to the mid 40 s just two days later. Deep snow fell over the Valley during the month. An all-time record January snowfall for Alamosa and a top ten snowiest month in recorded history. Very much unexpected for a typically dry month. A deep layer of snow on the ground usually produces extreme cold, but snow fronts pushing through the region kept warm air ahead of each storm. Outlook The Natural Resources Conservation Service stream flow forecasts are predicting runoff in area streams to be in the range of 112% (the Rio Grande at Wagon Wheel Gap) to 184% (Sangre de Cristo Creek) of average during the 2017 irrigation season. It appears the Sangre de Cristo Mountains on the eastern side of the San Luis Valley and the south San Juan Mountains west of Antonito are in great snowpack condition. This is rare. The last time these areas had such an extraordinary start to the snowpack was 2008 a year that, unfortunately, disappointed in March and April. Not all the good news is confined to those areas, all sub-basins in the upper Rio Grande region are expected to produce above average runoff in Average snowfall from now until May should result in the best overall runoff in the upper Rio Grande basin since Current National Weather Service forecasts for February through April, 2017 are calling for above normal temperatures and near normal precipitation in this area of the state. Administrative/Management Concerns Much effort was spent during January finalizing streamflow and diversion records. The annual meetings of local districts and ditch boards are held this time of year to reflect back on the 2016 season and plan for the upcoming irrigation season. 1,200,000 1,000, , ,000 RIO GRANDE NR. DEL NORTE, FLOW BY WATER YEAR 400, ,000 0 Oct Nov Dec Jan Feb March April May June July Aug Sept WET (1987) DRY (2002) AVG ,000 REPRESENTATIVE RESERVOIRS 25,000 20,000 15,000 10,000 5,000 0 Rio Grande Platoro Santa Maria Avg. 1/31 Contents 1/31/17 Contents 13
14 14
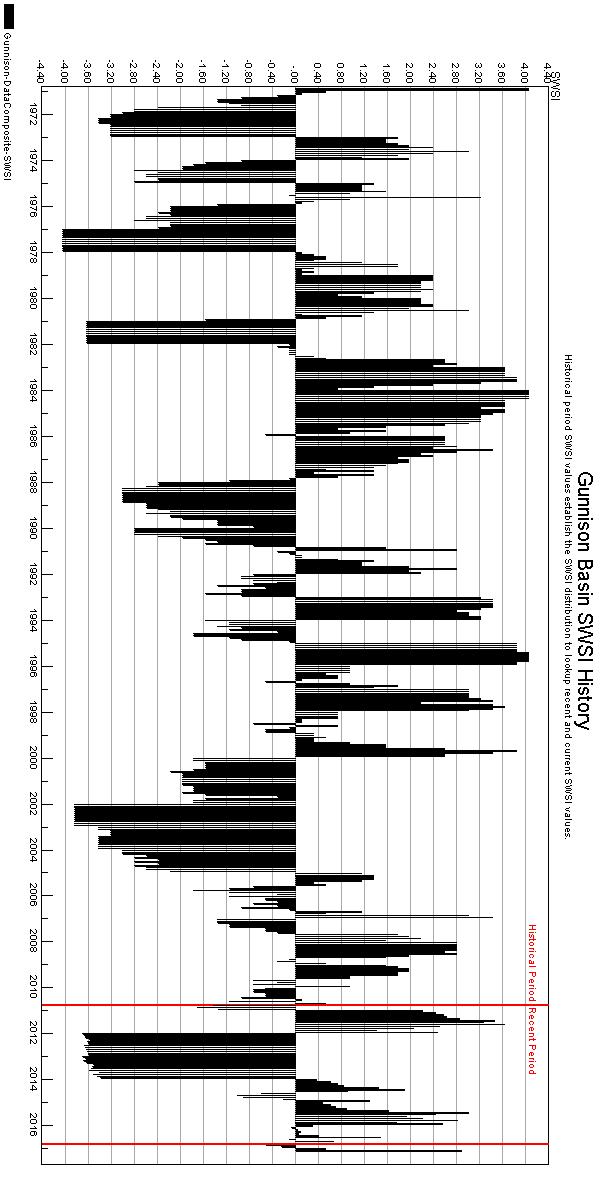
15 Usable Storage, acre-feet CUMULATIVE FLOW, Acre-Feet GUNNISON BASIN Feb-17 Basinwide Conditions Assessment The SWSI value for the month was Following a tremendous December, January precipitation was even more impressive as a series of Pacific storms continued to deliver high levels of moisture into the Colorado Rockies. Based on precipitation tracking by the Colorado Basin River Forecast Center, the Gunnison River Basin received between 200 to 300 percent of the 30-year average precipitation. The upper East River basin and Taylor River basins received approximately 300% of the average precipitation for the month. Temperatures across the basin during January were right around average for the month. The storm activity in January increased the Gunnison Basin snowpack from 118% to 178% of the 30 year median snowpack for this time of the year. As an illustration of the how much impact the January storms have made to the water supply forecast, the Snotel station on Schofield Pass added a whopping 18 inches of snow water equivalent (SWE) during the month. That is an all time record for January as far as records have been maintained. Outlook The NWS precipitation forecast for February through April remains uncertain with equal chances of below or above average precipitation forecast. This is due to the weak La Nina that has developed and its lack of a definitive effect on Gunnison basin precipitation in the past. Above average temperatures are expected for that same period. Administrative/Management Concerns The latest forecast for runoff into Blue Mesa Reservoir this spring is currently predicted to be 925,000 acre-feet, which is classified as a moderately wet year for Aspinall Unit spring storage management operations. If the forecast holds for the remainder of the winter and early spring, there will be a release of water from the Apsinall Unit to create a flow regime in the lower Gunnison River of 40 days at 8,070 cfs and 10 days at 14,350 cfs as measured at the stream flow gauge in the UNCOMPAHGRE RIVER NR. RIDGWAY, FLOW BY WATER YEAR lower Gunnison River at Whitewater. This spring time runoff 250,000 flow regime is part of the Upper Colorado Endangered Fish Recovery Program designed to assist in the recovery of four endangered native species in the upper Colorado River system. As of January 31st, Taylor Park Reservoir contained 69,511 acre-feet in storage, of which, 54,647 acre-feet is stored under it s first fill right and 14,875 acre-feet is stored under it s second fill right. The remainder of the 106,230 acre-feet in the Taylor Park Reservoir first fill account has been moved to storage in the Aspinall Unit pursuant to a 1975 exchange agreement and the decree in 86CW0203. Releases from the Apsinall Unit have been increased from 600 cfs to 1,200 cfs to make room for the spring runoff season. These releases are also used for hydroelectric power generation to meet peak power demands on the electrical grid in the western United States. Public Use Impacts Skiing conditions continue to improve at Crested Butte as well as Telluride with 279-inches of snow received at Crested Butte this season and 217-inches total at Telluride, with all lifts open. 200, , ,000 50,000 80,000 70,000 0 Oct Nov Dec Jan Feb March April May June July Aug Sept WET (1984) DRY (1977) AVG 2017 REPRESENTATIVE RESERVOIRS 60,000 50,000 40,000 30,000 20,000 10,000 0 Taylor Park Crawford Fruitland Avg 1/31 Contents 1/31/17 Contents 15
16 16
17 Usable Storage, acre-feet CUMULATIVE FLOW, Acre-Feet COLORADO BASIN Feb-17 Basinwide Conditions Assessment The SWSI value for the month was Outlook Colorado River flows are running above average with tributary flows running slightly above average throughout February. As of February 13, the Upper Colorado River Basin snowpack was 144 percent of median snow water equivalent and 133 percent of average precipitation. Forecasts call for above average precipitation and average to above average temperatures for western Colorado through February. Administrative/Management Concerns The call on the Colorado River main stem remains the Shoshone Hydro Power right for 1,250 cfs. Accordingly, Green Mountain Reservoir is releasing to pass inflows, provide contract and HUP obligations and make C-BT replacements. Wolford Reservoir is bypassing inflows and releasing for contracts. Inflows and therefore outflows have generally been increasing in most reservoirs with the increased precipitation. Public Use Impacts NASA measures dust on snow to help manage Colorado River basin water supplies. Trillions of gallons of water is stored in the form of snow on the mountains of Colorado and Utah that deliver water to 33 million people in seven western states. The Colorado Basin River Forecast Center is collaborating with NASA to help improve streamflow forecasts by observing the snow and dust on snow from space. Fresh white snow can reflect up to 90 percent of sunlight, but with the dust on the snow, the snowpack melts at a much higher rate. Therefore, monitoring the dust can help forecast the water flow in the Colorado River Basin. COLORADO RIVER NR. DOTSERO, FLOW BY WATER YEAR 3,500,000 3,000,000 2,500,000 2,000,000 1,500,000 1,000, ,000 0 Oct Nov Dec Jan Feb March April May June July Aug Sept WET (1984) DRY (2002) AVG 2017 REPRESENTATIVE RESERVOIRS 80,000 70,000 60,000 50,000 40,000 30,000 20,000 10,000 0 Green Mountain Ruedi Williams Fork Avg. 1/31 Contents 1/31/17 Contents 17
18 18
19 CUMULATIVE FLOW, Acre-feet YAMPA/WHITE BASIN Feb-17 Basinwide Conditions Assessment The SWSI value for the month was January precipitation was well above average in the Yampa, White, and North Platte River basins. Precipitation for the month, as measured at the SNOTEL sites operated by NRCS, was reported at 189% of average for the Yampa, White, and North Platte River basins. Total precipitation for the water year as a percent of average to date in the combined basins at the end of January was 125%. Snowpack for the combined basins as of February 1st, 2017 was at 135% of average. The snow water equivalent (SWE) as of January 31, 2017 was 137% of average for the North Platte River basin and 128% of average for the Yampa River basin and White River basin. NRCS predicts above average spring and summer streamflows in the Yampa, White, and North Platte River basins. The latest runoff forecasts from the NRCS for the April through July period are 136% of average for the North Platte River at Northgate, 119% of average for the Yampa River near Maybell, 126% of average for the Little Snake River near Lily, and 111% of average for the White River near Meeker. Due to low temperatures and consistent snowfall, all Division 6 stream gages were either closed for the winter season or ice/snow-affected as of February 13th, Outlook As of January 31st Fish Creek Reservoir was storing approximately 3,198 AF, 77% of capacity. The capacity of Fish Creek Reservoir is 4,167 AF. Yamcolo Reservoir was storing 6,700 AF at the end of January The capacity of Yamcolo Reservoir is 8,700 AF. On January 31st Elkhead Creek Reservoir was storing 23,347 AF. The capacity of Elkhead Creek Reservoir is 24,778 AF. On January 31, 2017, Stagecoach Reservoir was storing 34,500 AF, 95% of capacity. Water stored in Fish Creek Reservoir is used primarily for municipal purposes, Yamcolo Reservoir for irrigation purposes, and Elkhead Creek Reservoir for municipal, industrial, recreational, and fish recovery releases. Stagecoach Reservoir is primarily used for recreation though a significant amount of stored water is allocated for municipal, industrial, irrigation and augmentation uses. Public Use Impacts January snowfall helped Steamboat Ski Resort to have very good conditions with a 64 inch base and 238 inches of snowfall since early November. Stagecoach Reservoir is completely iced over. Ice thickness as measured by park staff varied from a low of 6 inches to 12 inches plus. Please check website for the fishing report. The park has approximately 8 miles of groomed cross country and snowshoe trails available. Steamboat Lake has not updated lake ice conditions since last month. Please call the park for updated ice conditions on the reservoir. Fishermen around the marina are reporting bigger fish being caught (18-20 inches). Caution is advised. Roads are all closed in the park except for the Marina access , , , , , , ,000 YAMPA RIVER AT STEAMBOAT, FLOW BY WATER YEAR 0 Oct Nov Dec Jan Feb March April May June July Aug Sept WET (1984) DRY (1977) AVG 2017
20 20
21 Usable Storage, acre-feet CUMULATIVE FLOW, Acre-Feet SAN JUAN-DOLORES BASIN Feb-17 Basinwide Conditions Assessment The SWSI value for the month was Flow at the Animas River at Durango was estimated to average 214 cfs (105% of average). The flow at the Dolores River at Dolores was estimated to average 56 cfs (109% of average). The La Plata River at Hesperus averaged 8.0 cfs (115% of average). Precipitation in Durango was 3.86 inches for the month, 193% of the 30-year average of 2.00 inches. Precipitation was the 13th highest amount recorded in January, in Durango, out of 123 years of record. Precipitation to date in Durango, for the water year, is inches, 160% of the 30-year average of 6.77 inches. End of last month precipitation to date, for the water year was 138% of average. The average high and low temperatures for the month of January in Durango were 39 o and 21 o. In comparison, the 30-year average high and low for the month is 40 o and 14 o. At the end of the month Vallecito Reservoir contained 85,218 acre-feet compared to its average content of 56,145 acre-feet (152% of average). McPhee Reservoir was up to 294,514 acre-feet compared to its average content of 258,953 (114% of average), while Lemon Reservoir was up to 20,960 acrefeet as compared to its average content of 19,791 acre-feet (106% of average). Outlook Precipitation (3.86 inches) was well above average for January in Durango. There were only 13 years out of 123 years of record where there was more precipitation than this year. Flows in the rivers within the basin climbed to near average. There were 34 out of 107 years of record where the total flow past the Animas River at Durango stream gauge was more than this year. There were 35 out of 106 years of record where the total flow past the Dolores stream gauge was more than this year and 29 out of 100 years of record where the total flow past the La Plata River at Hesperus gauge was more than this year. 1,000, , , , , , , , , ,000 ANIMAS RIVER NR. DURANGO, FLOW BY WATER YEAR 0 Oct Nov Dec Jan Feb March April May June July Aug Sept WET (1973) DRY (2002) AVG ,000 REPRESENTATIVE RESERVOIRS 350, , , , , ,000 50,000 0 McPhee Vallecito Lemon Avg. 1/31 Contents 1/31/17 Contents 21
22 22
23
24
25
26
27
28
29
30
31
32
33
34
35
36
37
38
39
40
41
42
43
44
45
46
47
48
49
50
51
52
53
54
55
56
57
58
59
60
61
62
63
COLORADO WATER SUPPLY CONDITIONS UPDATE
 COLORADO WATER SUPPLY CONDITIONS UPDATE FROM THE OFFICE OF THE STATE ENGINEER: COLORADO DIVISION OF WATER RESOURCES February 1, 2016 ROOM 818, 1313 SHERMAN ST., DENVER, CO 80203 303-866-3581; www.water.state.co.us
COLORADO WATER SUPPLY CONDITIONS UPDATE
 COLORADO WATER SUPPLY CONDITIONS UPDATE FROM THE OFFICE OF THE STATE ENGINEER: COLORADO DIVISION OF WATER RESOURCES January 215 ROOM 818, 1313 SHERMAN ST., DENVER, CO 823 33-866-3581; www.water.state.co.us
COLORADO WATER SUPPLY CONDITIONS UPDATE
 COLORADO WATER SUPPLY CONDITIONS UPDATE FROM THE OFFICE OF THE STATE ENGINEER: COLORADO DIVISION OF WATER RESOURCES December 211 ROOM 818, 1313 SHERMAN ST., DENVER, CO 823 33-866-3581; www.water.state.co.us
Colorado Water Supply Outlook Report January 1, 2018
 Colorado Water Supply Outlook Report January 1, 2018 A mid-mountain vantage point at Crested Butte Ski area provides a view of the low-snow conditions in the surrounding area. On December 19 th, when this
A Review of the 2007 Water Year in Colorado
 A Review of the 2007 Water Year in Colorado Nolan Doesken Colorado Climate Center, CSU Mike Gillespie Snow Survey Division, USDA, NRCS Presented at the 28 th Annual AGU Hydrology Days, March 26, 2008,
Colorado Water Supply Outlook Report April 1, 2016
 Colorado Water Supply Outlook Report April 1, 216 Kevin Houck and Allison Franz of the Colorado Water Conservation Board measure the Willow Creek Pass snow course. This snow course recorded 129% of normal
PRECIPITATION. Last Week Precipitation:
 12/3/2014 NIDIS Drought and Water Assessment PRECIPITATION The images above use daily precipitation statistics from NWS COOP, CoCoRaHS, and CoAgMet stations. From top to bottom, and left to right: most
The Colorado Drought : 2003: A Growing Concern. Roger Pielke, Sr. Colorado Climate Center.
 The Colorado Drought 2001-2003: 2003: A Growing Concern Roger Pielke, Sr. Colorado Climate Center Prepared by Tara Green and Odie Bliss http://climate.atmos.colostate.edu 2 2002 Drought History in Colorado
PRECIPITATION. Last Week Precipitation:
 2/24/2015 NIDIS Drought and Water Assessment PRECIPITATION The images above use daily precipitation statistics from NWS COOP, CoCoRaHS, and CoAgMet stations. From top to bottom, and left to right: most
NIDIS Intermountain West Drought Early Warning System February 19, 2019
 NIDIS Intermountain West Drought Early Warning System February 19, 2019 Precipitation The images above use daily precipitation statistics from NWS COOP, CoCoRaHS, and CoAgMet stations. From top to bottom,
Webinar and Weekly Summary February 15th, 2011
 Webinar and Weekly Summary February 15th, 2011 -Assessment of current water conditions - Precipitation Forecast - Recommendations for Drought Monitor Upper Colorado Normal Precipitation Upper Colorado
PRECIPITATION. Last Week Precipitation:
 PRECIPITATION The images above use daily precipitation statistics from NWS COOP, CoCoRaHS, and CoAgMet stations. From top to bottom, and left to right: most recent 7-days of accumulated precipitation in
NIDIS Intermountain West Drought Early Warning System February 12, 2019
 NIDIS Intermountain West Drought Early Warning System February 12, 2019 Precipitation The images above use daily precipitation statistics from NWS COOP, CoCoRaHS, and CoAgMet stations. From top to bottom,
NIDIS Intermountain West Regional Drought Early Warning System February 7, 2017
 NIDIS Drought and Water Assessment NIDIS Intermountain West Regional Drought Early Warning System February 7, 2017 Precipitation The images above use daily precipitation statistics from NWS COOP, CoCoRaHS,
NIDIS Intermountain West Drought Early Warning System January 15, 2019
 NIDIS Drought and Water Assessment NIDIS Intermountain West Drought Early Warning System January 15, 2019 Precipitation The images above use daily precipitation statistics from NWS COOP, CoCoRaHS, and
NIDIS Intermountain West Drought Early Warning System December 4, 2018
 12/4/2018 NIDIS Drought and Water Assessment NIDIS Intermountain West Drought Early Warning System December 4, 2018 Precipitation The images above use daily precipitation statistics from NWS COOP, CoCoRaHS,
Oregon Water Conditions Report May 1, 2017
 Oregon Water Conditions Report May 1, 2017 Mountain snowpack in the higher elevations has continued to increase over the last two weeks. Statewide, most low and mid elevation snow has melted so the basin
NIDIS Intermountain West Drought Early Warning System December 11, 2018
 NIDIS Drought and Water Assessment NIDIS Intermountain West Drought Early Warning System December 11, 2018 Precipitation The images above use daily precipitation statistics from NWS COOP, CoCoRaHS, and
NIDIS Intermountain West Drought Early Warning System February 6, 2018
 NIDIS Intermountain West Drought Early Warning System February 6, 2018 Precipitation The images above use daily precipitation statistics from NWS COOP, CoCoRaHS, and CoAgMet stations. From top to bottom,
-Assessment of current water conditions. - Precipitation Forecast. - Recommendations for Drought Monitor
 2 June 12, 2012 -Assessment of current water conditions - Precipitation Forecast - Recommendations for Drought Monitor 7-day average discharge compared to historical discharge for the day
NIDIS Intermountain West Drought Early Warning System April 18, 2017
 1 of 11 4/18/2017 3:42 PM Precipitation NIDIS Intermountain West Drought Early Warning System April 18, 2017 The images above use daily precipitation statistics from NWS COOP, CoCoRaHS, and CoAgMet stations.
Oregon Water Conditions Report April 17, 2017
 Oregon Water Conditions Report April 17, 2017 Mountain snowpack continues to maintain significant levels for mid-april. By late March, statewide snowpack had declined to 118 percent of normal after starting
Precipitation. Standardized Precipitation Index. NIDIS Intermountain West Regional Drought Early Warning System January 3, 2017
 1/3/2017 NIDIS Drought and Water Assessment NIDIS Intermountain West Regional Drought Early Warning System January 3, 2017 Precipitation The images above use daily precipitation statistics from NWS COOP,
Becky Bolinger Water Availability Task Force November 13, 2018
 Colorado Climate Center WATF Climate Update Becky Bolinger Water Availability Task Force November 13, 2018 COLORADO CLIMATE CENTER Water Year 2018 Colorado s Climate in Review COLORADO CLIMATE CENTER
NIDIS Intermountain West Drought Early Warning System May 1, 2018
 NIDIS Intermountain West Drought Early Warning System May 1, 2018 Precipitation The images above use daily precipitation statistics from NWS COOP, CoCoRaHS, and CoAgMet stations. From top to bottom, and
NIDIS Weekly Climate, Water and Drought Assessment Summary. Upper Colorado River Basin July 31, 2012
 NIDIS Weekly Climate, Water and Drought Assessment Summary Upper Colorado River Basin July 31, 2012 Fig. 1: July month-to-date precipitation in inches. Fig. 2: SNOTEL WYTD precipitation percentiles (50%
NIDIS Weekly Climate, Water and Drought Assessment Summary Upper Colorado River Basin Pilot Project 13 July 2010
 NIDIS Weekly Climate, Water and Drought Assessment Summary Upper Colorado River Basin Pilot Project 13 July 2010 Precipitation and Snowpack Over the past week, precipitation in the Upper Colorado River
-Assessment of current water conditions. - Precipitation Forecast. - Recommendations for Drought Monitor
 April 27, 2010 -Assessment of current water conditions - Precipitation Forecast - Recommendations for Drought Monitor 7 Day Precipitation 19-25 April 2010 Month-to-Date Precipitation 1-25 April 2010
Precipitation. Standardized Precipitation Index. NIDIS Intermountain West Regional Drought Early Warning System December 6, 2016
 12/9/2016 NIDIS Drought and Water Assessment NIDIS Intermountain West Regional Drought Early Warning System December 6, 2016 Precipitation The images above use daily precipitation statistics from NWS COOP,
A Review of the 2003 Water Year in Colorado
 Hydrology Days 24 A Review of the 23 Water Year in Colorado Nolan J. Doesken 1 Colorado Climate Center, Atmospheric Science Department, Colorado State University, Fort Collins, Colorado Michael A. Gillespie
PRECIPITATION. Last Week Precipitation:
 PRECIPITATION The images above use daily precipitation statistics from NWS COOP, CoCoRaHS, and CoAgMet stations. From top to bottom, and left to right: most recent 7-days of accumulated precipitation in
NIDIS Intermountain West Drought Early Warning System January 22, 2019
 NIDIS Drought and Water Assessment NIDIS Intermountain West Drought Early Warning System January 22, 2019 Precipitation The images above use daily precipitation statistics from NWS COOP, CoCoRaHS, and
Upper Missouri River Basin February 2018 Calendar Year Runoff Forecast February 6, 2018
 Upper Missouri River Basin February 2018 Calendar Year Runoff Forecast February 6, 2018 Calendar Year Runoff Forecast Explanation and Purpose of Forecast U.S. Army Corps of Engineers, Northwestern Division
NIDIS Intermountain West Drought Early Warning System October 30, 2018
 10/30/2018 NIDIS Drought and Water Assessment NIDIS Intermountain West Drought Early Warning System October 30, 2018 Precipitation The images above use daily precipitation statistics from NWS COOP, CoCoRaHS,
Precipitation. Standardized Precipitation Index. NIDIS Intermountain West Drought Early Warning System September 5, 2017
 9/6/2017 NIDIS Drought and Water Assessment NIDIS Intermountain West Drought Early Warning System September 5, 2017 Precipitation The images above use daily precipitation statistics from NWS COOP, CoCoRaHS,
NIDIS Intermountain West Drought Early Warning System October 17, 2017
 NIDIS Drought and Water Assessment NIDIS Intermountain West Drought Early Warning System October 17, 2017 Precipitation The images above use daily precipitation statistics from NWS COOP, CoCoRaHS, and
-Assessment of current water conditions. - Precipitation Forecast. - Recommendations for Drought Monitor
 2 May 1 st, 2012 -Assessment of current water conditions - Precipitation Forecast - Recommendations for Drought Monitor AHPS Water Year Precipitation as Percentage of Normal 7-day average
 October 16 th, 2012 2010-12 La Niña event reached its biggest peak since the mid-70s in late 2010, followed by a brief excursion to ENSOneutral conditions during mid-2011; it reached a second peak last
NIDIS Intermountain West Drought Early Warning System December 18, 2018
 NIDIS Intermountain West Drought Early Warning System December 18, 2018 Precipitation The images above use daily precipitation statistics from NWS COOP, CoCoRaHS, and CoAgMet stations. From top to bottom,
Upper Missouri River Basin December 2017 Calendar Year Runoff Forecast December 5, 2017
 Upper Missouri River Basin December 2017 Calendar Year Runoff Forecast December 5, 2017 Calendar Year Runoff Forecast Explanation and Purpose of Forecast U.S. Army Corps of Engineers, Northwestern Division
-Assessment of current water conditions. - Precipitation Forecast. - Recommendations for Drought Monitor
 2 May 8 th, 2012 -Assessment of current water conditions - Precipitation Forecast - Recommendations for Drought Monitor AHPS Analysis 5/7/12 7-day average discharge compared to historical
PRECIPITATION. Last Week Precipitation:
 12/30/2014 NIDIS Drought and Water Assessment PRECIPITATION The images above use daily precipitation statistics from NWS COOP, CoCoRaHS, and CoAgMet stations. From top to bottom, and left to right: most
Upper Missouri River Basin January 2018 Calendar Year Runoff Forecast January 3, 2018
 Calendar Year Runoff Forecast Upper Missouri River Basin January 2018 Calendar Year Runoff Forecast January 3, 2018 Explanation and Purpose of Forecast U.S. Army Corps of Engineers, Northwestern Division
NIDIS Drought and Water Assessment
 NIDIS Drought and Water Assessment PRECIPITATION The images above use daily precipitation statistics from NWS COOP, CoCoRaHS, and CoAgMet stations. From top to bottom, and left to right: most recent 7-days
Colorado CoCoRaHS. Colorado CoCoRaHS. Because Every Drop Counts! November 2014 Volume 2, Issue 11
 U.S. PRECIPITATION (% OF AVERAGE) LOOKING BACK AT OCTOBER 2014 October was a fairly dry month for much of the nation with the exception of the Pacific Northwest, portions of New England and the Tennessee
NIDIS Drought and Water Assessment
 7/23/13 1:57 PM PRECIPITATION The images above use daily precipitation statistics from NWS COOP, CoCoRaHS, and CoAgMet stations. From top to bottom, and left to right: most recent 7-days of accumulated
Chapter 4 Population Change in Colorado s River Basins: A Brief History from 1950 to 2000 and Forecasts from 2000 to 2030
 Jim Westkott 1 1Department of Local Affairs, State of Colorado Abstract This chapter will summarize and present data on population change in Colorado from to and on expected change from to by river basin.
NIDIS Intermountain West Drought Early Warning System November 14, 2017
 NIDIS Intermountain West Drought Early Warning System November 14, 2017 Precipitation The images above use daily precipitation statistics from NWS COOP, CoCoRaHS, and CoAgMet stations. From top to bottom,
DK DM M EMORANDUM D ECEMBER 28, 2018 SUBJECT:
 TO: CC: FROM: SUBJECT: BOARD OF DIRECTORS M EMORANDUM D ECEMBER 28, 2018 ANDY MUELLER, GENERAL MANAGER DAVE DK KANZER, P.E. & DON MEYER, P.E. DK DM COLORADO RIVER BASIN WATER SUPPLY CONDITIONS UPDATE AND
NIDIS Intermountain West Drought Early Warning System March 26, 2019
 NIDIS Intermountain West Drought Early Warning System March 26, 2019 The images above use daily precipitation statistics from NWS COOP, CoCoRaHS, and CoAgMet stations. From top to bottom, and left to right:
-Assessment of current water conditions. - Precipitation Forecast. - Recommendations for Drought Monitor
 May 31 st, 2011 -Assessment of current water conditions - Precipitation Forecast - Recommendations for Drought Monitor Upper Colorado River Basin Snow Snowpack % of average to date: 347% Percent
FEMA Hazards Loss Modeling Task Force (MOTF) Situation Report #14. Colorado Spring Flood Risk ***FINAL REPORT***
 Situation Report #14. Colorado Spring Flood Risk ***FINAL REPORT***") FEMA Hazards Loss Modeling Task Force (MOTF) Situation Report #14 Colorado Spring Flood Risk FEMA Modeling Task Force (MOTF) Denver Federal Center, Building 710A Denver, Colorado 80225 Email: FEMA-MOTF@fema.dhs.gov
FEMA Hazards Loss Modeling Task Force (MOTF) Situation Report #14 Colorado Spring Flood Risk FEMA Modeling Task Force (MOTF) Denver Federal Center, Building 710A Denver, Colorado 80225 Email: FEMA-MOTF@fema.dhs.gov
Colorado CoCoRaHS. Colorado CoCoRaHS. December 2013 Volume 1, Issue 8 NOVEMBER PRECIPITATION NOVEMBER TEMPERATURES
 NOVEMBER PRECIPITATION The month of November brought a flip-flop in precipitation patterns to some areas compared to the previous month, especially for locations in the foothills north of I-70 and in south-central
PRECIPITATION. Last Week Precipitation:
 1/28/2015 NIDIS Drought and Water Assessment PRECIPITATION The images above use daily precipitation statistics from NWS COOP, CoCoRaHS, and CoAgMet stations. From top to bottom, and left to right: most
NIDIS Weekly Climate, Water and Drought Assessment Summary. Upper Colorado River Basin June 28, 2011
 NIDIS Weekly Climate, Water and Drought Assessment Summary Upper Colorado River Basin June 28, 2011 PrecipitaFon and Snowpack Fig. 1: June month to date precipitafon in inches. Fig. 2: June 19 25 precipitafon
Drought and Future Water for Southern New Mexico
 Drought and Future Water for Southern New Mexico David S. Gutzler University of New Mexico gutzler@unm.edu * The big drought of 2018 * Longer term challenges for water supply * Forecasting streamflow Elephant
NIDIS Intermountain West Drought Early Warning System November 21, 2017
 NIDIS Drought and Water Assessment NIDIS Intermountain West Drought Early Warning System November 21, 2017 Precipitation The images above use daily precipitation statistics from NWS COOP, CoCoRaHS, and
San Francisco Public Utilities Commission Hydrological Conditions Report For March 2016
 San Francisco Public Utilities Commission Hydrological Conditions Report For March 2016 J. Chester, C. Graham, A. Mazurkiewicz, & M. Tsang, April 7, 2016 Snow Surveyor Chris Graham crossing Huckleberry
NIDIS Weekly Climate, Water and Drought Assessment Summary. Upper Colorado River Basin
 NIDIS Weekly Climate, Water and Drought Assessment Summary Upper Colorado River Basin August 3, 2010 Precipitation and Snowpack Fig. 1: July precipitation in inches Fig. 2: July precip as percent of average
Colorado s 2003 Moisture Outlook
 Colorado s 2003 Moisture Outlook Nolan Doesken and Roger Pielke, Sr. Colorado Climate Center Prepared by Tara Green and Odie Bliss http://climate.atmos.colostate.edu How we got into this drought! Fort
PERCENT BIAS ASSESSMENT OF WATER-SUPPLY OUTLOOKS IN THE COLORADO RIVER BASIN. Brent Harrison 1 and Roger Bales 2 ABSTRACT INTRODUCTION
 PERCENT BIAS ASSESSMENT OF WATER-SUPPLY OUTLOOKS IN THE COLORADO RIVER BASIN Brent Harrison 1 and Roger Bales 2 ABSTRACT Water-supply forecasts on various watersheds are intended to predict the April through
Highlights of the 2006 Water Year in Colorado
 Highlights of the 2006 Water Year in Colorado Nolan Doesken, State Climatologist Atmospheric Science Department Colorado State University http://ccc.atmos.colostate.edu Presented to 61 st Annual Meeting
NIDIS Weekly Climate, Water and Drought Assessment Summary. Upper Colorado River Basin May 31, 2011
 NIDIS Weekly Climate, Water and Drought Assessment Summary Upper Colorado River Basin May 31, 2011 PrecipitaFon and Snowpack Fig. 1: May month to date precipitafon in inches. Fig. 2: May 22 28 precipitafon
Illinois Drought Update, December 1, 2005 DROUGHT RESPONSE TASK FORCE Illinois State Water Survey, Department of Natural Resources
 Illinois Drought Update, December 1, 2005 DROUGHT RESPONSE TASK FORCE Illinois State Water Survey, Department of Natural Resources For more drought information please go to http://www.sws.uiuc.edu/. SUMMARY.
January 2011 Calendar Year Runoff Forecast
 January 2011 Calendar Year Runoff Forecast 2010 Runoff Year Calendar Year 2010 was the third highest year of runoff in the Missouri River Basin above Sioux City with 38.8 MAF, behind 1978 and 1997 which
Colorado weather and climate update: a bit more than halfway through the water year (Or: What s going on with the weather?? )
") Colorado weather and climate update: a bit more than halfway through the water year (Or: What s going on with the weather?? ) Russ S. Schumacher Colorado State Climatologist Director, Colorado Climate
Colorado weather and climate update: a bit more than halfway through the water year (Or: What s going on with the weather?? ) Russ S. Schumacher Colorado State Climatologist Director, Colorado Climate
NIDIS Intermountain West Drought Early Warning System November 13, 2018
 NIDIS Intermountain West Drought Early Warning System November 13, 2018 Precipitation The images above use daily precipitation statistics from NWS COOP, CoCoRaHS, and CoAgMet stations. From top to bottom,
Upper Missouri River Basin May 2018 Calendar Year Runoff Forecast May 4, 2018
 Calendar Year Runoff Forecast Explanation and Purpose of Forecast Upper Missouri River Basin May 2018 Calendar Year Runoff Forecast May 4, 2018 U.S. Army Corps of Engineers, Northwestern Division Missouri
-Assessment of current water conditions. - Precipitation Forecast. - Recommendations for Drought Monitor
 April 20 th, 2010 -Assessment of current water conditions - Precipitation Forecast - Recommendations for Drought Monitor 7 Day Precipitation 12-18 April 2010 Month-to-Date Precipitation 1-28 March 2010
NIDIS Intermountain West Drought Early Warning System April 16, 2019
 NIDIS Intermountain West Drought Early Warning System April 16, 2019 Precipitation The images above use daily precipitation statistics from NWS COOP, CoCoRaHS, and CoAgMet stations. From top to bottom,
PRECIPITATION. Last Week Precipitation:
 3/30/2016 NIDIS Drought and Water Assessment PRECIPITATION The images above use daily precipitation statistics from NWS COOP, CoCoRaHS, and CoAgMet stations. From top to bottom, and left to right: most
-Assessment of current water conditions. - Precipitation Forecast. - Recommendations for Drought Monitor
 2 June 26 th, 2012 -Assessment of current water conditions - Precipitation Forecast - Recommendations for Drought Monitor CMPDSI Value Percentile Rank Characteristic -1.0 - -1.9 21-30 Abnormally
NIDIS Intermountain West Drought Early Warning System January 16, 2018
 NIDIS Drought and Water Assessment NIDIS Intermountain West Drought Early Warning System January 16, 2018 Precipitation The images above use daily precipitation statistics from NWS COOP, CoCoRaHS, and
-Assessment of current water conditions. - Precipitation Forecast. - Recommendations for Drought Monitor
 June 1, 2010 -Assessment of current water conditions - Precipitation Forecast - Recommendations for Drought Monitor Snotel WYTD Precipitation as Percentage of Average Upper Colorado Headwaters 88% of
Souris River Basin Spring Runoff Outlook As of March 1, 2019
 Souris River Basin Spring Runoff Outlook As of March 1, 2019 Prepared by: Flow Forecasting & Operations Planning Water Security Agency Basin Conditions Summer rainfall in 2018 over the Saskatchewan portion
Long-term Precipitation Trends in Colorado. Nolan Doesken Colorado State Climatologist Presented: Friday, December 12, 2008
 Long-term Precipitation Trends in Colorado Nolan Doesken Colorado State Climatologist Presented: Friday, December 12, 28 Colorado Mean Annual Precipitation (1971-2) Of All Our Climate Observing Stations
January 25, Summary
 January 25, 2013 Summary Precipitation since the December 17, 2012, Drought Update has been slightly below average in parts of central and northern Illinois and above average in southern Illinois. Soil
2003 Moisture Outlook
 2003 Moisture Outlook Nolan Doesken and Roger Pielke, Sr. Colorado Climate Center Prepared by Tara Green and Odie Bliss http://climate.atmos.colostate.edu Through 1999 Through 1999 Fort Collins Total Water
Wind River Indian Reservation and Surrounding Area Climate and Drought Summary
 Northern Arapaho Tribe Wind River Indian Reservation and Surrounding Area Climate and Drought Summary Spring Events & Summer Outlook 2016 Wet Spring Leads To Flooding Spring was very wet across most of
PRECIPITATION. Last Week Precipitation:
 12/1/2015 NIDIS Drought and Water Assessment PRECIPITATION The images above use daily precipitation statistics from NWS COOP, CoCoRaHS, and CoAgMet stations. From top to bottom, and left to right: most
The Colorado Drought of 2002 in Perspective
 The Colorado Drought of 2002 in Perspective Colorado Climate Center Nolan Doesken and Roger Pielke, Sr. Prepared by Tara Green and Odie Bliss http://climate.atmos.colostate.edu Known Characteristics of
NIDIS Intermountain West Drought Early Warning System September 4, 2018
 NIDIS Drought and Water Assessment NIDIS Intermountain West Drought Early Warning System September 4, 2018 Precipitation The images above use daily precipitation statistics from NWS COOP, CoCoRaHS, and
The following information is provided for your use in describing climate and water supply conditions in the West as of April 1, 2003.
 Natural Resources Conservation Service National Water and Climate Center 101 SW Main Street, Suite 1600 Portland, OR 97204-3224 Date: April 8, 2003 Subject: April 1, 2003 Western Snowpack Conditions and
Monthly Long Range Weather Commentary Issued: APRIL 18, 2017 Steven A. Root, CCM, Chief Analytics Officer, Sr. VP,
 Monthly Long Range Weather Commentary Issued: APRIL 18, 2017 Steven A. Root, CCM, Chief Analytics Officer, Sr. VP, sroot@weatherbank.com MARCH 2017 Climate Highlights The Month in Review The average contiguous
Wind River Indian Reservation and Surrounding Area Climate and Drought Summary
 Northern Arapaho Tribe Wind River Indian Reservation and Surrounding Area Climate and Drought Summary Spring Events & Summer Outlook 2015 Spring Was Warm And Very Wet Across The Region The spring season
INVISIBLE WATER COSTS
 Every Drop Every Counts... Drop Counts... INVISIBLE WATER COSTS Corn - 108.1 gallons per pound How much water it takes to produce... Apple - 18.5 gallons to grow Beef - 1,581 gallons per pound Oats - 122.7
NIDIS Intermountain West Drought Early Warning System December 30, 2018
 1/2/2019 NIDIS Drought and Water Assessment NIDIS Intermountain West Drought Early Warning System December 30, 2018 Precipitation The images above use daily precipitation statistics from NWS COOP, CoCoRaHS,
NIDIS Weekly Climate, Water and Drought Assessment Summary. Upper Colorado River Basin February 28, 2012
 NIDIS Weekly Climate, Water and Drought Assessment Summary Upper Colorado River Basin February 28, 2012 PrecipitaGon and Snowpack Fig. 1: February month- to- date precipitagon in inches. Fig. 2: February
Modeling of peak inflow dates for a snowmelt dominated basin Evan Heisman. CVEN 6833: Advanced Data Analysis Fall 2012 Prof. Balaji Rajagopalan
 Modeling of peak inflow dates for a snowmelt dominated basin Evan Heisman CVEN 6833: Advanced Data Analysis Fall 2012 Prof. Balaji Rajagopalan The Dworshak reservoir, a project operated by the Army Corps
SEPTEMBER 2013 REVIEW
 Monthly Long Range Weather Commentary Issued: October 21, 2013 Steven A. Root, CCM, President/CEO sroot@weatherbank.com SEPTEMBER 2013 REVIEW Climate Highlights The Month in Review The average temperature
PRECIPITATION. Last Week Precipitation:
 9/9/2015 NIDIS Drought and Water Assessment PRECIPITATION The images above use daily precipitation statistics from NWS COOP, CoCoRaHS, and CoAgMet stations. From top to bottom, and left to right: most
Wind River Indian Reservation and Surrounding Area Climate and Drought Summary
 Northern Arapaho Tribe Wind River Indian Reservation and Surrounding Area Climate and Drought Summary Winter Events & Spring Outlook 2015-2016 Winter Was Warm And Dry Winter was warm and dry for the Wind
May 2016 Volume 23 Number 5
 The Weather Wire May 2016 Volume 23 Number 5 Contents: Winter Summary Current Colorado and West-wide Snow Pack Drought Monitor April Summary/Statistics May Preview Snowfall Totals Winter Summary The Front
Midwest and Great Plains Drought and Climate Summary 20 February 2014
 Midwest and Great Plains Drought and Climate Summary 20 February 2014 Wendy Ryan Assistant State Climatologist Colorado Climate Center Colorado State University wendy.ryan@colostate.edu 970-491-8506 General
NIDIS Intermountain West Drought Early Warning System May 23, 2017
 NIDIS Drought and Water Assessment NIDIS Intermountain West Drought Early Warning System May 23, 2017 Precipitation The images above use daily precipitation statistics from NWS COOP, CoCoRaHS, and CoAgMet
The Weather Wire. Current Colorado Snowpack. Contents:
 The Weather Wire December 2018 Volume 25 Number 12 Contents: Current Colorado Snowpack Drought Monitor November Summary/Statistics December Preview Snowfall Totals Current Colorado Snowpack Although snowfall
2015 Fall Conditions Report
 2015 Fall Conditions Report Prepared by: Hydrologic Forecast Centre Date: December 21 st, 2015 Table of Contents Table of Figures... ii EXECUTIVE SUMMARY... 1 BACKGROUND... 2 SUMMER AND FALL PRECIPITATION...
Let s Talk Climate! Nolan Doesken Colorado Climate Center Colorado State University. Yampatika Seminar February 16, 2011 Steamboat Springs, Colorado
 Let s Talk Climate! Nolan Doesken Colorado Climate Center Colorado State University Yampatika Seminar February 16, 2011 Steamboat Springs, Colorado First -- A short background In 1973 the federal government
Flood Risk Assessment
 Flood Risk Assessment February 14, 2008 Larry Schick Army Corps of Engineers Seattle District Meteorologist General Assessment As promised, La Nina caused an active winter with above to much above normal
NIDIS Weekly Climate, Water and Drought Assessment Summary. Upper Colorado River Basin February 12, 2013
 NIDIS Weekly Climate, Water and Drought Assessment Summary Upper Colorado River Basin February 12, 2013 Fig. 1: January precipitagon as a percent of average. Fig. 2: February 1 9 precipitagon in inches.