Disentangling Impacts of Climate & Land Use Changes on the Quantity & Quality of River Flows in Southern Ontario
|
|
|
- Daniel Short
- 5 years ago
- Views:
Transcription

1 Disentangling Impacts of Climate & Land Use Changes on the Quantity & Quality of River Flows in Southern Ontario by Trevor Dickinson & Ramesh Rudra, Water Resources Engineering University of Guelph
2 Acknowledgements Agencies NSERC, OMAF & Environment Canada Personnel Barry Smith - Retired Program Manager, Water Survey of Canada Golmar Golmohammadi Post Doctoral Research Fellow Arezoo Amili Former Graduate Student Akul Bhatt Undergraduate Student Assistant
3 River Flows Have Changed
4 Flow Average Monthly Flow Hydrographs Dec Jan Feb Mar Apr May Jun Jul Aug Sep Oct Nov Winter Spring Summer Fall For Rural Watersheds like the Moira River at Foxboro: winter flows have increased, spring flows have decreased, & summer flows have remained unchanged.
5 Flow Average Monthly Flow Hydrographs Dec Jan Feb Mar Apr May Jun Jul Aug Sep Oct Nov Winter Spring Summer Fall For a highly Urbanized Watershed like the Don River at Todmorden: winter flows have increased, spring flows have decreased, & summer flows have greatly increased.
6 Monthly & Annual Precipitation has remained unchanged.
7 Average Annual Precipitation (mm) Nith at New Hamburg Grand at Brantford Cedar Creek at Woodstock Moira near Foxboro Linear (Nith at New Hamburg) Linear (Grand at Brantford) Linear (Cedar Creek at Woodstock) Linear (Cedar Creek at Woodstock) Linear (Moira near Foxboro)
8 What s Going On?! Possible causes of changes in the river flows include: - Changes in Climate, and/or - Changes in Land Use i.e. Urban Development
9 How Has Our Climate Changed?
10 Temperatures Have Risen - mostly in the Winter
11 Annual Temperature Trends


12 Changes in Winter Mean Minimum Daily Temperature
13 Annual Temperature Trend Slopes
14 Rates of Increase in Temperatures Celsius degrees per 100 years Extreme Daily Minimum to 4.0 Mean Daily Minimum Mean Daily Mean Daily Maximum Extreme Daily Maximum - 0 to 0.5
15 Temperature Trends So Temperatures have been increasing somewhat steadily in Ontario, - perhaps for up to and at least 150 years! Winter temperatures have been rising at the greatest rate, suggesting that winter hydrology may have been impacted more than summer hydrology.
16 The Frequency of Frost Free Days has Increased Exponentially
17 Number of Frost-Free Days per Winter Frost-Free Days Number of Frost-Free Days versus Mean Daily Minimum Temperature per Winter for 7 Weather Stations days in 60 years days in 60 years day in 60 years WMDMT Winter Mean Daily Minimum Temperature ( C) y = exp(0.1729x) R² =
18 Frost-Free Days As winter mean daily minimum temperatures have been rising steadily, frost-free days have been increasing exponentially. Might snowmelt, which is related to degree-days, also have been increasing exponentially?
19 There Has Been a Shift in Winter Precipitation from Snowfall to Rainfall

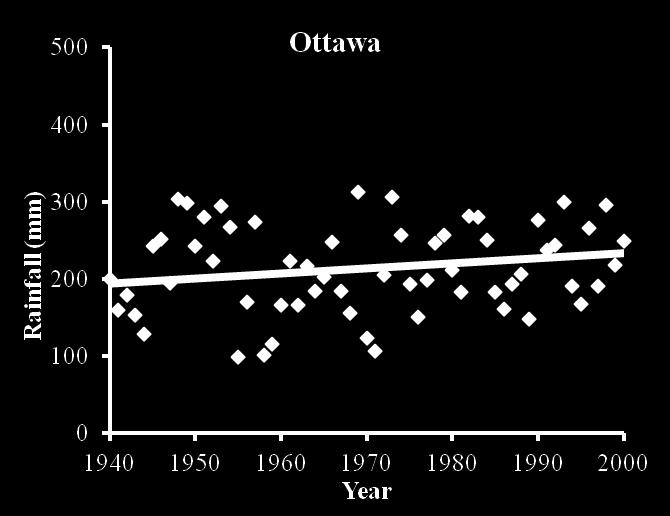
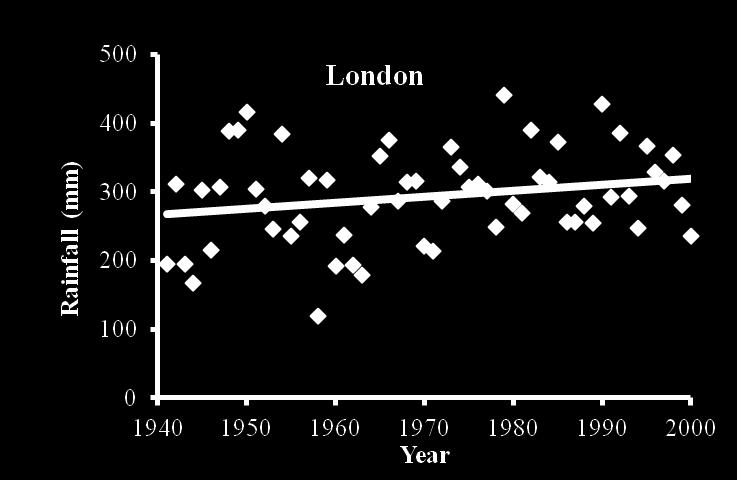
20 Changes in Winter Rainfall

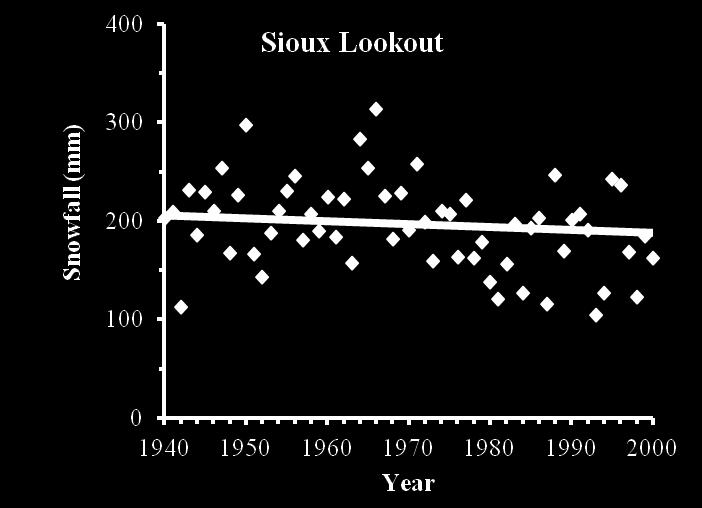
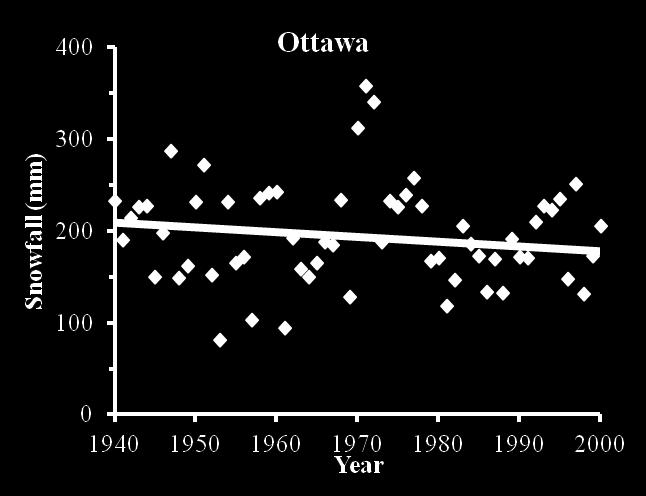
21 Changes in Snowfall

22 Changes in Winter Precipitation Total Precipitation Rainfall Snowfall Total Precipitation Snowfall Rainfall Total Precipitation Rainfall Snowfall

 Increased")
23 Increased Winter Temperature Shift from Snowfall to Rainfall (i.e. fewer Snow Days & Less Snowfall, & more Rainy Days & Winter Rainfall) Increased Number of Frost-Free Days
24 What about Impacts on Snowpacks, Winter Runoff & Infiltration
25 Likely Impacts I Rising Winter Temperatures Increased Winter Snowmelt Increasing Number of Frost-Free Days
26 Likely Impacts II Increased Winter Snowmelt Increased Winter Surface Runoff and/or Increased Winter Infiltration Increased Winter Rainfall


27 More Impacts I Increased Winter Tile Flow Increased Winter Infiltration Increased Winter Groundwater Recharge
28 More Impacts II Increased Winter Surface Runoff Increased Winter Streamflow Increased Winter Tile Flow & Recharge


29 And More Increased Winter Snowmelt Decreased End-of-Winter Snowpack Decreased Snowmelt Floods Decreased Snowfall
30 Dec Dec Dec Jan Jan Jan Feb Feb Mar Mar Mar Apr Apr May May May Jun Jun Jun Jul Jul Aug Aug Aug Sep Sep Oct Oct Oct Nov Nov Flow (cms) Flow (cms) Average Daily Flow Hydrographs Winter Spring Summer Fall Moira River at Foxboro
31 Rural Streamflows So for Ontario Rural Watersheds, changes in winter climate have: - increased winter streamflows and - decreased spring runoff/freshettes.
32 Water Quality Impacts What about Water Quality Impacts Are we now seeing more frequent and greater: - Field & Streambank Erosion, - Stream Sediment Loads, and - Nutrient Loads. in rural watersheds during the winter? Have these loads become smaller and less frequent during spring snowmelt events?
33 What about Impacts of Urban Development?
34 Flow For a highly urbanized basin like the Don River, winter flows have increased & spring flows have decreased likely as a result of both Climate Change & Urban Development. In addition, the summer flows have increased significantly in volume Average Monthly Flow Hydrographs Dec Jan Feb Mar Apr May Jun Jul Aug Sep Oct Nov Winter Spring Summer Fall

35 Flow (cms) Dec Dec Dec Jan Jan Jan Feb Feb Feb Mar Mar Mar Apr Apr May May May Jun Jun Jun Jul Jul Jul Aug Aug Aug Sep Sep Sep Oct Oct Nov Nov Nov Flow (cms) Average Daily Flow Hydrographs Spring Summer Fall and in frequency on the Don River at Todmorden. What s going on?!

36 Mean event runoff coefficient Runoff Coefficients April May June July August September October Before Urbanization Initial Urbanization Significant Urbanization (50%)
37 Streamflow Volumes So in Ontario urban watersheds: - urban development has augmented the winter and spring climate change impacts; and - summer flow volumes have increased dramatically, in volume and frequency, these impacts being completely due to urban development.
38 Impacts of Urbanization on River Water Quality Are we seeing more frequent flushes and greater volumes of: - streambank erosion - suspended sediment loads - Chlorides and other pollutants - sewage bypasses???
39 Conclusions River flows have changed in Southern Ontario: - in winter and spring, primarily due to climate change; and - during the summer, primarily due to urban development.
40 Questions Water Management Questions What do we do about the changes in river flows - in urbanized and urbanizing watersheds? How have these changes modified water quality, and what do we do in that regard?
41 Questions???
42 Flow Monthly Average Flow Hydrograph Dec Jan Feb Mar Apr May Jun Jul Aug Sep Oct Nov Winter Spring Summer Fall Moira River at Foxboro
43 Flow Monthly Average Flow Hydrograph Dec Jan Feb Mar Apr May Jun Jul Aug Sep Oct Nov Winter Spring Summer Fall Don River at Todmorden
 Daily Average Flow Hydrograph 160 140 120 100 80 60 40 20 1916-1925 2004-2013 0 Winter Spring Summer Fall Moira River at")
44 Dec Dec Dec Jan Jan Jan Feb Feb Mar Mar Mar Apr Apr May May May Jun Jun Jun Jul Jul Aug Aug Aug Sep Sep Oct Oct Oct Nov Nov Flow (cms) Flow (cms) Daily Average Flow Hydrograph Winter Spring Summer Fall Moira River at Foxboro
Changing Hydrology under a Changing Climate for a Coastal Plain Watershed
 Changing Hydrology under a Changing Climate for a Coastal Plain Watershed David Bosch USDA-ARS, Tifton, GA Jeff Arnold ARS Temple, TX and Peter Allen Baylor University, TX SEWRU Objectives 1. Project changes
Climate also has a large influence on how local ecosystems have evolved and how we interact with them.
 The Mississippi River in a Changing Climate By Paul Lehman, P.Eng., General Manager Mississippi Valley Conservation (This article originally appeared in the Mississippi Lakes Association s 212 Mississippi
2015 Fall Conditions Report
 2015 Fall Conditions Report Prepared by: Hydrologic Forecast Centre Date: December 21 st, 2015 Table of Contents Table of Figures... ii EXECUTIVE SUMMARY... 1 BACKGROUND... 2 SUMMER AND FALL PRECIPITATION...
GAMINGRE 8/1/ of 7
 FYE 09/30/92 JULY 92 0.00 254,550.00 0.00 0 0 0 0 0 0 0 0 0 254,550.00 0.00 0.00 0.00 0.00 254,550.00 AUG 10,616,710.31 5,299.95 845,656.83 84,565.68 61,084.86 23,480.82 339,734.73 135,893.89 67,946.95
Future Weather in Toronto and the GTA
 Future Weather in Toronto and the GTA Due to Climate Change Electrical Sector Meeting, Nov. 23 rd, 2011 Christopher Ll. Morgan, PhD Toronto Environment Office Contents 2 Introduction (Why We Did What We
Stream Discharge and the Water Budget
 Regents Earth Science Unit 6: Water Cycle & Climate Name: Lab # Stream Discharge and the Water Budget Introduction: The United States Geological Survey (USGS) measures and publishes values for the daily
A Report on a Statistical Model to Forecast Seasonal Inflows to Cowichan Lake
 A Report on a Statistical Model to Forecast Seasonal Inflows to Cowichan Lake Prepared by: Allan Chapman, MSc, PGeo Hydrologist, Chapman Geoscience Ltd., and Former Head, BC River Forecast Centre Victoria
WHEN IS IT EVER GOING TO RAIN? Table of Average Annual Rainfall and Rainfall For Selected Arizona Cities
 WHEN IS IT EVER GOING TO RAIN? Table of Average Annual Rainfall and 2001-2002 Rainfall For Selected Arizona Cities Phoenix Tucson Flagstaff Avg. 2001-2002 Avg. 2001-2002 Avg. 2001-2002 October 0.7 0.0
MARMOT CREEK BASIN: MANAGING FORESTS FOR WATER
 MARMOT CREEK BASIN: MANAGING FORESTS FOR WATER CABIN AND TWIN CREEK EXPERIMENTS 1962-1987 MARMOT CREEK SUBBASINS Subbasin Drainage Treatment Area (ha) (completion date) Cabin Creek 212 (50%)* Commercial
REDWOOD VALLEY SUBAREA
 Independent Science Review Panel Conceptual Model of Watershed Hydrology, Surface Water and Groundwater Interactions and Stream Ecology for the Russian River Watershed Appendices A-1 APPENDIX A A-2 REDWOOD
CFCAS project: Assessment of Water Resources Risk and Vulnerability to Changing Climatic Conditions. Project Report II.
 CFCAS project: Assessment of Water Resources Risk and Vulnerability to Changing Climatic Conditions Project Report II. January 2004 Prepared by and CFCAS Project Team: University of Western Ontario Slobodan
Impacts of climate change on flooding in the river Meuse
 Impacts of climate change on flooding in the river Meuse Martijn Booij University of Twente,, The Netherlands m.j.booij booij@utwente.nlnl 2003 in the Meuse basin Model appropriateness Appropriate model
Climate Change Impact Assessment on Long Term Water Budget for Maitland Catchment in Southern Ontario
 215 SWAT CONFERENCE, PURDUE Climate Change Impact Assessment on Long Term Water Budget for Maitland Catchment in Southern Ontario By Vinod Chilkoti Aakash Bagchi Tirupati Bolisetti Ram Balachandar Contents
A Review of the 2007 Water Year in Colorado
 A Review of the 2007 Water Year in Colorado Nolan Doesken Colorado Climate Center, CSU Mike Gillespie Snow Survey Division, USDA, NRCS Presented at the 28 th Annual AGU Hydrology Days, March 26, 2008,
2. PHYSICAL SETTING FINAL GROUNDWATER MANAGEMENT PLAN. 2.1 Topography. 2.2 Climate
 FINAL GROUNDWATER MANAGEMENT PLAN 2. PHYSICAL SETTING Lassen County is a topographically diverse area at the confluence of the Cascade Range, Modoc Plateau, Sierra Nevada and Basin and Range geologic provinces.
Champaign-Urbana 2000 Annual Weather Summary
 Champaign-Urbana 2000 Annual Weather Summary ILLINOIS STATE WATER SURVEY 2204 Griffith Dr. Champaign, IL 61820 wxobsrvr@sws.uiuc.edu Maria Peters, Weather Observer January: January started on a mild note,
Chiang Rai Province CC Threat overview AAS1109 Mekong ARCC
 Chiang Rai Province CC Threat overview AAS1109 Mekong ARCC This threat overview relies on projections of future climate change in the Mekong Basin for the period 2045-2069 compared to a baseline of 1980-2005.
Illinois State Water Survey Division
 Illinois State Water Survey Division SURFACE WATER SECTION SWS Miscellaneous Publication 108 SEDIMENT YIELD AND ACCUMULATION IN THE LOWER CACHE RIVER by Misganaw Demissie Champaign, Illinois June 1989
Inflow Forecasting for Hydro Catchments. Ross Woods and Alistair McKerchar NIWA Christchurch
 Inflow Forecasting for Hydro Catchments Ross Woods and Alistair McKerchar NIWA Christchurch Inflows Water flowing into hydro storages Usually measured by monitoring the levels and outflows from hydro storages
Climate Variability. Eric Salathé. Climate Impacts Group & Department of Atmospheric Sciences University of Washington. Thanks to Nathan Mantua
 Climate Variability Eric Salathé Climate Impacts Group & Department of Atmospheric Sciences University of Washington Thanks to Nathan Mantua Northwest Climate: the mean Factors that influence local/regional
January 25, Summary
 January 25, 2013 Summary Precipitation since the December 17, 2012, Drought Update has been slightly below average in parts of central and northern Illinois and above average in southern Illinois. Soil
Highlights of the 2006 Water Year in Colorado
 Highlights of the 2006 Water Year in Colorado Nolan Doesken, State Climatologist Atmospheric Science Department Colorado State University http://ccc.atmos.colostate.edu Presented to 61 st Annual Meeting
PRELIMINARY DRAFT FOR DISCUSSION PURPOSES
 Memorandum To: David Thompson From: John Haapala CC: Dan McDonald Bob Montgomery Date: February 24, 2003 File #: 1003551 Re: Lake Wenatchee Historic Water Levels, Operation Model, and Flood Operation This
4. THE HBV MODEL APPLICATION TO THE KASARI CATCHMENT
 Application of HBV model to the Kasari River, 1994 Page 1 of 6 Application of the HBV model to the Kasari river for flow modulation of catchments characterised by specific underlying features by R. Vedom,
Local Ctimatotogical Data Summary White Hall, Illinois
 SWS Miscellaneous Publication 98-5 STATE OF ILLINOIS DEPARTMENT OF ENERGY AND NATURAL RESOURCES Local Ctimatotogical Data Summary White Hall, Illinois 1901-1990 by Audrey A. Bryan and Wayne Armstrong Illinois
Three main areas of work:
 Task 2: Climate Information 1 Task 2: Climate Information Three main areas of work: Collect historical and projected weather and climate data Conduct storm surge and wave modeling, sea-level rise (SLR)
Quenching the Valley s thirst: The connection between Sierra Nevada snowpack & regional water supply
 Quenching the Valley s thirst: The connection between Sierra Nevada snowpack & regional water supply Roger Bales, UC Merced Snow conditions Snow & climate change Research directions Sierra Nevada snow
Champaign-Urbana 1998 Annual Weather Summary
 Champaign-Urbana 1998 Annual Weather Summary ILLINOIS STATE WATER SURVEY Audrey Bryan, Weather Observer 2204 Griffith Dr. Champaign, IL 61820 wxobsrvr@sparc.sws.uiuc.edu The development of the El Nìno
Evapo-transpiration Losses Produced by Irrigation in the Snake River Basin, Idaho
 Nov 7, 2007 DRAFT Evapo-transpiration Losses Produced by Irrigation in the Snake River Basin, Idaho Wendell Tangborn and Birbal Rana HyMet Inc. Vashon Island, WA Abstract An estimated 8 MAF (million acre-feet)
2003 Water Year Wrap-Up and Look Ahead
 2003 Water Year Wrap-Up and Look Ahead Nolan Doesken Colorado Climate Center Prepared by Odie Bliss http://ccc.atmos.colostate.edu Colorado Average Annual Precipitation Map South Platte Average Precipitation
The Climate of Payne County
 The Climate of Payne County Payne County is part of the Central Great Plains in the west, encompassing some of the best agricultural land in Oklahoma. Payne County is also part of the Crosstimbers in the
Climatography of the United States No
 Climate Division: AK 5 NWS Call Sign: ANC Month (1) Min (2) Month(1) Extremes Lowest (2) Temperature ( F) Lowest Month(1) Degree s (1) Base Temp 65 Heating Cooling 90 Number of s (3) Jan 22.2 9.3 15.8
The Climate of Oregon Climate Zone 3 Southwest Interior
 .k) 105 Unbound issue " " 1 4oes not circulate C4P. Special Report 915 May 1993 The Climate of Oregon Climate Zone 3 Southwest Interior Property of OREGON STATE UNIVERSITY Library Serials Corvallis, OR
The Colorado Drought : 2003: A Growing Concern. Roger Pielke, Sr. Colorado Climate Center.
 The Colorado Drought 2001-2003: 2003: A Growing Concern Roger Pielke, Sr. Colorado Climate Center Prepared by Tara Green and Odie Bliss http://climate.atmos.colostate.edu 2 2002 Drought History in Colorado
Variability and trends in daily minimum and maximum temperatures and in diurnal temperature range in Lithuania, Latvia and Estonia
 Variability and trends in daily minimum and maximum temperatures and in diurnal temperature range in Lithuania, Latvia and Estonia Jaak Jaagus Dept. of Geography, University of Tartu Agrita Briede Dept.
Colorado s 2003 Moisture Outlook
 Colorado s 2003 Moisture Outlook Nolan Doesken and Roger Pielke, Sr. Colorado Climate Center Prepared by Tara Green and Odie Bliss http://climate.atmos.colostate.edu How we got into this drought! Fort
The Climate of Bryan County
 The Climate of Bryan County Bryan County is part of the Crosstimbers throughout most of the county. The extreme eastern portions of Bryan County are part of the Cypress Swamp and Forest. Average annual
GLACIER AND SNOWMELT MODELLING USING SWAT: GANGA BASIN CASE STUDY. INRM Consultants Pvt. Ltd.
 GLACIER AND SNOWMELT MODELLING USING SWAT: GANGA BASIN CASE STUDY INRM Consultants Pvt. Ltd. Introduction Snowmelt Runoff contribution in the Himalayan Rivers Estimation of Average contribution of Snowmelt
Presentation Overview. Southwestern Climate: Past, present and future. Global Energy Balance. What is climate?
 Southwestern Climate: Past, present and future Mike Crimmins Climate Science Extension Specialist Dept. of Soil, Water, & Env. Science & Arizona Cooperative Extension The University of Arizona Presentation
CoCoRaHS Monitoring Colorado s s Water Resources through Community Collaborations
 CoCoRaHS Monitoring Colorado s s Water Resources through Community Collaborations Nolan Doesken Colorado Climate Center Atmospheric Science Department Colorado State University Presented at Sustaining
Streamflow, Sediment, and Nutrient Simulation of the Bitterroot Watershed using SWAT
 Streamflow, Sediment, and Nutrient Simulation of the Bitterroot Watershed using SWAT by Dr. Michael Van Liew Montana Department of Environmental Quality Helena, Montana, USA Site Map of SWAT Watersheds
Modeling the Effects of Climate and Land Cover Change in the Stoney Brook Subbasin of the St. Louis River Watershed
 Modeling the Effects of Climate and Land Cover Change in the Stoney Brook Subbasin of the St. Louis River Watershed Joe Johnson and Jesse Pruette 214 NASA Research Internship Geospatial Technologies Program
2003 Moisture Outlook
 2003 Moisture Outlook Nolan Doesken and Roger Pielke, Sr. Colorado Climate Center Prepared by Tara Green and Odie Bliss http://climate.atmos.colostate.edu Through 1999 Through 1999 Fort Collins Total Water
9. PROBABLE MAXIMUM PRECIPITATION AND PROBABLE MAXIMUM FLOOD
 9. PROBABLE MAXIMUM PRECIPITATION AND PROBABLE MAXIMUM FLOOD 9.1. Introduction Due to the size of Watana Dam and the economic importance of the Project to the Railbelt, the Probable Maximum Flood (PMF)
Appendix A Calibration Memos
 Appendix A Calibration Memos University of Washington Department of Civil and Environmental Engineering TO: Joe Dvorak FROM: Margaret Hahn and Richard Palmer RE: DVSVM Calibration DATE: June 28, 21 This
Drought Characterization. Examination of Extreme Precipitation Events
 Drought Characterization Examination of Extreme Precipitation Events Extreme Precipitation Events During the Drought For the drought years (1999-2005) daily precipitation data was analyzed to find extreme
Analysis of Historical Pattern of Rainfall in the Western Region of Bangladesh
 24 25 April 214, Asian University for Women, Bangladesh Analysis of Historical Pattern of Rainfall in the Western Region of Bangladesh Md. Tanvir Alam 1*, Tanni Sarker 2 1,2 Department of Civil Engineering,
A Recap of Colorado s Water Year 2018
 A Recap of Colorado s Water Year 2018 For further inquiries, please contact: Russ Schumacher, State Climatologist (970) 491-8084 Becky Bolinger, Assistant State Climatologist (970) 491-8506 Peter Goble,
HYDROLOGICAL MODELING OF HIGHLY GLACIERIZED RIVER BASINS. Nina Omani, Raghavan Srinivasan, Patricia Smith, Raghupathy Karthikeyan, Gerald North
 HYDROLOGICAL MODELING OF HIGHLY GLACIERIZED RIVER BASINS Nina Omani, Raghavan Srinivasan, Patricia Smith, Raghupathy Karthikeyan, Gerald North Problem statement Glaciers help to keep the earth cool High
Jackson County 2013 Weather Data
 Jackson County 2013 Weather Data 61 Years of Weather Data Recorded at the UF/IFAS Marianna North Florida Research and Education Center Doug Mayo Jackson County Extension Director 1952-2008 Rainfall Data
The Climate of Seminole County
 The Climate of Seminole County Seminole County is part of the Crosstimbers. This region is a transition region from the Central Great Plains to the more irregular terrain of southeastern Oklahoma. Average
The Climate of Kiowa County
 The Climate of Kiowa County Kiowa County is part of the Central Great Plains, encompassing some of the best agricultural land in Oklahoma. Average annual precipitation ranges from about 24 inches in northwestern
Flood Inundation Mapping under different climate change scenarios in the upper Indus River Basin, Pakistan
 Flood Inundation Mapping under different climate change scenarios in the upper Indus River Basin, Pakistan Sohaib Baig (doctoral student) 16 November 2017 Disaster Prevention Research Institute 1 Kyoto
Hydrologic Conditions in the Delaware River Basin
 Hydrologic Conditions in the Delaware River Basin April : Flooding in Lambertville, New Jersey Aerial photo used with permission of www.elevated-images.com Annual Report Prepared by Operations Staff June
Drought in Southeast Colorado
 Drought in Southeast Colorado Nolan Doesken and Roger Pielke, Sr. Colorado Climate Center Prepared by Tara Green and Odie Bliss http://climate.atmos.colostate.edu 1 Historical Perspective on Drought Tourism
February 10, Mr. Jeff Smith, Chairman Imperial Valley Water Authority E County Road 1000 N Easton, IL Dear Chairman Smith:
 February 1, 1 Mr. Jeff Smith, Chairman Imperial Valley Water Authority 8 E County Road 1 N Easton, IL Dear Chairman Smith: The Illinois State Water Survey (ISWS), under contract to the Imperial Valley
The Huong River the nature, climate, hydro-meteorological issues and the AWCI demonstration project
 The Huong River the nature, climate, hydro-meteorological issues and the AWCI demonstration project 7th GEOSS AP Symposium, the AWCI parallel session May 27, 214, Tokyo National Centre for Hydro-Meteorological
The Climate of Marshall County
 The Climate of Marshall County Marshall County is part of the Crosstimbers. This region is a transition region from the Central Great Plains to the more irregular terrain of southeastern Oklahoma. Average
MISSION DEBRIEFING: Teacher Guide
 Activity 2: It s Raining Again?! Using real data from one particular location, students will interpret a graph that relates rainfall to the number of cases of malaria. Background The relationship between
Climatography of the United States No
 Month (1) Min (2) Month(1) Extremes Lowest (2) Temperature ( F) Lowest Month(1) Degree s (1) Base Temp 65 Heating Cooling 100 Number of s (3) Jan 63.9 39.3 51.6 86 1976 16 56.6 1986 20 1976 2 47.5 1973
Climatography of the United States No
 Temperature ( F) Month (1) Min (2) Month(1) Extremes Lowest (2) Lowest Month(1) Degree s (1) Base Temp 65 Heating Cooling 100 Number of s (3) Jan 32.8 21.7 27.3 62 1918 1 35.8 1983-24 1950 29 10.5 1979
The Colorado Drought of 2002 in Perspective
 The Colorado Drought of 2002 in Perspective Colorado Climate Center Nolan Doesken and Roger Pielke, Sr. Prepared by Tara Green and Odie Bliss http://climate.atmos.colostate.edu Known Characteristics of
Study of Hydrometeorology in a Hard Rock Terrain, Kadirischist Belt Area, Anantapur District, Andhra Pradesh
 Open Journal of Geology, 2012, 2, 294-300 http://dx.doi.org/10.4236/ojg.2012.24028 Published Online October 2012 (http://www.scirp.org/journal/ojg) Study of Hydrometeorology in a Hard Rock Terrain, Kadirischist
2016 Meteorology Summary
 2016 Meteorology Summary New Jersey Department of Environmental Protection AIR POLLUTION AND METEOROLOGY Meteorology plays an important role in the distribution of pollution throughout the troposphere,
CLIMATE OVERVIEW. Thunder Bay Climate Overview Page 1 of 5
 CLIMATE OVERVIEW The climate in the Thunder Bay area is typical of a mid-latitude inland location with a Great Lake Moderating influence. The moderating effect of Lake Superior results in cooler summer
Lake Tahoe Watershed Model. Lessons Learned through the Model Development Process
 Lake Tahoe Watershed Model Lessons Learned through the Model Development Process Presentation Outline Discussion of Project Objectives Model Configuration/Special Considerations Data and Research Integration
What Does It Take to Get Out of Drought?
 What Does It Take to Get Out of Drought? Nolan J. Doesken Colorado Climate Center Colorado State University http://ccc.atmos.colostate.edu Presented at the Insects, Diseases and Drought Workshop, May 19,
HYDROLOGIC AND WATER RESOURCES EVALUATIONS FOR SG. LUI WATERSHED
 HYDROLOGIC AND WATER RESOURCES EVALUATIONS FOR SG. LUI WATERSHED 1.0 Introduction The Sg. Lui watershed is the upper part of Langat River Basin, in the state of Selangor which located approximately 20
Climate Change Impact Assessment on Indian Water Resources. Ashvin Gosain, Sandhya Rao, Debajit Basu Ray
 Climate Change Impact Assessment on Indian Water Resources Ashvin Gosain, Sandhya Rao, Debajit Basu Ray Objectives of the Study To quantify the impact of the climate change on the water resources of the
The Climate of Grady County
 The Climate of Grady County Grady County is part of the Central Great Plains, encompassing some of the best agricultural land in Oklahoma. Average annual precipitation ranges from about 33 inches in northern
Modeling of peak inflow dates for a snowmelt dominated basin Evan Heisman. CVEN 6833: Advanced Data Analysis Fall 2012 Prof. Balaji Rajagopalan
 Modeling of peak inflow dates for a snowmelt dominated basin Evan Heisman CVEN 6833: Advanced Data Analysis Fall 2012 Prof. Balaji Rajagopalan The Dworshak reservoir, a project operated by the Army Corps
Climatography of the United States No
 Climate Division: CA 4 NWS Call Sign: Month (1) Min (2) Month(1) Extremes Lowest (2) Temperature ( F) Lowest Month(1) Degree s (1) Base Temp 65 Heating Cooling 100 Number of s (3) Jan 55.6 39.3 47.5 77
Climatography of the United States No
 Climate Division: CA 5 NWS Call Sign: Month (1) Min (2) Month(1) Extremes Lowest (2) Temperature ( F) Lowest Month(1) Degree s (1) Base Temp 65 Heating Cooling 100 Number of s (3) Jan 56.6 36.5 46.6 81
Climatography of the United States No
 Climate Division: CA 1 NWS Call Sign: Month (1) Min (2) Month(1) Extremes Lowest (2) Temperature ( F) Lowest Month(1) Degree s (1) Base Temp 65 Heating Cooling 100 Number of s (3) Jan 57.9 38.9 48.4 85
Climatography of the United States No
 Climate Division: CA 5 NWS Call Sign: Month (1) Min (2) Month(1) Extremes Lowest (2) Temperature ( F) Lowest Month(1) Degree s (1) Base Temp 65 Heating Cooling 100 Number of s (3) Jan 44.8 25.4 35.1 72
Climatography of the United States No
 Climate Division: CA 4 NWS Call Sign: Month (1) Min (2) Month(1) Extremes Lowest (2) Temperature ( F) Lowest Month(1) Degree s (1) Base Temp 65 Heating Cooling 100 Number of s (3) Jan 49.4 37.5 43.5 73
Climatography of the United States No
 Climate Division: CA 6 NWS Call Sign: Month (1) Min (2) Month(1) Extremes Lowest (2) Temperature ( F) Lowest Month(1) Degree s (1) Base Temp 65 Heating Cooling 100 Number of s (3) Jan 69.4 46.6 58.0 92
Climatography of the United States No
 Climate Division: CA 4 NWS Call Sign: Month (1) Min (2) Month(1) Extremes Lowest (2) Temperature ( F) Lowest Month(1) Degree s (1) Base Temp 65 Heating Cooling 1 Number of s (3) Jan 58.5 38.8 48.7 79 1962
The Climate of Pontotoc County
 The Climate of Pontotoc County Pontotoc County is part of the Crosstimbers. This region is a transition region from the Central Great Plains to the more irregular terrain of southeast Oklahoma. Average
Climatography of the United States No
 Climate Division: CA 6 NWS Call Sign: Month (1) Min (2) Month(1) Extremes Lowest (2) Temperature ( F) Lowest Month(1) Degree s (1) Base Temp 65 Heating Cooling 1 Number of s (3) Jan 67.5 42. 54.8 92 1971
Climatography of the United States No
 Climate Division: CA 1 NWS Call Sign: Month (1) Min (2) Month(1) Extremes Lowest (2) Temperature ( F) Lowest Month(1) Degree s (1) Base Temp 65 Heating Cooling 1 Number of s (3) Jan 57.8 39.5 48.7 85 1962
Memo. I. Executive Summary. II. ALERT Data Source. III. General System-Wide Reporting Summary. Date: January 26, 2009 To: From: Subject:
 Memo Date: January 26, 2009 To: From: Subject: Kevin Stewart Markus Ritsch 2010 Annual Legacy ALERT Data Analysis Summary Report I. Executive Summary The Urban Drainage and Flood Control District (District)
Fire Season Prediction for Canada, Kerry Anderson Canadian Forest Service
 Fire Season Prediction for Canada, 2014 Kerry Anderson Canadian Forest Service 1 Introduction The Canadian Forest Service is now presenting monthly and seasonal forecast maps through the Canadian Wildland
Climatography of the United States No
 Climate Division: ND 8 NWS Call Sign: BIS Month (1) Min (2) Month(1) Extremes Lowest (2) Temperature ( F) Lowest Month(1) Degree s (1) Base Temp 65 Heating Cooling 100 Number of s (3) Jan 21.1 -.6 10.2
Climatography of the United States No
 Climate Division: TN 1 NWS Call Sign: Month (1) Min (2) Month(1) Extremes Lowest (2) Temperature ( F) Lowest Month(1) Degree s (1) Base Temp 65 Heating Cooling 100 Number of s (3) Jan 47.6 24.9 36.3 81
Climatography of the United States No
 Climate Division: CA 5 NWS Call Sign: FAT Month (1) Min (2) Month(1) Extremes Lowest (2) Temperature ( F) Lowest Month(1) Degree s (1) Base Temp 65 Heating Cooling 1 Number of s (3) Jan 53.6 38.4 46. 78
Impacts of snowpack accumulation and summer weather on alpine glacier hydrology
 Impacts of snowpack accumulation and summer weather on alpine glacier hydrology Caroline Aubry-Wake, Dhiraj Pradhananga, John W. Pomeroy GEWEX 8 th Open Science Meeting, Canmore AB, May 3-11 2018 Canadian
Climatography of the United States No
 Climate Division: CA 6 NWS Call Sign: 1L2 N Lon: 118 3W Month (1) Min (2) Month(1) Extremes Lowest (2) Temperature ( F) Lowest Month(1) Degree s (1) Base Temp 65 Heating Cooling 1 Number of s (3) Jan 63.7
Science Standard 1: Students analyze monthly precipitation and temperature records, displayed in bar charts, collected in metric units (mm).
.") Title: Precipitation Patterns across the Globe NSF GK-12 Fellow: Terry Legg Type of Lesson: STEM Grade Level(s): 4 th - 7 th grade This activity can be tailored to older, more advanced students by having
Title: Precipitation Patterns across the Globe NSF GK-12 Fellow: Terry Legg Type of Lesson: STEM Grade Level(s): 4 th - 7 th grade This activity can be tailored to older, more advanced students by having
THE STATE OF SURFACE WATER GAUGING IN THE NAVAJO NATION
 THE STATE OF SURFACE WATER GAUGING IN THE NAVAJO NATION Aregai Tecle Professor of Hydrology Northern Arizona University Flagstaff, AZ Acknowledgement Many thanks to my research team mates and Elisabeth
UK Flooding Feb 2003
 UK Flooding 2000 06 Feb 2003 Britain has taken a battering from floods in the last 5 years, with major events in 1998 and 2000, significant floods in 2001 and minor events in each of the other years. So
Climatography of the United States No
 Climate Division: CA 5 NWS Call Sign: BFL Month (1) Min (2) Month(1) Extremes Lowest (2) Temperature ( F) Lowest Month(1) Degree s (1) Base Temp 65 Heating Cooling 1 Number of s (3) Jan 56.3 39.3 47.8
CLIMATE RESILIENCE FOR ALBERTA MUNICIPALITIES CLIMATE PROJECTIONS SOUTHERN ALBERTA. Dr. Mel Reasoner Reasoner Environmental Consulting
 CLIMATE RESILIENCE FOR ALBERTA MUNICIPALITIES CLIMATE PROJECTIONS SOUTHERN ALBERTA Dr. Mel Reasoner Reasoner Environmental Consulting Probability of occurrence Increase in Mean Temperature & Variance Less
APPLICATIONS OF DOWNSCALING: HYDROLOGY AND WATER RESOURCES EXAMPLES
 APPLICATIONS OF DOWNSCALING: HYDROLOGY AND WATER RESOURCES EXAMPLES Dennis P. Lettenmaier Department of Civil and Environmental Engineering For presentation at Workshop on Regional Climate Research NCAR
Typical Hydrologic Period Report (Final)
") (DELCORA) (Final) November 2015 (Updated April 2016) CSO Long-Term Control Plant Update REVISION CONTROL REV. NO. DATE ISSUED PREPARED BY DESCRIPTION OF CHANGES 1 4/26/16 Greeley and Hansen Pg. 1-3,
(DELCORA) (Final) November 2015 (Updated April 2016) CSO Long-Term Control Plant Update REVISION CONTROL REV. NO. DATE ISSUED PREPARED BY DESCRIPTION OF CHANGES 1 4/26/16 Greeley and Hansen Pg. 1-3,
Hydro-meteorological Analysis of Langtang Khola Catchment, Nepal
 Hydro-meteorological Analysis of Langtang Khola Catchment, Nepal Tirtha R. Adhikari 1, Lochan P. Devkota 1, Suresh.C Pradhan 2, Pradeep K. Mool 3 1 Central Department of Hydrology and Meteorology Tribhuvan
The Climate of Murray County
 The Climate of Murray County Murray County is part of the Crosstimbers. This region is a transition between prairies and the mountains of southeastern Oklahoma. Average annual precipitation ranges from
The Climate of Oregon Climate Zone 4 Northern Cascades
 /05 E55 Unbound issue No. 9/ is Does not circulate Special Report 916 May 1993 The Climate of Oregon Climate Zone 4 Property of OREGON STATE UNIVERSITY Library Serials Corvallis, OR 97331-4503 Agricultural
Climatography of the United States No
 Climate Division: TN 3 NWS Call Sign: BNA Month (1) Min (2) Month(1) Extremes Lowest (2) Temperature ( F) Lowest Month(1) Degree s (1) Base Temp 65 Heating Cooling 100 Number of s (3) Jan 45.6 27.9 36.8
Algae and Dissolved Oxygen Dynamics of Landa Lake and the Upper Spring Run
 Algae and Dissolved Oxygen Dynamics of Landa Lake and the Upper Spring Run Why study algae and dissolved oxygen dynamics of Landa Lake and the Upper Spring Run? During low-flow conditions, extensive algal