2. PHYSICAL SETTING FINAL GROUNDWATER MANAGEMENT PLAN. 2.1 Topography. 2.2 Climate
|
|
|
- Abel Armstrong
- 6 years ago
- Views:
Transcription
1 FINAL GROUNDWATER MANAGEMENT PLAN 2. PHYSICAL SETTING Lassen County is a topographically diverse area at the confluence of the Cascade Range, Modoc Plateau, Sierra Nevada and Basin and Range geologic provinces. Hills, mountains, and valleys are the predominant landforms. The majority of agricultural and urban development occurs in valleys and relies upon groundwater and surface water sources. There are 24 groundwater basins in Lassen County. The amount of information available for each basin varies significantly, and the basins with the most development are generally better characterized. This section of the GWMP characterizes the physical setting of Lassen County, including: Topography, Climate, Surface water hydrology, Geology, Groundwater basins, and Water Use. 2.1 Topography Lassen County encompasses 4,547 square miles (2,910,000 acres) of varied topography. The highest point in Lassen County is 8,737 feet above mean seal level (msl) at Hat Peak in the northeast, and the lowest elevation is 3,270 feet above msl where the Pit River exits the county to the west. Figure 2-1 illustrates Lassen County topography. 2.2 Climate Photo 2-1. Lassen County topography is widely variable and influences precipitation patterns. Lassen County experiences significant seasonal variation in temperature and precipitation. The county experiences average summer high temperatures in the 80s degrees Fahrenheit ( F), and average winter low temperatures in the 20s F. Total accumulation of winter snowfall averages between 20 and 40 inches annually in the valley areas with greater snowfall totals in the higher elevations. Temperature and precipitation follow noticeable patterns for various regions in Lassen County. Lower elevations generally experience warmer temperatures with lesser amounts of annual rainfall, in contrast to higher elevations that experience cooler temperatures throughout the year and greater amounts of annual snowfall. Three selected weather stations, shown in Figure 2-2, provide information on temperature, rainfall, and snowfall: 2-1
2
3
4 Hills South of Doyle (042504): The Doyle station is in the hills south of Doyle, west of Long Valley Creek, at an elevation of 4,390 feet above mean sea level (msl), with records extending 75 years from 1931 through Susanville (048702): The Susanville station is in the southwestern area of Susanville, south of the Susan River, at an elevation of 4,184 feet above msl, with records extending 60 years from 1946 through Termo (048873): The Termo station is in Termo, east of Highway 395, at an elevation of 5,300 feet above msl, with records extending 51 years from 1948 through These stations were chosen because they have long periods of record. The stations also represent the climate in two parts of the Honey Lake valley, and an upland area in Madeline Plains. The following sections use data from these stations to describe Lassen County climate. Additional weather stations were considered, but not selected to characterize weather patterns in Lassen County. Weather stations considered include: Bieber (040731), with a period of record of 48 years from 1948 to 2006, Blacks Mountain Ranch (040870), with a period of record of 12 years from 1948 to 1960, Doyle 4 SSE (042506), with a period of record of 50 years from 1956 to 2006, Eagle Lake Stone Ranch (042595), with a period of record of 2 years from 1959 to 1961, Fleming Fish and Game (043087), with a period of record of 18 years from 1959 to 1977, Little Valley (044988), with a period of record of 15 years from 1960 to 1975, Madeline (045231), with a period of record of 41 years from 1931 to 1972, Milford Laufman Rs (045623), with a period of record of 58 years from 1948 to 2006, Secret Valley (048074), with a period of record of 15 years from 1962 to 1977, Standish 1 E (048487), with a period of record of 12 years from 1961 to 1973, Susanville 1 WNW (048703), with a period of record of 54 years from 1946 to 2006, Termo Brin Marr (048875), with a period of record of 3 years from 1960 to 1963, Wendel 10 SE (049526), with a period of record of 18 years from 1959 to 1977, and Westwood (049599), with a period of record of 24 years from 1929 to Temperature Table 2-1 includes the average, maximum, and minimum monthly mean air temperatures at the three stations. Daily temperature measurements show similar trends at each station, with the Termo station usually averaging five or more degrees cooler. The temperatures in Table 2-1 indicate a wide seasonal variability at each station. Average monthly temperatures range from about 27 F to 33 F during December through January to about 63 F to 71 F during July through August. 2-4
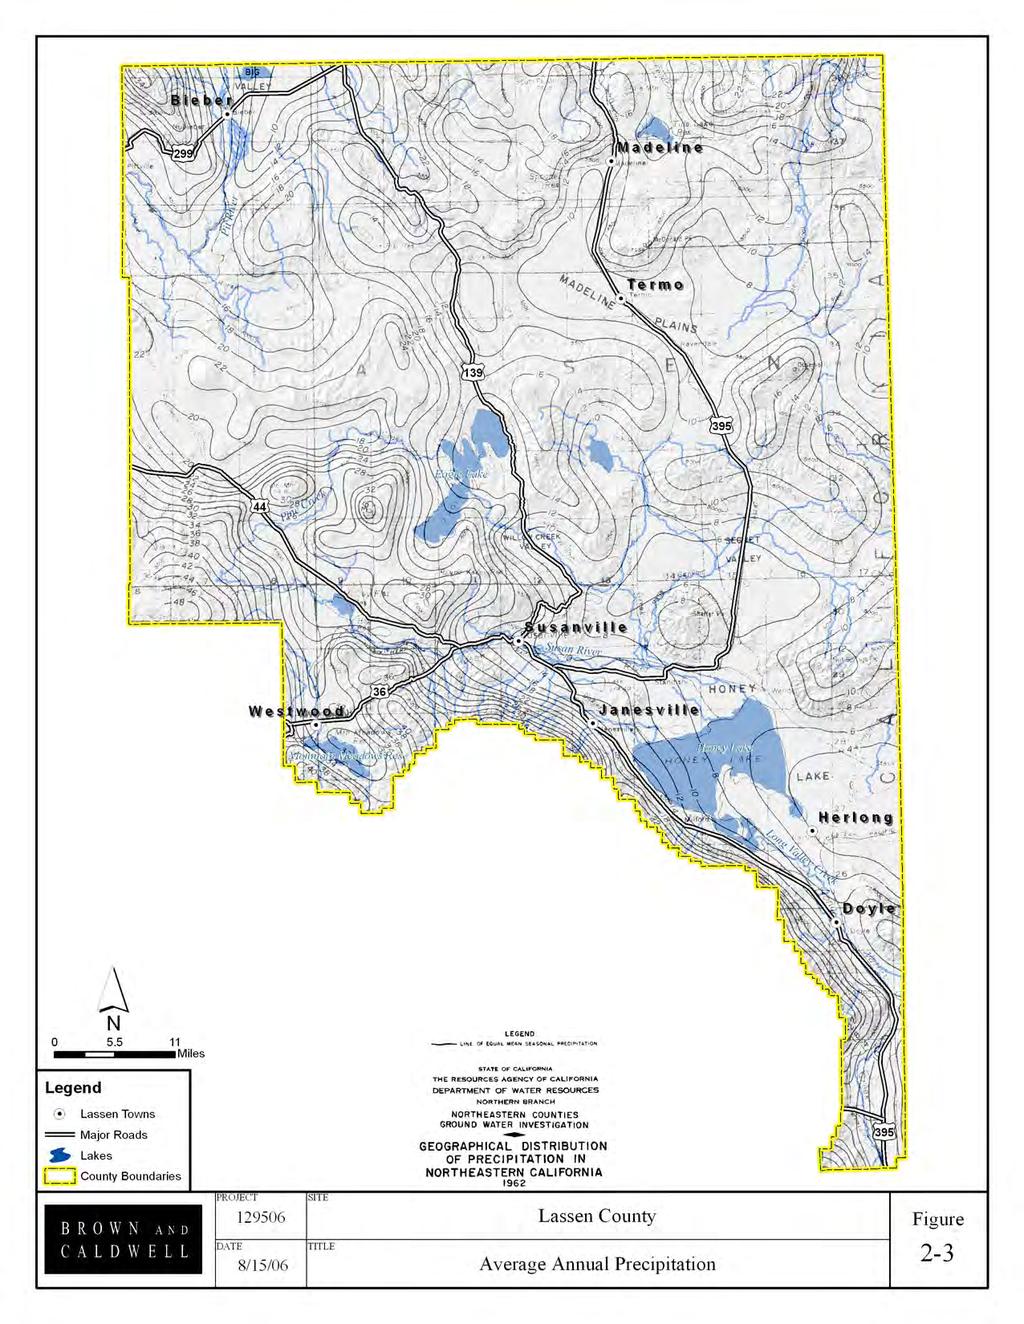
5 Table 2-1. Monthly Air Temperatures in Degrees Fahrenheit at Lassen County Weather Stations Month Hills South of Doyle (042504) Susanville (048702) Termo (048873) Avg Max Min Avg Max Min Avg Max Min January February March April May June July August September October November December Source: Western Regional Climate Center, Average monthly low temperatures are below freezing in November, December, January, February, and March at all three stations. Average monthly high temperatures range from 75 F to 92 F during the summer months of June, July, and August Precipitation Precipitation is influenced by the mountains within Lassen County; greater precipitation typically occurs in the western portion of the county at higher elevations, as shown in Figure 2-3. Precipitation amounts presented in Figure 2-3 are estimated based on data from precipitation stations, topography, and other factors. Precipitation is caused by orographic uplift, as air temperatures cool as the air mass rises over the mountains, resulting in condensation that falls as precipitation. Table 2-2 presents average annual precipitation and snowfall for the three stations, illustrating the significant variability in precipitation between different water years. Table 2-2. Average Annual Precipitation and Snowfall at Lassen County Weather Stations Average Precipitation (in) Average Snowfall (in) Hills South of Doyle Susanville Termo Source: University of California Statewide Integrated Pest Management Program (UP IPM), Western Regional Climate Center, Figure 2-4 depicts the average monthly precipitation, including snowfall over the period of record for the three stations, reported in inches of water. In summer months, areas of high pressure are commonly established over northern California, effectively blocking the inland movement of moist marine air, causing extended periods of little precipitation. Because of this, precipitation is strongly 2-5
6 seasonal, occurring mostly in November through March. Most precipitation in winter at Termo occurs as snowfall, as indicated in Table 2-2. On average, little rain occurs in the months of July, August, and September. Annual precipitation totals in the Honey Lake valley reflect wet periods and drought periods. Figure 2-5 shows annual precipitation by year at the hills south of Doyle and Susanville weather stations. Both stations show less than 10 inches of precipitation during the 1976 drought, and rainfall totals less than 20 inches during the 1987 through 1994 drought period. 2.3 Surface Water Hydrology The hydrologic characteristics of Lassen County s rivers and streams vary depending on the watershed of origin, area-elevation relationships, and snowfall accumulation patterns. This section describes flows on three of Lassen County s rivers and creeks: the Pit River, the Susan River, and Long Valley Creek. Figure 2-2 shows surface water bodies and representative gauge locations within Lassen County. There are seven watersheds in Lassen County, including Duck Flat, Feather River, Madeline Plains, Pit River, Smoke Creek, Surprise Valley, and Susan River, as shown in Figure 2-6. The Pit River flows through the northwestern portion of the County, draining to the west. The Susan River flows easterly to Honey Lake in the central portion of the County. Long Valley Creek flows from Upper Long Valley north into Honey Lake. Honey Lake, the largest lake in Lassen County, receives water from the Susan River, Long Valley Creek, Baxter Creek, and Willow Creek. Several streams in Lassen County are adjudicated. Adjudication is the process by which the amount of water that may be diverted by users of the stream is prescribed, and usually enforced by a water master. Adjudicated streams in Lassen County include: Ash Creek, Baxter Creek, Hallett Creek, Long Valley Creek, Mill Creek, Parker Creek, Pit River in Big Valley, and the Susan River (DWR, 1992). Figures 2-7 through 2-9 show data from stream gauges on three streams and rivers in Lassen County. The average monthly flow is indicated by the bars in Figures 2-7 through
7
8 3 2.5 Hills South of Doyle (042504) Susanville (048702) Termo (048873) 2 Rainfall (Inches) Jan Feb Mar Apr May Jun Jul Aug Sep Oct Nov Dec Month Source: University of California Statewide Integrated Pest Management Program (UP IPM), Figure 2-4. Average Precipitation at Lassen County Weather Stations Hills South of Doyle (042504) Susanville (048702) 30 Precipitation (Inches) Year Source: University of California Statewide Integrated Pest Management Program (UP IPM), Figure 2-5. Annual Rainfall at Two Lassen County Weather Stations 2-8
9
10 The Pit River Flows on the Pit River are high in the spring and low in the summer and fall. Figure 2-7 shows average stream flows on the Pit River. Average monthly flows are over 400 cubic feet per second (cfs) in January through May, and below 200 cfs in July through December. Average monthly flows are lower in April than in May, which correlates with the amount of rainfall received at the three Lassen County weather stations shown in Figure 2-4. The Pit River stream gauge has a period of record from 1994 through This short period of record may account for the low reported average flows on the Pit River in April. Monthly Average Flows on the Pit River at USGS Gauge from 1994 through Average Stream Flow (CFS) Jan Feb Mar Apr May Jun Jul Aug Sep Oct Nov Dec Month Figure 2-7. Stream Flows on the Pit River The Susan River Flows on the Susan River are high in the spring and lower in the summer and fall. Figure 2-8 shows average stream flows on the Susan River. Average monthly flows are over 100 cfs in February through May, and below 50 cfs in August through November. Rainfall increases at the three weather stations in November and December without a corresponding increase in Susan River flows over the same period, likely due to accumulation of the precipitation as snowpack. In April and May, the snowpack melts, increasing flow volumes on the Susan River. 2-10

11 Monthly Average Flows on the Susan River at USGS Gauge from 1950 through Average Stream Flow (CFS) Jan Feb Mar Apr May Jun Jul Aug Sep Oct Nov Dec Month Figure 2-8. Stream Flows on the Susan River Long Valley Creek Long Valley Creek flows from the south to the north into Honey Lake. Long Valley Creek flows year round in Upper Long Valley, and is intermittent in stretches in Honey Lake Valley. Flows on Long Valley Creek were measured for five years from 1989 through Average flows over this period are high in March and lower in the rest of the year, and could be affected by one high flow event in March. Figure 2-9 shows average stream flows on Long Valley Creek over the five year period. Average monthly flows are over 35 cfs in March, and below 15 cfs the rest of the year. Rainfall increases at the three weather stations in winter and spring without a corresponding increase in Long Valley Creek flow measurements, likely due to the short period of record of the stream gauge. Photo 2-2. Long Valley Creek flowing in the Long Valley Groundwater Basin 2-11
12 Monthly Average Flows on the Long Valley Creek at USGS Gauge from 1989 through 1994 Average Stream Flow (CFS) Jan Feb Mar Apr May Jun Jul Aug Sep Oct Nov Dec Month Figure 2-9. Stream Flows on Long Valley Creek 2.4 Geology Lassen County is at the confluence of four geomorphic provinces, the Sierra Nevada, the Basin and Range, the Cascade Range, and the Modoc Plateau. Geology in the County consists of volcanic rock that forms many ridges and mountains and sedimentary rocks that form groundwater basins in valleys. The Sierra Nevada geomorphic province is present in the southwestern portion of the county, and is primarily composed of granite. The Basin and Range province is present in the southeastern portion of the County, and includes the Honey Lake Valley. The Cascade Range and Modoc Plateau geomorphic provinces are in the central, northern, and western portions of the County and are primarily composed of volcanic rock. The Sierra Nevada is composed of mainly igneous and metamorphic rocks of diverse composition and age. Plutonic igneous rocks form the base of the Sierras, and metamorphic rocks overlie the plutons of granitic rock. Metamorphic rock is present in the southwestern edge of Lassen County, and the Honey Lake Valley is bounded on the west by granitic rocks of the Sierra Nevada province. The Basin and Range province is present in Lassen County primarily in the Honey Lake area. Though underlain by rocks of the Modoc Plateau in this area, the Basin and Range province is characterized by high north-south trending mountains and long narrow valleys filled with sediments. The valley areas of the Basin and Range have interior drainage, often draining to a terminal lake, like Honey Lake. The Cascade Range in Lassen County is the southern end of a range of volcanic mountains. The Cascade Range includes Mount Lassen and Mount Shasta. In Lassen County, the range includes a number of volcanic features. Volcanic rocks in the Cascade Range consist primarily of andesite and explosive lavas. The Modoc Plateau is an undulating platform composed of assorted volcanic materials, principally basaltic lava flows. The Modoc Plateau grades west into the Cascade Range and 2-12

13 south into the Sierra Nevada. Much of the plateau itself is broken by faults. The Modoc Plateau is drained by the Pit River. The surficial geology in Lassen County reflects the geologic provinces. At the southern edge of the County, igneous and metamorphic rocks are present, indicating the Sierra Nevada province. The southeastern portion of the county has linear valleys and ridges correlated with the Basin and Range province. In the north and western portions of the County, volcanic rock is present at the surface, corresponding with the Cascade Range and Modoc Plateau provinces. The surficial extents of geologic formations are shown in a composite geologic map of Lassen County (Figure 2-10). The bulk of the mapping shown in Figure 2-10 was conducted in 1958 and Recent geologic mapping efforts and volcanism studies such as those done by Grose in 2000 are more recent studies but do not provide countywide coverage. 2.5 Groundwater Basins There are 24 groundwater basins in Lassen County. This GWMP identifies four priority groundwater basins; Big Valley, Willow Creek Valley, Long Valley, and Honey Lake Valley. Priority basins were identified from stakeholder input, land use, water source patterns, and existing groundwater well infrastructure. The majority of groundwater monitoring also occurs in the priority basins. Less information is available for the other groundwater basins in Lassen County. As part of the development of the GWMP, an inventory of available information was conducted for Lassen County groundwater basins. Groundwater basins in Lassen County are shown in Figure In general, significant information is available for Big Valley, Willow Creek Valley, Long Valley, and Honey Lake Valley, and less information is available for the other groundwater basins. Newer information is available for Honey Lake Valley and Long Valley. For example, a geophysical study was completed by NGA in 2004 to determine the depth to bedrock of the narrows separating upper and lower Long Valley. Most information about groundwater basins in Lassen County is based on research conducted by DWR in Bulletin No. 98 Northeastern Counties Ground Water Investigation in Photo 2-3. Much of Lassen County s Landscape is shaped by past volcanic activity. 2-13
The Climate of Oregon Climate Zone 4 Northern Cascades
 /05 E55 Unbound issue No. 9/ is Does not circulate Special Report 916 May 1993 The Climate of Oregon Climate Zone 4 Property of OREGON STATE UNIVERSITY Library Serials Corvallis, OR 97331-4503 Agricultural
Monthly Long Range Weather Commentary Issued: February 15, 2015 Steven A. Root, CCM, President/CEO
 Monthly Long Range Weather Commentary Issued: February 15, 2015 Steven A. Root, CCM, President/CEO sroot@weatherbank.com JANUARY 2015 Climate Highlights The Month in Review During January, the average
2015 Fall Conditions Report
 2015 Fall Conditions Report Prepared by: Hydrologic Forecast Centre Date: December 21 st, 2015 Table of Contents Table of Figures... ii EXECUTIVE SUMMARY... 1 BACKGROUND... 2 SUMMER AND FALL PRECIPITATION...
Sierra Weather and Climate Update
 Sierra Weather and Climate Update 2014-15 Kelly Redmond Western Regional Climate Center Desert Research Institute Reno Nevada Yosemite Hydroclimate Workshop Yosemite Valley, 2015 October 8-9 Percent of
Stream Discharge and the Water Budget
 Regents Earth Science Unit 6: Water Cycle & Climate Name: Lab # Stream Discharge and the Water Budget Introduction: The United States Geological Survey (USGS) measures and publishes values for the daily
January 25, Summary
 January 25, 2013 Summary Precipitation since the December 17, 2012, Drought Update has been slightly below average in parts of central and northern Illinois and above average in southern Illinois. Soil
REDWOOD VALLEY SUBAREA
 Independent Science Review Panel Conceptual Model of Watershed Hydrology, Surface Water and Groundwater Interactions and Stream Ecology for the Russian River Watershed Appendices A-1 APPENDIX A A-2 REDWOOD
Weather and Climate of the Rogue Valley By Gregory V. Jones, Ph.D., Southern Oregon University
 Weather and Climate of the Rogue Valley By Gregory V. Jones, Ph.D., Southern Oregon University The Rogue Valley region is one of many intermountain valley areas along the west coast of the United States.
The Climate of Payne County
 The Climate of Payne County Payne County is part of the Central Great Plains in the west, encompassing some of the best agricultural land in Oklahoma. Payne County is also part of the Crosstimbers in the
WHEN IS IT EVER GOING TO RAIN? Table of Average Annual Rainfall and Rainfall For Selected Arizona Cities
 WHEN IS IT EVER GOING TO RAIN? Table of Average Annual Rainfall and 2001-2002 Rainfall For Selected Arizona Cities Phoenix Tucson Flagstaff Avg. 2001-2002 Avg. 2001-2002 Avg. 2001-2002 October 0.7 0.0
The Climate of Oregon Climate Zone 3 Southwest Interior
 .k) 105 Unbound issue " " 1 4oes not circulate C4P. Special Report 915 May 1993 The Climate of Oregon Climate Zone 3 Southwest Interior Property of OREGON STATE UNIVERSITY Library Serials Corvallis, OR
A Review of the 2007 Water Year in Colorado
 A Review of the 2007 Water Year in Colorado Nolan Doesken Colorado Climate Center, CSU Mike Gillespie Snow Survey Division, USDA, NRCS Presented at the 28 th Annual AGU Hydrology Days, March 26, 2008,
Chiang Rai Province CC Threat overview AAS1109 Mekong ARCC
 Chiang Rai Province CC Threat overview AAS1109 Mekong ARCC This threat overview relies on projections of future climate change in the Mekong Basin for the period 2045-2069 compared to a baseline of 1980-2005.
Highlights of the 2006 Water Year in Colorado
 Highlights of the 2006 Water Year in Colorado Nolan Doesken, State Climatologist Atmospheric Science Department Colorado State University http://ccc.atmos.colostate.edu Presented to 61 st Annual Meeting
Minnesota s Climatic Conditions, Outlook, and Impacts on Agriculture. Today. 1. The weather and climate of 2017 to date
 Minnesota s Climatic Conditions, Outlook, and Impacts on Agriculture Kenny Blumenfeld, State Climatology Office Crop Insurance Conference, Sep 13, 2017 Today 1. The weather and climate of 2017 to date
The Climate of Marshall County
 The Climate of Marshall County Marshall County is part of the Crosstimbers. This region is a transition region from the Central Great Plains to the more irregular terrain of southeastern Oklahoma. Average
The Climate of Seminole County
 The Climate of Seminole County Seminole County is part of the Crosstimbers. This region is a transition region from the Central Great Plains to the more irregular terrain of southeastern Oklahoma. Average
The Climate of Kiowa County
 The Climate of Kiowa County Kiowa County is part of the Central Great Plains, encompassing some of the best agricultural land in Oklahoma. Average annual precipitation ranges from about 24 inches in northwestern
The Climate of Murray County
 The Climate of Murray County Murray County is part of the Crosstimbers. This region is a transition between prairies and the mountains of southeastern Oklahoma. Average annual precipitation ranges from
Monthly Long Range Weather Commentary Issued: APRIL 18, 2017 Steven A. Root, CCM, Chief Analytics Officer, Sr. VP,
 Monthly Long Range Weather Commentary Issued: APRIL 18, 2017 Steven A. Root, CCM, Chief Analytics Officer, Sr. VP, sroot@weatherbank.com MARCH 2017 Climate Highlights The Month in Review The average contiguous
Climate Change and Water Supply Research. Drought Response Workshop October 8, 2013
 Climate Change and Water Supply Research Drought Response Workshop October 8, 2013 DWR Photo Oroville Reservoir, 2009 Talk Overview Expectations History Atmospheric Rivers and Water Supply Current Research
PRELIMINARY DRAFT FOR DISCUSSION PURPOSES
 Memorandum To: David Thompson From: John Haapala CC: Dan McDonald Bob Montgomery Date: February 24, 2003 File #: 1003551 Re: Lake Wenatchee Historic Water Levels, Operation Model, and Flood Operation This
The Climate of Haskell County
 The Climate of Haskell County Haskell County is part of the Hardwood Forest. The Hardwood Forest is characterized by its irregular landscape and the largest lake in Oklahoma, Lake Eufaula. Average annual
The elevations on the interior plateau generally vary between 300 and 650 meters with
 11 2. HYDROLOGICAL SETTING 2.1 Physical Features and Relief Labrador is bounded in the east by the Labrador Sea (Atlantic Ocean), in the west by the watershed divide, and in the south, for the most part,
Description DESCRIPTION
 DESCRIPTION The location of the Upper James Watershed is located in northeastern South Dakota as well as southeastern North Dakota. It includes the following counties located in North Dakota Barnes, Dickey,
The Climate of Texas County
 The Climate of Texas County Texas County is part of the Western High Plains in the north and west and the Southwestern Tablelands in the east. The Western High Plains are characterized by abundant cropland
Monthly Long Range Weather Commentary Issued: APRIL 1, 2015 Steven A. Root, CCM, President/CEO
 Monthly Long Range Weather Commentary Issued: APRIL 1, 2015 Steven A. Root, CCM, President/CEO sroot@weatherbank.com FEBRUARY 2015 Climate Highlights The Month in Review The February contiguous U.S. temperature
Upper Missouri River Basin February 2018 Calendar Year Runoff Forecast February 6, 2018
 Upper Missouri River Basin February 2018 Calendar Year Runoff Forecast February 6, 2018 Calendar Year Runoff Forecast Explanation and Purpose of Forecast U.S. Army Corps of Engineers, Northwestern Division
Drought in Southeast Colorado
 Drought in Southeast Colorado Nolan Doesken and Roger Pielke, Sr. Colorado Climate Center Prepared by Tara Green and Odie Bliss http://climate.atmos.colostate.edu 1 Historical Perspective on Drought Tourism
2003 Water Year Wrap-Up and Look Ahead
 2003 Water Year Wrap-Up and Look Ahead Nolan Doesken Colorado Climate Center Prepared by Odie Bliss http://ccc.atmos.colostate.edu Colorado Average Annual Precipitation Map South Platte Average Precipitation
The Climate of Bryan County
 The Climate of Bryan County Bryan County is part of the Crosstimbers throughout most of the county. The extreme eastern portions of Bryan County are part of the Cypress Swamp and Forest. Average annual
The Climate of Grady County
 The Climate of Grady County Grady County is part of the Central Great Plains, encompassing some of the best agricultural land in Oklahoma. Average annual precipitation ranges from about 33 inches in northern
Champaign-Urbana 1998 Annual Weather Summary
 Champaign-Urbana 1998 Annual Weather Summary ILLINOIS STATE WATER SURVEY Audrey Bryan, Weather Observer 2204 Griffith Dr. Champaign, IL 61820 wxobsrvr@sparc.sws.uiuc.edu The development of the El Nìno
Disentangling Impacts of Climate & Land Use Changes on the Quantity & Quality of River Flows in Southern Ontario
 Disentangling Impacts of Climate & Land Use Changes on the Quantity & Quality of River Flows in Southern Ontario by Trevor Dickinson & Ramesh Rudra, Water Resources Engineering University of Guelph Acknowledgements
1.0 Introduction 1.1 Geographic Location 1.2 Topography 1.3 Climate and Rainfall 1.4 Geology and Hydrogeology 1.5 Water Availability 1.
 1.0 1.1 Geographic Location 1.2 Topography 1.3 Climate and Rainfall 1.4 Geology and Hydrogeology 1.5 Water Availability 1.6 Demography 1.0 1.1 Geographic Location St. Lucia forms part of an archipelago
2.5.3 Willow Creek Valley
 2.5.3 Willow Creek Valley Identified as a priority groundwater basin based on stakeholder input, land use, water source patterns, and existing groundwater well infrastructure, Willow Creek Valley is in
Jackson County 2013 Weather Data
 Jackson County 2013 Weather Data 61 Years of Weather Data Recorded at the UF/IFAS Marianna North Florida Research and Education Center Doug Mayo Jackson County Extension Director 1952-2008 Rainfall Data
Changing Hydrology under a Changing Climate for a Coastal Plain Watershed
 Changing Hydrology under a Changing Climate for a Coastal Plain Watershed David Bosch USDA-ARS, Tifton, GA Jeff Arnold ARS Temple, TX and Peter Allen Baylor University, TX SEWRU Objectives 1. Project changes
The Climate of Oregon Climate Zone 5 High Plateau
 105 E55 Unbound issue i". 9 13oes not circulate CZe Special Report 917 May 1993 The Climate of Oregon Climate Zone 5 Property of OREGON STATE UNIVERSITY Library Serials Corvallis, OR 97331-4503 Agricultural
Weather History on the Bishop Paiute Reservation
 Weather History on the Bishop Paiute Reservation -211 For additional information contact Toni Richards, Air Quality Specialist 76 873 784 toni.richards@bishoppaiute.org Updated 2//214 3:14 PM Weather History
The Climate of Pontotoc County
 The Climate of Pontotoc County Pontotoc County is part of the Crosstimbers. This region is a transition region from the Central Great Plains to the more irregular terrain of southeast Oklahoma. Average
The Colorado Drought of 2002 in Perspective
 The Colorado Drought of 2002 in Perspective Colorado Climate Center Nolan Doesken and Roger Pielke, Sr. Prepared by Tara Green and Odie Bliss http://climate.atmos.colostate.edu Known Characteristics of
Champaign-Urbana 2001 Annual Weather Summary
 Champaign-Urbana 2001 Annual Weather Summary ILLINOIS STATE WATER SURVEY 2204 Griffith Dr. Champaign, IL 61820 wxobsrvr@sws.uiuc.edu Maria Peters, Weather Observer January: After a cold and snowy December,
Climate. Annual Temperature (Last 30 Years) January Temperature. July Temperature. Average Precipitation (Last 30 Years)
 January Temperature. July Temperature. Average Precipitation (Last 30 Years)") Climate Annual Temperature (Last 30 Years) Average Annual High Temp. (F)70, (C)21 Average Annual Low Temp. (F)43, (C)6 January Temperature Average January High Temp. (F)48, (C)9 Average January Low Temp.
Climate Annual Temperature (Last 30 Years) Average Annual High Temp. (F)70, (C)21 Average Annual Low Temp. (F)43, (C)6 January Temperature Average January High Temp. (F)48, (C)9 Average January Low Temp.
SEPTEMBER 2013 REVIEW
 Monthly Long Range Weather Commentary Issued: October 21, 2013 Steven A. Root, CCM, President/CEO sroot@weatherbank.com SEPTEMBER 2013 REVIEW Climate Highlights The Month in Review The average temperature
Monthly Long Range Weather Commentary Issued: APRIL 25, 2016 Steven A. Root, CCM, Chief Analytics Officer, Sr. VP, sales
 Monthly Long Range Weather Commentary Issued: APRIL 25, 2016 Steven A. Root, CCM, Chief Analytics Officer, Sr. VP, sales sroot@weatherbank.com MARCH 2016 Climate Highlights The Month in Review The March
Champaign-Urbana 2000 Annual Weather Summary
 Champaign-Urbana 2000 Annual Weather Summary ILLINOIS STATE WATER SURVEY 2204 Griffith Dr. Champaign, IL 61820 wxobsrvr@sws.uiuc.edu Maria Peters, Weather Observer January: January started on a mild note,
Current Climate Trends and Implications
 Current Climate Trends and Implications Dr. Mark Seeley Professor emeritus Department of Soil, Water, and Climate University of Minnesota St Paul, MN 55108 Crop Insurance Conference September 12, 2018
Climate also has a large influence on how local ecosystems have evolved and how we interact with them.
 The Mississippi River in a Changing Climate By Paul Lehman, P.Eng., General Manager Mississippi Valley Conservation (This article originally appeared in the Mississippi Lakes Association s 212 Mississippi
Colorado s 2003 Moisture Outlook
 Colorado s 2003 Moisture Outlook Nolan Doesken and Roger Pielke, Sr. Colorado Climate Center Prepared by Tara Green and Odie Bliss http://climate.atmos.colostate.edu How we got into this drought! Fort
Weather and Climate Summary and Forecast Winter
 Weather and Climate Summary and Forecast Winter 2016-17 Gregory V. Jones Southern Oregon University February 7, 2017 What a difference from last year at this time. Temperatures in January and February
A Report on a Statistical Model to Forecast Seasonal Inflows to Cowichan Lake
 A Report on a Statistical Model to Forecast Seasonal Inflows to Cowichan Lake Prepared by: Allan Chapman, MSc, PGeo Hydrologist, Chapman Geoscience Ltd., and Former Head, BC River Forecast Centre Victoria
What Does It Take to Get Out of Drought?
 What Does It Take to Get Out of Drought? Nolan J. Doesken Colorado Climate Center Colorado State University http://ccc.atmos.colostate.edu Presented at the Insects, Diseases and Drought Workshop, May 19,
Lake Tahoe Watershed Model. Lessons Learned through the Model Development Process
 Lake Tahoe Watershed Model Lessons Learned through the Model Development Process Presentation Outline Discussion of Project Objectives Model Configuration/Special Considerations Data and Research Integration
Montana Drought & Climate
 Montana Drought & Climate MARCH 219 MONITORING AND FORECASTING FOR AGRICULTURE PRODUCERS A SERVICE OF THE MONTANA CLIMATE OFFICE IN THIS ISSUE IN BRIEF PAGE 2 REFERENCE In a Word PAGE 3 REVIEW Winter 219:
Climate Variability. Eric Salathé. Climate Impacts Group & Department of Atmospheric Sciences University of Washington. Thanks to Nathan Mantua
 Climate Variability Eric Salathé Climate Impacts Group & Department of Atmospheric Sciences University of Washington Thanks to Nathan Mantua Northwest Climate: the mean Factors that influence local/regional
Missouri River Basin Water Management
 Missouri River Basin Water Management US Army Corps of Engineers Missouri River Navigator s Meeting February 12, 2014 Bill Doan, P.E. Missouri River Basin Water Management US Army Corps of Engineers BUILDING
Missouri River Basin Water Management Monthly Update
 Missouri River Basin Water Management Monthly Update Participating Agencies 255 255 255 237 237 237 0 0 0 217 217 217 163 163 163 200 200 200 131 132 122 239 65 53 80 119 27 National Oceanic and Atmospheric
Rainfall Observations in the Loxahatchee River Watershed
 Rainfall Observations in the Loxahatchee River Watershed Richard C. Dent Loxahatchee River District September 1997 Introduction Rain is a common occurrence in south Florida, yet its presence or absence
Drought Characterization. Examination of Extreme Precipitation Events
 Drought Characterization Examination of Extreme Precipitation Events Extreme Precipitation Events During the Drought For the drought years (1999-2005) daily precipitation data was analyzed to find extreme
3.0 TECHNICAL FEASIBILITY
 3.0 TECHNICAL FEASIBILITY 3.1 INTRODUCTION To enable seasonal storage and release of water from Lake Wenatchee, an impoundment structure would need to be constructed on the lake outlet channel. The structure
Jackson County 2018 Weather Data 67 Years of Weather Data Recorded at the UF/IFAS Marianna North Florida Research and Education Center
 Jackson County 2018 Weather Data 67 Years of Weather Data Recorded at the UF/IFAS Marianna North Florida Research and Education Center Doug Mayo Jackson County Extension Director 1952-2008 Rainfall Data
2003 Moisture Outlook
 2003 Moisture Outlook Nolan Doesken and Roger Pielke, Sr. Colorado Climate Center Prepared by Tara Green and Odie Bliss http://climate.atmos.colostate.edu Through 1999 Through 1999 Fort Collins Total Water
Study of Hydrometeorology in a Hard Rock Terrain, Kadirischist Belt Area, Anantapur District, Andhra Pradesh
 Open Journal of Geology, 2012, 2, 294-300 http://dx.doi.org/10.4236/ojg.2012.24028 Published Online October 2012 (http://www.scirp.org/journal/ojg) Study of Hydrometeorology in a Hard Rock Terrain, Kadirischist
Variability of Reference Evapotranspiration Across Nebraska
 Know how. Know now. EC733 Variability of Reference Evapotranspiration Across Nebraska Suat Irmak, Extension Soil and Water Resources and Irrigation Specialist Kari E. Skaggs, Research Associate, Biological
Arizona Climate Summary February 2012
 Arizona Climate Summary February 2012 Summary of conditions for January 2012 January 2012 Temperature and Precipitation Summary January 1 st 20 th : The New Year has started on a very dry note. The La
Upper Owyhee Watershed Assessment
 * Owyhee Watershed Council and Scientific Ecological Services The upper Owyhee subbasin is located in parts of three states: the southeastern corner of Oregon, the southwestern corner of Idaho, and north
3.3 CLIMATE, GEOLOGY, TOPOGRAPHY, AND SOILS CLIMATE GEOLOGY TOPOGRAPHY
 3.3 CLIMATE, GEOLOGY, TOPOGRAPHY, AND SOILS This section describes the climate, geology, topography, and soil resource characteristics of the Yolo Bypass Wildlife Area (Wildlife Area). Agricultural soil
CAMARGO RANCH, llc. CRAIG BUFORD BufordResources.com
 CAMARGO RANCH, llc 2897 +/- acre Wheat & Cattle Farm Mangum, greer county, oklahoma CRAIG BUFORD 405-833-9499 BufordResources.com 4101 Perimeter Center Dr., Suite 107 Oklahoma City, OK 73112 405.833.9499
Funding provided by NOAA Sectoral Applications Research Project CLIMATE. Basic Climatology Colorado Climate Center
 Funding provided by NOAA Sectoral Applications Research Project CLIMATE Basic Climatology Colorado Climate Center Remember These? Factor 1: Our Energy Source Factor 2: Revolution & Tilt Factor 3: Rotation!
Lower Tuolumne River Accretion (La Grange to Modesto) Estimated daily flows ( ) for the Operations Model Don Pedro Project Relicensing
 Estimated daily flows ( ) for the Operations Model Don Pedro Project Relicensing") Lower Tuolumne River Accretion (La Grange to Modesto) Estimated daily flows (1970-2010) for the Operations Model Don Pedro Project Relicensing 1.0 Objective Using available data, develop a daily time series
Lower Tuolumne River Accretion (La Grange to Modesto) Estimated daily flows (1970-2010) for the Operations Model Don Pedro Project Relicensing 1.0 Objective Using available data, develop a daily time series
A Recap of Colorado s Water Year 2018
 A Recap of Colorado s Water Year 2018 For further inquiries, please contact: Russ Schumacher, State Climatologist (970) 491-8084 Becky Bolinger, Assistant State Climatologist (970) 491-8506 Peter Goble,
May 2016 Volume 23 Number 5
 The Weather Wire May 2016 Volume 23 Number 5 Contents: Winter Summary Current Colorado and West-wide Snow Pack Drought Monitor April Summary/Statistics May Preview Snowfall Totals Winter Summary The Front
The following information is provided for your use in describing climate and water supply conditions in the West as of April 1, 2003.
 Natural Resources Conservation Service National Water and Climate Center 101 SW Main Street, Suite 1600 Portland, OR 97204-3224 Date: April 8, 2003 Subject: April 1, 2003 Western Snowpack Conditions and
Meteorology. Circle the letter that corresponds to the correct answer
 Chapter 3 Worksheet 1 Meteorology Name: Circle the letter that corresponds to the correct answer 1) If the maximum temperature for a particular day is 26 C and the minimum temperature is 14 C, the daily
Preliminary Runoff Outlook February 2018
 Preliminary Runoff Outlook February 2018 Prepared by: Flow Forecasting & Operations Planning Water Security Agency General Overview The Water Security Agency (WSA) is preparing for 2018 spring runoff including
March 1, 2003 Western Snowpack Conditions and Water Supply Forecasts
 Natural Resources Conservation Service National Water and Climate Center 101 SW Main Street, Suite 1600 Portland, OR 97204-3224 Date: March 17, 2003 Subject: March 1, 2003 Western Snowpack Conditions and
Webinar and Weekly Summary February 15th, 2011
 Webinar and Weekly Summary February 15th, 2011 -Assessment of current water conditions - Precipitation Forecast - Recommendations for Drought Monitor Upper Colorado Normal Precipitation Upper Colorado
ACCUMULATED PRECIPITATION IN INCHES
 CUMULATIVE PRECIPITATION WATER YEAR COLUMBIA BASIN ABOVE GRAND COULEE 84% of Normal 1971- Average ACCUMULATED PRECIPITATION IN INCHES 8 6 82% of Normal 85% of Normal 82% of Normal SNAKE RIVER BASIN ABOVE
Third Grade Math and Science DBQ Weather and Climate/Representing and Interpreting Charts and Data
 Third Grade Math and Science DBQ Weather and Climate/Representing and Interpreting Charts and Data A document based question (DBQ) is an authentic assessment where students interact with content related
Champaign-Urbana 1999 Annual Weather Summary
 Champaign-Urbana 1999 Annual Weather Summary ILLINOIS STATE WATER SURVEY 2204 Griffith Dr. Champaign, IL 61820 wxobsrvr@sws.uiuc.edu Maria Peters, Weather Observer A major snowstorm kicked off the new
Monthly Long Range Weather Commentary Issued: NOVEMBER 16, 2015 Steven A. Root, CCM, Chief Analytics Officer, Sr. VP, sales
 Monthly Long Range Weather Commentary Issued: NOVEMBER 16, 2015 Steven A. Root, CCM, Chief Analytics Officer, Sr. VP, sales sroot@weatherbank.com OCTOBER 2015 Climate Highlights The Month in Review The
Geostatistical Analysis of Rainfall Temperature and Evaporation Data of Owerri for Ten Years
 Atmospheric and Climate Sciences, 2012, 2, 196-205 http://dx.doi.org/10.4236/acs.2012.22020 Published Online April 2012 (http://www.scirp.org/journal/acs) Geostatistical Analysis of Rainfall Temperature
1.Introduction 2.Relocation Information 3.Tourism 4.Population & Demographics 5.Education 6.Employment & Income 7.City Fees & Taxes 8.
 1.Introduction 2.Relocation Information 3.Tourism 4.Population & Demographics 5.Education 6.Employment & Income 7.City Fees & Taxes 8.Recreation & Activities 9.Climate Data 10.Economic Development History
Jackson County 2014 Weather Data
 Jackson County 2014 Weather Data 62 Years of Weather Data Recorded at the UF/IFAS Marianna North Florida Research and Education Center Doug Mayo Jackson County Extension Director 1952-2008 Rainfall Data
National Integrated Drought Information System. Southeast US Pilot for Apalachicola- Flint-Chattahoochee River Basin 20-March-2012
 National Integrated Drought Information System Southeast US Pilot for Apalachicola- Flint-Chattahoochee River Basin 20-March-2012 Current drought status from Drought Monitor http://www.drought.unl.edu/dm/monitor.html
Memo. I. Executive Summary. II. ALERT Data Source. III. General System-Wide Reporting Summary. Date: January 26, 2009 To: From: Subject:
 Memo Date: January 26, 2009 To: From: Subject: Kevin Stewart Markus Ritsch 2010 Annual Legacy ALERT Data Analysis Summary Report I. Executive Summary The Urban Drainage and Flood Control District (District)
National Wildland Significant Fire Potential Outlook
 National Wildland Significant Fire Potential Outlook National Interagency Fire Center Predictive Services Issued: September, 2007 Wildland Fire Outlook September through December 2007 Significant fire
HAIDA GWAII CLIMATE ASSESSMENT 2010 Special Report for MIEDS Franc Pridoehl
 HAIDA GWAII CLIMATE ASSESSMENT 2010 Special Report for MIEDS Franc Pridoehl INTRODUCTION Climatic conditions have varied considerably on Haida Gwaii over the past centuries and millennia (Hebda 2007).
Looking for Recent Climatic Trends and Patterns in California s Central Sierra
 Looking for Recent Climatic Trends and Patterns in California s Central Sierra Looking for Recent Climatic Trends and Patterns in California s Central Sierra Gary J. Freeman Introduction Pacific Gas &
ZUMWALT WEATHER AND CLIMATE ANNUAL REPORT ( )
") ZUMWALT WEATHER AND CLIMATE ANNUAL REPORT (26-29) FINAL DRAFT (9 AUGUST 21) J.D. HANSEN 1, R.V. TAYLOR 2, AND V.S. JANSEN 3 INTRODUCTION The Zumwalt Prairie in northeastern Oregon is a unique grassland
ZUMWALT WEATHER AND CLIMATE ANNUAL REPORT (26-29) FINAL DRAFT (9 AUGUST 21) J.D. HANSEN 1, R.V. TAYLOR 2, AND V.S. JANSEN 3 INTRODUCTION The Zumwalt Prairie in northeastern Oregon is a unique grassland
Summary report for Ruamāhanga Whaitua Committee The climate of the Ruamāhanga catchment
 Summary report for Ruamāhanga Whaitua Committee The climate of the Ruamāhanga catchment The Tararua and Rimutaka ranges have a large influence on the climate of the Ruamāhanga catchment. The ranges shelter
Ontonagon River Assessment FIGURES
 FIGURES 95 Major Streams and Lakes 1 Pelton Creek 36 Imp Creek 2 Slate River 37 Imp Lake 3 Marshall Creek 38 Marion Lake 4 Trout Brook 39 Tamarack Lake 5 Lake Gogebic 40 Tamarack River 6 West Branch Ontonagon
The Colorado Drought : 2003: A Growing Concern. Roger Pielke, Sr. Colorado Climate Center.
 The Colorado Drought 2001-2003: 2003: A Growing Concern Roger Pielke, Sr. Colorado Climate Center Prepared by Tara Green and Odie Bliss http://climate.atmos.colostate.edu 2 2002 Drought History in Colorado
Arizona Climate Summary April 2018 Summary of conditions for March 2018
 Arizona Climate Summary April 2018 Summary of conditions for March 2018 March 2018 Temperature and Precipitation Summary March 1 st 16 th : March began with rainfall in southeastern Arizona as the tail
Hydrologic Conditions in the Delaware River Basin
 2017 Hydrologic Conditions in the Delaware River Basin Prepared by Operations Staff June 2018 Hydrologic Highlights Hydrologic Conditions in the Delaware River Basin Annual Report 2017 At the start of
MONITORING THE EFFECTS OF CLIMATE CHANGE ON SPRINGS, SEEPS AND OTHER WATER NATIONAL PRESERVE
 MONITORING THE EFFECTS OF CLIMATE CHANGE ON SPRINGS, SEEPS AND OTHER WATER RESOURCES IN THE MOJAVE NATIONAL PRESERVE Boris Poff and Debra Hughson Mojave National Preserve, California CLIMATE CHANGE Predictions
San Francisco Public Utilities Commission Hydrological Conditions Report For March 2016
 San Francisco Public Utilities Commission Hydrological Conditions Report For March 2016 J. Chester, C. Graham, A. Mazurkiewicz, & M. Tsang, April 7, 2016 Snow Surveyor Chris Graham crossing Huckleberry
Presentation Overview. Southwestern Climate: Past, present and future. Global Energy Balance. What is climate?
 Southwestern Climate: Past, present and future Mike Crimmins Climate Science Extension Specialist Dept. of Soil, Water, & Env. Science & Arizona Cooperative Extension The University of Arizona Presentation
Arizona Climate Summary October 2013
 Arizona Climate Summary October 2013 Summary of conditions for September 2013 September 2013 Temperature and Precipitation Summary September 1 st 16 th : With moist conditions still present throughout