Science Standard 1: Students analyze monthly precipitation and temperature records, displayed in bar charts, collected in metric units (mm).
|
|
|
- Cornelius Powers
- 6 years ago
- Views:
Transcription

1 Title: Precipitation Patterns across the Globe NSF GK-12 Fellow: Terry Legg Type of Lesson: STEM Grade Level(s): 4 th - 7 th grade This activity can be tailored to older, more advanced students by having the students make their own bar charts of the monthly precipitation and temperature data, instead of providing them with bar charts. Objectives: The students will apply their knowledge of the water cycle to investigate how annual precipitation patterns are related to geography and biology. Students will guess the location in the world that is associated with the precipitation/temperature records and demarcate the location on a world map. Students will also make predictions as to the type of ecosystem, as well as the types of plants and animals, associated with the precipitation/temperature records. Boulder Valley School District Essential Learning(s), 4 th grade: Science Standard 1: Students analyze monthly precipitation and temperature records, displayed in bar charts, collected in metric units (mm). Science Standard 3: Students predict the types of plants and animals that live in a location based on the precipitation received by that location over the course of a year. Science Standard 4: Students review the different phases of water in the water cycle, and they use precipitation records to discern which forms of precipitation locations received at different times of year. Background Information: The Water Cycle There are 5 main processes involved in the water cycle: precipitation, condensation, evaporation/transpiration, surface runoff and accumulation/storage. The figure below illustrates these main processes. Page 1

2 Precipitation Precipitation describes the different forms of water that originate in the atmosphere and fall onto land and water surfaces. Forms of precipitation include rain, hail, snow, sleet, and graupel. However, for the purposes of this lesson we will focus on rain and snow. Measuring Precipitation Precipitation is measured with a rain gauge. Rain gauges measure all types of precipitation even though it called a rain gauge. Precipitation is collected in the rain gauge, and the amount of precipitation received within the collection period (usually 1 day) is read in the measuring tube. In the United States precipitation is recorded in inches of rain. For more information on rain gauges and collecting precipitation data please visit the following website: Precipitation records are useful for many different people. Scientists called climatologists use precipitation records to study the climate history of regions throughout the world, and to evaluate the likelihood of changes in precipitation patterns such as periods of drought or flood. Scientists called hydrologists use precipitation records to estimate the amount of water that is stored in reservoirs, lakes and groundwater. Governments rely on the hydrologist s water storage estimates for regulating water use in their municipality. Farmers use precipitation records to decide when they should plant specific crops, or how much water they will need for irrigating their crops. Precipitation data is reported over a variety of time scales. The most common time scales used for reporting are daily, monthly and annual precipitation. Whereas some precipitation data collection differentiates between the type of precipitation received on the date of collection (rain, snow, hail, etc.) other records only report the amount of total precipitation received. In this activity, we will be analyzing total monthly precipitation records that do not differentiate between the different forms of precipitation received. However, using the average monthly temperature data students will be able to guess the type of precipitation the location received during each month. Page 2
3 References: Lesson Vocabulary: Water Cycle, Precipitation, Condensation, Evaporation, Transpiration, Surface Runoff, Storage, Rain gauge. Materials Required: 1. Monthly Precipitation and Temperature Records for 4-6 different locations. These can be downloaded at Alternatively you could use the records for the 6 locations (Boulder, CO; Seattle, WA; Death Valley, CA; Dhaka, Bangladesh; Manaus, Brazil (Amazon Rainforest); McMurdo Station, Antarctica) included at the end of this lesson plan. 2. A world map for each student, or student group, to write on. 3. A copy of the questions that students will answer during the activity (included in the lesson plan). Preparation: Print copies of the world map, the handout of the questions for the students to answer, and the precipitation and temperature record bar charts for each student or student group. Safety Information: There is no safety information needed for this activity. Engagement: Begin the lesson by posing the question, did you experience any parts of the water cycle with your senses (see, touch, smell, taste, or hear) today? After a short discussion of this, you can play the following video to remind the students of the important components of the water cycle: After watching the video, have students draw the water cycle in their science notebooks. Allow students to check their work by showing them a diagram of the water cycle. Ask students to point to precipitation in their water cycle drawing. Then pose the question, Is there only one type of precipitation? Then ask students to raise their hands and mention all of the different kinds of precipitation, and whether the form of precipitation occurs during warm or cold weather. Page 3
4 Next, tell the students that today they are going to do an investigation of precipitation patterns across the globe, over the course of an entire year! Exploration: Each student or group of students should receive: 1. A world map. 2. A copy of each of the bar charts for the monthly precipitation and temperature records over the course of a year for each location (my version of the bar charts is included at the end of the lesson plan). Make sure that the location for each record is not included on the bar chart since the main goal of the activity is for the students to guess these locations. 3. A copy of the questions they will answer as a part of this activity. The following is a list of the questions, and a sample data sheet is included at the end of this packet: 1. What type of ecosystem belongs to each precipitation/temperature record? (examples- desert, coast, mountain, rainforest) Record 1- Record 2- Record 3- Record 4- Record 5- Record 6-2. What types of plants and animals do you think live in this ecosystem? Record 1- Record 2- Record 3- Record 4- Record 5- Record 6- Page 4
5 4. Where in the world do you think each precipitation/temperature record belongs? Mark the location on your world map. Ask the students to look at each pair of precipitation and temperature records. Explain that they will be using these graphs to answer the above questions. Make sure you point out that the scale on the y axis (precipitation) varies from graph to graph. Some locations may be located in the northern hemisphere and others in the southern hemisphere. Post the question, What type of information might tell you if the location is in the northern hemisphere or the southern hemisphere? Remind students that precipitation and temperature information tells them about the seasons, and what time of year certain seasons occur, and about the overall climate of a location (i.e., rainy or dry). Give students minutes to answer the questions and mark the locations on the world map. Explanation: Ask a few students or student groups to volunteer their answers for one of the precipitation/temperature records. Then display the locations for each of the records, and discuss why the location makes sense due to the precipitation/temperature data (i.e. for Death Valley, CA it is very dry and hot). Also discuss the types of plants and animals that may live in the location, and the adaptations the plants and animals might have to their environment. Extension: A good extension of this lesson would be for students to create a poster that incorporates the precipitation/temperature information with the ecosystem traits they described for one of the locations. If time and resources allow, students could select a new location in which they are interested, and conduct research on the average monthly precipitation and temperature in that location. Students could also research the environmental characteristics of that location. Then, the students could create a poster that incorporates all of the information they found during their research. Evaluation: An immediate evaluation of the students understanding would be 1) their answers on the handout for the lesson, and 2) the accuracy of the poster they created during the extension. Also, the day after the lesson is completed, show the students a picture of an environment. Then ask the students to write a short paragraph in their science notebook Page 5
6 describing the type of precipitation and temperature that location receives, and the types of adaptations the plants and animals have for that location. Wrap-up: Discuss, why is precipitation important for people and other living things? Page 6
7 HANDOUT Name: Annual Precipitation Questions 1. What type of environment belongs to the precipitation record? (examples- desert, coast, mountains, rainforest) 2. What types of plants and animals do you think live in this environment? 3. Where in the world do you think the precipitation record belongs? *Also, Mark the location on your map. Page 7
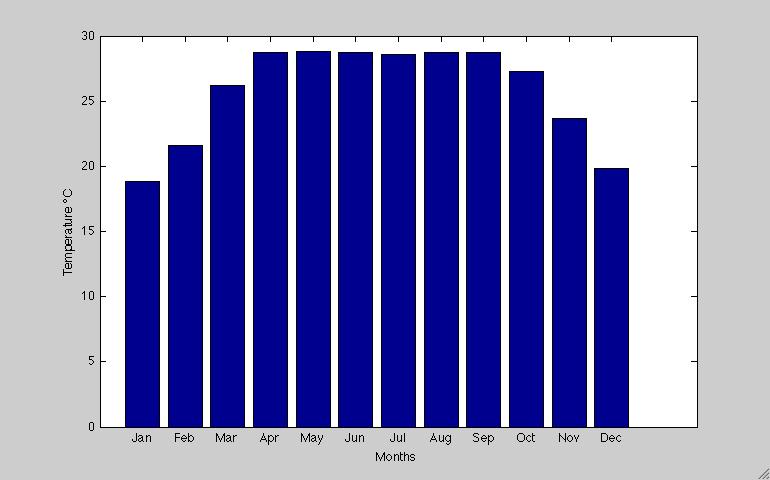
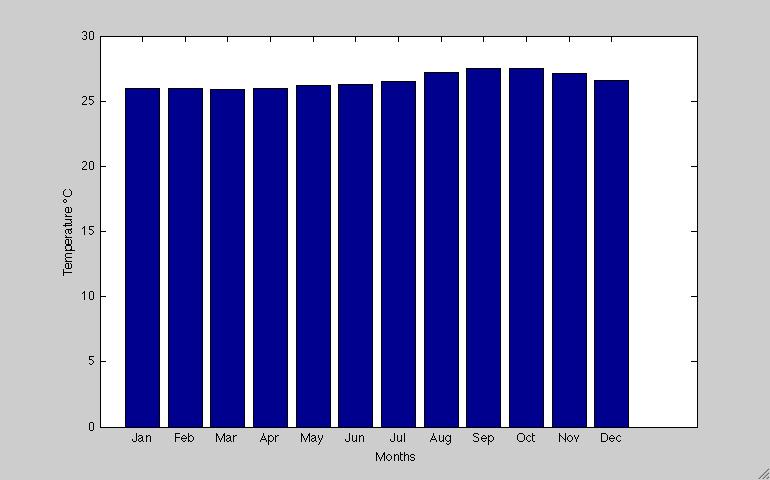
8 MATERIALS- Data and Bar Charts Data Precipitation (mm) Jan Feb Mar Apr May Jun Jul Aug Sep Oct Nov Dec Boulder, Co Seattle, WA Death Valley, CA Dhaka, Bangladesh Manaus, Brazil McMurdo Station, Antarctica Temperature C Jan Feb Mar Apr May Jun Jul Aug Sep Oct Nov Dec Boulder, Co Seattle, WA Death Valley, CA Dhaka, Bangladesh Manaus, Brazil McMurdo Station, Antarctica Page 8

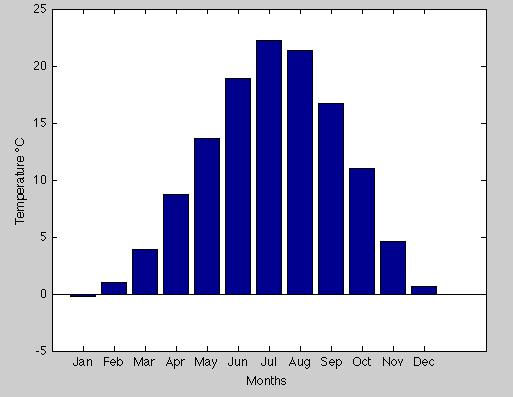
9 Bar Charts Boulder, CO Total Annual Precipitation = 469.6mm Page 9

10 Seattle, WA Total Annual Precipitation = mm Page 10

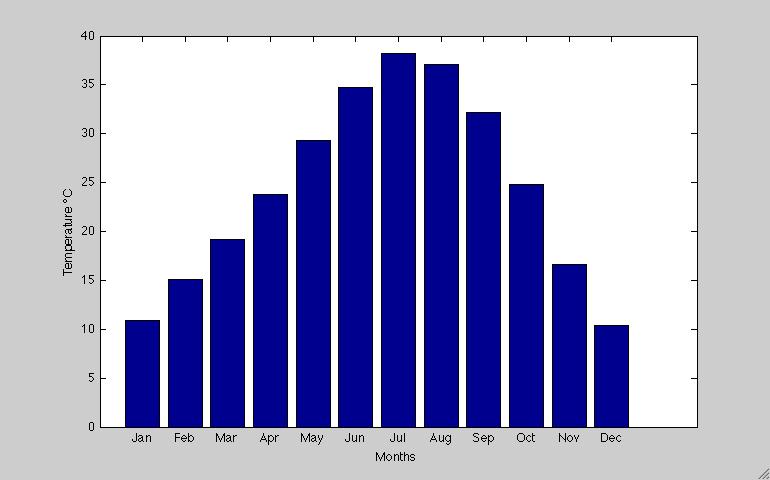
11 Death Valley, CA Total Annual Precipitation = 48mm Page 11

12 Dhaka, Bangladesh Total Annual Precipitation = mm Page 12

13 Manaus, Brazil Total Annual Precipitation = Page 13

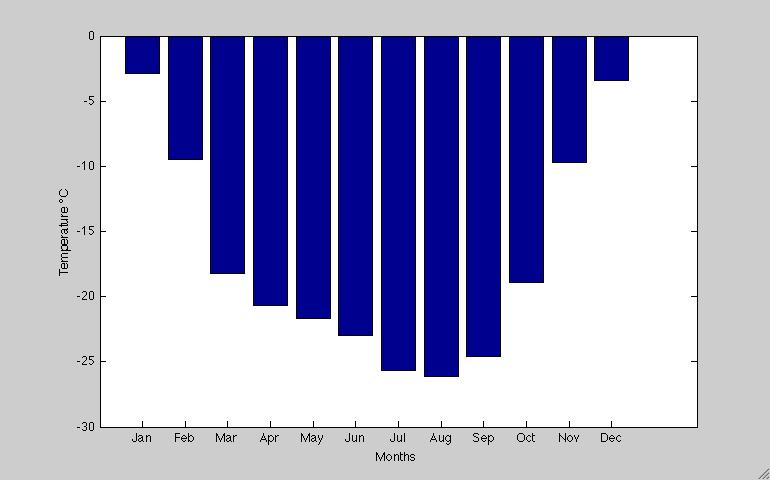
14 McMurdo Station, Antarctica Total Annual Precipitation = 200.9mm Page 14

15 WORLD MAP Page 15
Investigating Factors that Influence Climate
 Investigating Factors that Influence Climate Description In this lesson* students investigate the climate of a particular latitude and longitude in North America by collecting real data from My NASA Data
Climate Change or Climate Variability?
 Climate Change or Climate Variability? Key Concepts: Greenhouse Gas Climate Climate change Climate variability Climate zones Precipitation Temperature Water cycle Weather WHAT YOU WILL LEARN 1. You will
In this activity, students will compare weather data from to determine if there is a warming trend in their community.
 Overview: In this activity, students will compare weather data from 1910-2000 to determine if there is a warming trend in their community. Objectives: The student will: use the Internet to locate scientific
Lesson Adaptation Activity: Analyzing and Interpreting Data
 Lesson Adaptation Activity: Analyzing and Interpreting Data Related MA STE Framework Standard: 3-ESS2-1. Use graphs and tables of local weather data to describe and predict typical weather during a particular
Making a Climograph: GLOBE Data Explorations
 Making a Climograph: A GLOBE Data Exploration Purpose Students learn how to construct and interpret climographs and understand how climate differs from weather. Overview Students calculate and graph maximum
2nd Grade. Earth's Water. Slide 1 / 111 Slide 2 / 111. Slide 3 / 111. Slide 4 / 111. Slide 5 (Answer) / 111. Slide 5 / 111. Role of Water on Earth
 / 111. Slide 5 / 111. Role of Water on Earth") Slide 1 / 111 Slide 2 / 111 2nd Grade Role of Water on Earth 2015-11-20 www.njctl.org Slide 3 / 111 Slide 4 / 111 Table of Contents: The Role of Water on Earth Earth's Water The Use of Maps Click on the
Slide 1 / 111 Slide 2 / 111 2nd Grade Role of Water on Earth 2015-11-20 www.njctl.org Slide 3 / 111 Slide 4 / 111 Table of Contents: The Role of Water on Earth Earth's Water The Use of Maps Click on the
2003 Water Year Wrap-Up and Look Ahead
 2003 Water Year Wrap-Up and Look Ahead Nolan Doesken Colorado Climate Center Prepared by Odie Bliss http://ccc.atmos.colostate.edu Colorado Average Annual Precipitation Map South Platte Average Precipitation
Average temperature ( F) World Climate Zones. very cold all year with permanent ice and snow. very cold winters, cold summers, and little rain or snow
 World Climate Zones. very cold all year with permanent ice and snow. very cold winters, cold summers, and little rain or snow") P r e v i e w Look carefully at the climagraph of Mumbai, India. What is the wettest month (or months) in Mumbai? What is the driest month (or months) in Mumbai? What effects might this city s climate
P r e v i e w Look carefully at the climagraph of Mumbai, India. What is the wettest month (or months) in Mumbai? What is the driest month (or months) in Mumbai? What effects might this city s climate
WHEN IS IT EVER GOING TO RAIN? Table of Average Annual Rainfall and Rainfall For Selected Arizona Cities
 WHEN IS IT EVER GOING TO RAIN? Table of Average Annual Rainfall and 2001-2002 Rainfall For Selected Arizona Cities Phoenix Tucson Flagstaff Avg. 2001-2002 Avg. 2001-2002 Avg. 2001-2002 October 0.7 0.0
Physical Features of Monsoon Asia. 192 Unit 7 Teachers Curriculum Institute 60 N 130 E 140 E 150 E 60 E 50 N 160 E 40 N 30 N 150 E.
 50 N 60 E 70 E 80 E 90 E 100 E 60 N 110 E 120 E 130 E 140 E 150 E 50 N 160 E 40 N 40 N 30 N 60 E 30 N 150 E Tropic of Cancer 20 N Tropic of Cancer 20 N 10 N 10 N 0 Equator 0 Equator 10 S 10 S 0 500 1,000
Thank you for choosing AIMS!
 Thank you for choosing AIMS! Please use this free activity in your classroom, and watch your students begin to experience the "Aha!" moments of real learning. We like hearing from you. Like us and share
P7: Limiting Factors in Ecosystems
 P7: Limiting Factors in Ecosystems Purpose To understand that physical factors temperature and precipitation limit the growth of vegetative ecosystems Overview Students correlate graphs of vegetation vigor
My Community vs. Nunavut Weather and Climate
 My Community vs. Nunavut Content Areas Social Studies, Science, Technology Objective Students will differentiate between weather and climate. For 1 month, they will collect and graph daily temperature
Highlights of the 2006 Water Year in Colorado
 Highlights of the 2006 Water Year in Colorado Nolan Doesken, State Climatologist Atmospheric Science Department Colorado State University http://ccc.atmos.colostate.edu Presented to 61 st Annual Meeting
What is the difference between Weather and Climate?
 What is the difference between Weather and Climate? Objective Many people are confused about the difference between weather and climate. This makes understanding the difference between weather forecasts
WEATHER AND CLIMATE (K.ES.NGSS)
") TM WEATHER AND CLIMATE (K.ES.NGSS) UNIT AT A GLANCE ACTIVITY 1 - Weather Watchers: Making Observations QUESTIONS: What do we need to know about the weather, and what do we need to find out? Preparation:
TM WEATHER AND CLIMATE (K.ES.NGSS) UNIT AT A GLANCE ACTIVITY 1 - Weather Watchers: Making Observations QUESTIONS: What do we need to know about the weather, and what do we need to find out? Preparation:
Third Grade Math and Science DBQ Weather and Climate/Representing and Interpreting Charts and Data - Teacher s Guide
 Third Grade Math and Science DBQ Weather and Climate/Representing and Interpreting Charts and Data - Teacher s Guide A document based question (DBQ) is an authentic assessment where students interact with
Climate also has a large influence on how local ecosystems have evolved and how we interact with them.
 The Mississippi River in a Changing Climate By Paul Lehman, P.Eng., General Manager Mississippi Valley Conservation (This article originally appeared in the Mississippi Lakes Association s 212 Mississippi
Third Grade Math and Science DBQ Weather and Climate/Representing and Interpreting Charts and Data
 Third Grade Math and Science DBQ Weather and Climate/Representing and Interpreting Charts and Data A document based question (DBQ) is an authentic assessment where students interact with content related
Climate Zones FACT-FILE. What s the difference between weather and climate? Is latitude important?
 FACT-FILE What s the difference between weather and climate? Climate is average weather. Meteorologists (scientists who study weather) work out what the average is by using information about temperature
CoCoRaHS Monitoring Colorado s s Water Resources through Community Collaborations
 CoCoRaHS Monitoring Colorado s s Water Resources through Community Collaborations Nolan Doesken Colorado Climate Center Atmospheric Science Department Colorado State University Presented at Sustaining
Weather and climate. reflect. what do you think? look out!
 reflect You re going on vacation in a week and you have to start thinking about what clothes you re going to pack for your trip. You ve read the weather reports for your vacation spot, but you know that
ELEMENTARY SCIENCE PROGRAM MATH, SCIENCE & TECHNOLOGY EDUCATION. A Collection of Learning Experiences WEATHER Weather Student Activity Book
 ELEMENTARY SCIENCE PROGRAM MATH, SCIENCE & TECHNOLOGY EDUCATION A Collection of Learning Experiences WEATHER Weather Student Activity Book Name This learning experience activity book is yours to keep.
Watching the Weather
 Watching the Weather Topic Observing the weather Key Question What is the weather like today? Focus Students will observe and record weather conditions over a long period of time. Guiding Documents NCTM
Over the course of this unit, you have learned about different
 70 People and Weather TA L K I N G I T O V E R Over the course of this unit, you have learned about different aspects of earth s weather and atmosphere. Atmospheric scientists, climatologists, hydrologists,
Hudson River Estuary Climate Change Lesson Project. Grades 5-8 Teacher s Packet. Lesson 2. Observing Changes at Mohonk Preserve
 Grades 5-8 Teacher s Packet Lesson 2 Observing Changes at Mohonk Preserve 2 Observing Changes at Mohonk Preserve NYS Intermediate Level Science Standard 1: Analysis, Inquiry and Design/Scientific Inquiry
Tracking Weather Patterns
 SCIENCE GRADE 5 Science Content Standards Earth Sciences: 4.C Earth Sciences: 4.D Below Level Tracking Weather Patterns F O C UScurriculum LOOK INSIDE FOR: California s Academic Content Standards Covered
MCMURDO DRY VALLEYS ANTARCTICA
 POLAR WEEKEND MCMURDO DRY VALLEYS ANTARCTICA TOPIC: The McMurdo Dry Valleys, An Ecosystem of microbial life PROJECT PERSONNEL: Dr. Andrew G. Fountain, Geologist, Portland State University, Portland Oregon
The Climate of Oregon Climate Zone 5 High Plateau
 105 E55 Unbound issue i". 9 13oes not circulate CZe Special Report 917 May 1993 The Climate of Oregon Climate Zone 5 Property of OREGON STATE UNIVERSITY Library Serials Corvallis, OR 97331-4503 Agricultural
Go to Grade 6 Everyday Mathematics Sample Lesson
 McGraw-Hill makes no representations or warranties as to the accuracy of any information contained in this McGraw-Hill Material, including any warranties of merchantability or fitness for a particular
Grade 5 Earth Science. Earth: Our Unique Planet
 Science Matters Grade 5 Earth Science Earth: Our Unique Planet Written By Summer Bray Christine Lindblad Claire Poissonniez Vanessa Scarlett Developed in Conjunction with K-12 Alliance/WestEd Table of
LAB J - WORLD CLIMATE ZONES
 Introduction LAB J - WORLD CLIMATE ZONES The objective of this lab is to familiarize the student with the various climates around the world and the climate controls that influence these climates. Students
Appendix B Lesson 1: What Is Weather Exit Ticket
 Appendix B Lesson 1: What Is Weather Exit Ticket Name Date Period What is Weather? Exit Ticket List 3 things that you learned during the demonstrations today. What are two questions that you still have?
What Is It Like Outside?
 What Is It Like Outside? Focus: Students will describe daily changes in temperature and weather. Specific Curriculum Outcomes Students will be expected to: 1.0 pose questions that lead to exploration and
Global Climates. Name Date
 Global Climates Name Date No investigation of the atmosphere is complete without examining the global distribution of the major atmospheric elements and the impact that humans have on weather and climate.
UNIVERSITY OF CAMBRIDGE INTERNATIONAL EXAMINATIONS International General Certificate of Secondary Education
 www.xtremepapers.com UNIVERSITY OF CAMBRIDGE INTERNATIONAL EXAMINATIONS International General Certificate of Secondary Education *2678444144* ENVIRONMENTAL MANAGEMENT 0680/02 Paper 2 May/June 2008 1 hour
Recommended Grade Level: 8 Earth/Environmental Science Weather vs. Climate
 Lab Activity Title: Climate Factors Past and Present Recommended Grade Level: 8 Discipline: Earth/Environmental Science Topic: Weather vs. Climate Time Requirements: 90 minutes Submitted by: Karen McCabe
Bell Work. REVIEW: Our Planet Earth Page 29 Document A & B Questions
 9.12.16 Bell Work REVIEW: Our Planet Earth Page 29 Document A & B Questions Intro to Climate & Weather https://www.youtube.com/watch?v=vhgyoa70q7y Weather vs. Climate Video Climate & Weather 3.1 Weather
Name Date. What s the weather like today? Watch the beginning of the video Basics of geography- climate.
 FACTORS THAT INFLUENCE CLIMATE worksheet 1 STARTER Look at the weather symbols and answer: What s the weather like today? WHAT S CLIMATE? Watch the beginning of the video Basics of geography- climate.
CLIMATE VS. WEATHER. Activity Plan
 CLIMATE VS. WEATHER Activity Plan Project Skills, Goals, or Objectives: Students will understand the definitions of climate and weather and differentiate between the two. Life Skills: STEM, Environmental
Missouri River Basin Water Management Monthly Update
 Missouri River Basin Water Management Monthly Update Participating Agencies 255 255 255 237 237 237 0 0 0 217 217 217 163 163 163 200 200 200 131 132 122 239 65 53 80 119 27 National Oceanic and Atmospheric
Applications/Users for Improved S2S Forecasts
 Applications/Users for Improved S2S Forecasts Nolan Doesken Colorado Climate Center Colorado State University WSWC Precipitation Forecasting Workshop June 7-9, 2016 San Diego, CA First -- A short background
What Is the Weather Like in Different Regions of the United States?
 Learning Set 1 What Is Weather, and How Is It Measured and Described? 1.3 Explore What Is the Weather Like in Different Regions of the United States? trends: patterns or tendencies you can see over a broad
Let s Talk Climate! Nolan Doesken Colorado Climate Center Colorado State University. Yampatika Seminar February 16, 2011 Steamboat Springs, Colorado
 Let s Talk Climate! Nolan Doesken Colorado Climate Center Colorado State University Yampatika Seminar February 16, 2011 Steamboat Springs, Colorado First -- A short background In 1973 the federal government
Alliance Created State Giant Traveling Map Lesson
 Title: Comparing Arizona s Temperatures Recommended Grades: 4 th 5 th Time Needed: 30 minutes Objectives: Students will: Compare and contrast the geographic features of Arizona by researching seasonal
UWM Field Station meteorological data
 University of Wisconsin Milwaukee UWM Digital Commons Field Station Bulletins UWM Field Station Spring 992 UWM Field Station meteorological data James W. Popp University of Wisconsin - Milwaukee Follow
GAMINGRE 8/1/ of 7
 FYE 09/30/92 JULY 92 0.00 254,550.00 0.00 0 0 0 0 0 0 0 0 0 254,550.00 0.00 0.00 0.00 0.00 254,550.00 AUG 10,616,710.31 5,299.95 845,656.83 84,565.68 61,084.86 23,480.82 339,734.73 135,893.89 67,946.95
Climate Change and Water Supply Research. Drought Response Workshop October 8, 2013
 Climate Change and Water Supply Research Drought Response Workshop October 8, 2013 DWR Photo Oroville Reservoir, 2009 Talk Overview Expectations History Atmospheric Rivers and Water Supply Current Research
GRADE3. Curriculum and Lesson Plan Resource Guide
 GRADE3 Curriculum and Lesson Plan Resource Guide Donald C. & Elizabeth M. Dickinson Foundation The Carol and Henry F. Hunte Fund at The San Diego Foundation Grade 3 Desert Plants Essential Question: How
Adopt a Drifter Lesson Plan by Mary Cook, Middle School Science Teacher, Ahlf Jr. High School, Searcy, Arkansas
 Adopt a Drifter Lesson Plan by Mary Cook, Middle School Science Teacher, Ahlf Jr. High School, Searcy, Arkansas Do Ocean Surface Currents Influence Climate? Objectives Students will construct climographs
THE STATE OF SURFACE WATER GAUGING IN THE NAVAJO NATION
 THE STATE OF SURFACE WATER GAUGING IN THE NAVAJO NATION Aregai Tecle Professor of Hydrology Northern Arizona University Flagstaff, AZ Acknowledgement Many thanks to my research team mates and Elisabeth
MISSION DEBRIEFING: Teacher Guide
 Activity 2: It s Raining Again?! Using real data from one particular location, students will interpret a graph that relates rainfall to the number of cases of malaria. Background The relationship between
Climate Change. Presenter s Script
 General Instructions Presenter s Script You will have 15 minutes to present your activity. When you hear the air horn blow, you will begin your presentation (please do not start presenting until the air
Country Presentation-Nepal
 Country Presentation-Nepal Mt.Everest, Shiva Pd. Nepal, DHM South Asia Drought Monitor Workshop Dhaka Bangladesh 2 th April 215 Overview Brief Climatology Climate activities- DHM PPCR (Pilot Program for
TILT, DAYLIGHT AND SEASONS WORKSHEET
 TILT, DAYLIGHT AND SEASONS WORKSHEET Activity Description: Students will use a data table to make a graph for the length of day and average high temperature in Utah. They will then answer questions based
Name Period Part I: INVESTIGATING OCEAN CURRENTS: PLOTTING BUOY DATA
 Name Period Part I: INVESTIGATING OCEAN CURRENTS: PLOTTING BUOY DATA INTRODUCTION: Ocean currents are like huge rivers in the sea. They carry drifting organisms, vital dissolved chemical nutrients and
Variability of Reference Evapotranspiration Across Nebraska
 Know how. Know now. EC733 Variability of Reference Evapotranspiration Across Nebraska Suat Irmak, Extension Soil and Water Resources and Irrigation Specialist Kari E. Skaggs, Research Associate, Biological
PBL :WEATHER Grade Level: 2 nd Grade Local Partners: Local Meteorologist. How does weather impact those living and visiting Virginia Beach?
 PBL :WEATHER Grade Level: 2 nd Grade Local Partners: Local Meteorologist Theme: Problem: Student Roles: Scenario: Resources: Culminating Project/Assessment: Safety: Weather How does weather impact those
The Colorado Drought : 2003: A Growing Concern. Roger Pielke, Sr. Colorado Climate Center.
 The Colorado Drought 2001-2003: 2003: A Growing Concern Roger Pielke, Sr. Colorado Climate Center Prepared by Tara Green and Odie Bliss http://climate.atmos.colostate.edu 2 2002 Drought History in Colorado
Colorado s 2003 Moisture Outlook
 Colorado s 2003 Moisture Outlook Nolan Doesken and Roger Pielke, Sr. Colorado Climate Center Prepared by Tara Green and Odie Bliss http://climate.atmos.colostate.edu How we got into this drought! Fort
CAVE CLIMATE COMPARISON ACTIVITY BETWEEN THE SURFACE AND THE CAVERN
 CAVE CLIMATE COMPARISON ACTIVITY BETWEEN THE SURFACE AND THE CAVERN Created by Ray Bowers For the Virtual Center for the Environment (VCE) A part of the Institute of Natural Resources Analysis and Management
Science Grade 01 Unit 01 Exemplar Lesson 02: Observing and Recording Weather
 Unit: 01 Lesson: 02 Suggested Duration: 5 days Grade 01 Unit 01 Exemplar Lesson 02: Observing and Recording Weather This lesson is one approach to teaching the State Standards associated with this unit.
Climate Variability in South Asia
 Climate Variability in South Asia V. Niranjan, M. Dinesh Kumar, and Nitin Bassi Institute for Resource Analysis and Policy Contents Introduction Rainfall variability in South Asia Temporal variability
LAB 3: THE SUN AND CLIMATE NAME: LAB PARTNER(S):
:") GEOG 101L PHYSICAL GEOGRAPHY LAB SAN DIEGO CITY COLLEGE SELKIN 1 LAB 3: THE SUN AND CLIMATE NAME: LAB PARTNER(S): The main objective of today s lab is for you to be able to visualize the sun s position
GEOG 101L PHYSICAL GEOGRAPHY LAB SAN DIEGO CITY COLLEGE SELKIN 1 LAB 3: THE SUN AND CLIMATE NAME: LAB PARTNER(S): The main objective of today s lab is for you to be able to visualize the sun s position
January 25, Summary
 January 25, 2013 Summary Precipitation since the December 17, 2012, Drought Update has been slightly below average in parts of central and northern Illinois and above average in southern Illinois. Soil
NATIONAL HYDROPOWER ASSOCIATION MEETING. December 3, 2008 Birmingham Alabama. Roger McNeil Service Hydrologist NWS Birmingham Alabama
 NATIONAL HYDROPOWER ASSOCIATION MEETING December 3, 2008 Birmingham Alabama Roger McNeil Service Hydrologist NWS Birmingham Alabama There are three commonly described types of Drought: Meteorological drought
Climatography of the United States No
 Climate Division: AK 5 NWS Call Sign: ANC Month (1) Min (2) Month(1) Extremes Lowest (2) Temperature ( F) Lowest Month(1) Degree s (1) Base Temp 65 Heating Cooling 90 Number of s (3) Jan 22.2 9.3 15.8
Drought in Southeast Colorado
 Drought in Southeast Colorado Nolan Doesken and Roger Pielke, Sr. Colorado Climate Center Prepared by Tara Green and Odie Bliss http://climate.atmos.colostate.edu 1 Historical Perspective on Drought Tourism
2016 Meteorology Summary
 2016 Meteorology Summary New Jersey Department of Environmental Protection AIR POLLUTION AND METEOROLOGY Meteorology plays an important role in the distribution of pollution throughout the troposphere,
Funding provided by NOAA Sectoral Applications Research Project CLIMATE. Basic Climatology Colorado Climate Center
 Funding provided by NOAA Sectoral Applications Research Project CLIMATE Basic Climatology Colorado Climate Center Remember These? Factor 1: Our Energy Source Factor 2: Revolution & Tilt Factor 3: Rotation!
A Report on a Statistical Model to Forecast Seasonal Inflows to Cowichan Lake
 A Report on a Statistical Model to Forecast Seasonal Inflows to Cowichan Lake Prepared by: Allan Chapman, MSc, PGeo Hydrologist, Chapman Geoscience Ltd., and Former Head, BC River Forecast Centre Victoria
What Does It Take to Get Out of Drought?
 What Does It Take to Get Out of Drought? Nolan J. Doesken Colorado Climate Center Colorado State University http://ccc.atmos.colostate.edu Presented at the Insects, Diseases and Drought Workshop, May 19,
Teacher Guide Climate Change or Climate Variability: Making Sense of U.S. Temperature and Precipitation Data
 Teacher Guide Climate Change or Climate Variability: Making Sense of U.S. Temperature and Precipitation Data Developed by: Dan Shepardson Activity Focus: Students analyze U.S. temperature and precipitation
2003 Moisture Outlook
 2003 Moisture Outlook Nolan Doesken and Roger Pielke, Sr. Colorado Climate Center Prepared by Tara Green and Odie Bliss http://climate.atmos.colostate.edu Through 1999 Through 1999 Fort Collins Total Water
LAB 19. Lab 19. Differences in Regional Climate: Why Do Two Cities Located at the Same Latitude and Near a Body of Water Have Such Different Climates?
 Lab Handout Lab 19. Differences in Regional Climate: Why Do Two Cities Located at the Same Latitude and Near a Body of Water Have Such Different Climates? Introduction Weather describes the current atmospheric
Tracking Weather Patterns
 SCIENCE GRADE 5 Science Content Standards Earth Sciences: 4.C Earth Sciences: 4.D On Level Tracking Weather Patterns F O C UScurriculum LOOK INSIDE FOR: California s Academic Content Standards Covered
2275 Speedway, Mail Code C9000 Austin, TX (512) Weather and Climate
 Weather and Climate") Lesson Plan for Grades: Middle School Length of Lesson: 90 minutes Authored by: UT Environmental Science Institute Date created: 05/10/2017 Subject area/course: Mathematics Materials: Fun size bags of
Lesson Plan for Grades: Middle School Length of Lesson: 90 minutes Authored by: UT Environmental Science Institute Date created: 05/10/2017 Subject area/course: Mathematics Materials: Fun size bags of
Betty LaDuke. Biomes of the World PRESERVATION OF OREGON S ARTISTIC HERITAGE PROJECT. Grade Level no grade level listed on the word document
 Betty LaDuke PRESERVATION OF OREGON S ARTISTIC HERITAGE PROJECT Biomes of the World Grade Level no grade level listed on the word document Theme The artist in his or her environment Curriculum Framework
Name Date Class. well as the inland, found near the Tropics. 4. In the, or the regions near the Equator, you may find a lush
 WATER, CLIMATE, AND VEGETATION Vocabulary Activity DIRECTIONS: Fill in the Blanks Select a term from below to complete each of the following sentences. CHAPTER 1. The constant movement of water, a process
Lesson Nine Population Problems. Key question How does growth of Florida s human population affect bear populations?
 Lesson Nine Population Problems Key question How does growth of Florida s human population affect bear populations? Conceptual frameworks topics IV.C. Florida black bear seasonal activities and movements
Welcome Survey getting to know you Collect & log Supplies received Classroom Rules Curriculum overview. 1 : Aug 810. (3 days) 2nd: Aug (5 days)
 2nd: Aug (5 days)") 1st Quarter (41Days) st 1 : Aug 810 (3 days) 2nd: Aug 13-17 Reporting Categories (TEKS SEs) Skill Create and write a postcard about your favorite community activity Review 2nd Grade Vocabulary Chapter
1st Quarter (41Days) st 1 : Aug 810 (3 days) 2nd: Aug 13-17 Reporting Categories (TEKS SEs) Skill Create and write a postcard about your favorite community activity Review 2nd Grade Vocabulary Chapter
Climate Change in the Inland Pacific Northwest
 80 Climate Change in the Inland Pacific Northwest Week 2 Day 4 Lesson Overview The purpose of this lesson is for students to apply and extend their previous knowledge of global climate change to a regional
Science and Literacy. Lesson Sets. Weather vs. Climate. By Elementary Ali. Created by Elementary Ali 2014
 d Science and Literacy Lesson Sets Weather vs. Climate By Elementary Ali These activities are created to incorporate reading and writing into the Science curriculum. Each lesson is designed to last about
The Climate of Oregon Climate Zone 4 Northern Cascades
 /05 E55 Unbound issue No. 9/ is Does not circulate Special Report 916 May 1993 The Climate of Oregon Climate Zone 4 Property of OREGON STATE UNIVERSITY Library Serials Corvallis, OR 97331-4503 Agricultural
You Might Also Like. I look forward helping you focus your instruction while saving tons of time. Kesler Science Station Lab Activities 40%+ Savings!
 Thanks Connect Thank you for downloading my product. I truly appreciate your support and look forward to hearing your feedback. You can connect with me and find many free activities and strategies over
Precipitating Weather
 Title: Precipitating Weather (Meteorology) Grade Level(s): 6-8 Introduction: There has probably been a small increase in global precipitation over land during the twentieth century. When speaking of precipitation,
Lesson 8: Variability in a Data Distribution
 Classwork Example 1: Comparing Two Distributions Robert s family is planning to move to either New York City or San Francisco. Robert has a cousin in San Francisco and asked her how she likes living in
Study of Hydrometeorology in a Hard Rock Terrain, Kadirischist Belt Area, Anantapur District, Andhra Pradesh
 Open Journal of Geology, 2012, 2, 294-300 http://dx.doi.org/10.4236/ojg.2012.24028 Published Online October 2012 (http://www.scirp.org/journal/ojg) Study of Hydrometeorology in a Hard Rock Terrain, Kadirischist
C1: From Weather to Climate Looking at Air Temperature Data
 C1: From Weather to Climate Looking at Air Temperature Data Purpose Students will work with short- and longterm air temperature data in order to better understand the differences between weather and climate.
SPECIMEN. Date Morning/Afternoon. A Level Geography H481/01 Physical systems Sample Question Paper. Time allowed: 1 hour 30 minutes PMT
 Oxford Cambridge and RSA A Level Geography H481/01 Physical systems Sample Question Paper Date Morning/Afternoon Time allowed: 1 hour 30 minutes You must have: the Resource Booklet the OCR 12-page Answer
WHAT IS WEATHER? many kinds of weather, such as hot, cold, sunny, rainy, snowy, and windy. Storms and winds can change the weather in a hurry.
 WHAT IS WEATHER? Weather tells us what the outside air is like. There are Why did the woman go outside with her purse open? She thought there was going to be some change in the weather! many kinds of weather,
Tracking the Climate Of Northern Colorado Nolan Doesken State Climatologist Colorado Climate Center Colorado State University
 Tracking the Climate Of Northern Colorado Nolan Doesken State Climatologist Colorado Climate Center Colorado State University Northern Colorado Business Innovations November 20, 2013 Loveland, Colorado
ISOLINE MAPS and RAINFALL
 ISOLINE MAPS and RAINFALL Geography 101 Lab Name Purpose: Introduce students to one of the most common and useful types of maps used in studying the natural environment. When completed, the student should
3 rd Grade GLEs 47, 48, & 49. Study Guide. Answer Guide Included
 3 rd Grade GLEs 47, 48, & 49 Study Guide Answer Guide Included Fellow Teacher, Thank you for downloading Weather Study Guide. It is my hope that it will help your students become more familiar with the
Chiang Rai Province CC Threat overview AAS1109 Mekong ARCC
 Chiang Rai Province CC Threat overview AAS1109 Mekong ARCC This threat overview relies on projections of future climate change in the Mekong Basin for the period 2045-2069 compared to a baseline of 1980-2005.
Computing & Telecommunications Services Monthly Report January CaTS Help Desk. Wright State University (937)
") January 215 Monthly Report Computing & Telecommunications Services Monthly Report January 215 CaTS Help Desk (937) 775-4827 1-888-775-4827 25 Library Annex helpdesk@wright.edu www.wright.edu/cats/ Last
January 215 Monthly Report Computing & Telecommunications Services Monthly Report January 215 CaTS Help Desk (937) 775-4827 1-888-775-4827 25 Library Annex helpdesk@wright.edu www.wright.edu/cats/ Last
Grade 6 Standard 2 Unit Test Astronomy
 Grade 6 Standard 2 Unit Test Astronomy Multiple Choice 1. Why does the air temperature rise in the summer? A. We are closer to the sun. B. The air becomes thicker and more dense. C. The sun s rays are
Desert Plant Adaptations
 Teacher: Time: 1 hour (or three 20-minute parts) Grade Level: 3 rd -6 th Author: Blue Baldwin & Michelle Coe Next Generation Science Standards: Enduring Understandings: Content Objective: 3-LS3-2 & 3-LS4-2.
EGYPTIAN AMERICAN INTERNATIONAL SCHOOL Elementary Science Department TERM 4 GRADE 4. Revision. 1. Weather ( ) 1. Is too little precipitation.
 1. Is too little precipitation.") EGYPTIAN AMERICAN INTERNATIONAL SCHOOL Elementary Science Department TERM 4 GRADE 4 A. Match using letters: Revision 1. Weather ( ) 1. Is too little precipitation. 2. Humidity ( ) 2. Is the condition of
EGYPTIAN AMERICAN INTERNATIONAL SCHOOL Elementary Science Department TERM 4 GRADE 4 A. Match using letters: Revision 1. Weather ( ) 1. Is too little precipitation. 2. Humidity ( ) 2. Is the condition of
The of that surrounds the Earth. Atmosphere. A greenhouse that has produced the most global. Carbon Dioxide
 Name: Date: # Weather and Climate Unit Review Directions: Complete this packet to help you prepare for your unit test by filling in the blanks to complete the definitions. Then if no picture is provided,