Prairie Climate Centre Prairie Climate Atlas. Visualizing Climate Change Projections for the Canadian Prairie Provinces
|
|
|
- Sharyl Eaton
- 5 years ago
- Views:
Transcription


1 Prairie Climate Centre Prairie Climate Atlas Visualizing Climate Change Projections for the Canadian Prairie Provinces


2 Acknowledgements


3 About Us Dr. Danny Blair Dr. Ian Mauro Ryan Smith, MSc Dr. Hank Venema Scientific Director, Prairie Climate Centre Climatologist Associate Dean, Faculty of Science Principal, Richardson College for the Environment Professor, Department of Geography University of Winnipeg Communications Director, Prairie Climate Centre Film maker, environmental scientist Associate Professor, Department of Geography University of Winnipeg Research Associate, Prairie Climate Centre Climate researcher, computer programmer and map designer University of Winnipeg Planning Director, Prairie Climate Centre Policy analyst, International Institute for Sustainable Development Professional engineer Climate, water, energy, ecosystem management, environmental economics, agriculture policy expert
4 Outline o We use data from 12 downscaled global climate models to produce ensemble (average) projected conditions for the region o Downscaled data was produced by the Pacific Climate Impacts Consortium (PCIC) in Victoria, BC o For any location/area in the Prairie Provinces (e.g., town, RM, crop district) we can provide a detailed summary of the projected climate changes o Projections using two Carbon Emissions Scenarios are used to represent the uncertainty associated with future concentrations of greenhouse gases o Projections are shown for two future time periods: near future ( ) and far future ( ). Changes often shown relative to baseline period (modeled).
5 Temperature Projections Summary o Climate projections were extracted from: o 12 Global Climate Models, each using o 2 Carbon Emissions Scenarios (RCP4.5 and RCP8.5) Range within Projections (RCP8.5) Range within Current Climate Range within Projections (RCP4.5) Recent Past Near Future Far Future ( ) ( ) ( )
6 Tailor-made Reports
7 Tailor-made Reports
8 Tailor-made Reports

9 Tailor-made Reports We can generate reports for any shape-file area.

10 Days -30 or Colder

, University of Victoria, (2014).")
11 Shifting Extremes Change in the Number of Very Cold Days This is the type of image that will be on our website. Draped over scalable Google Earth images. Major centres will be clickable, to obtain data details Annual number of days -30 C Recent Past Near Future Far Future Data Source: Pacific Climate Impacts Consortium (PCIC), University of Victoria, (2014). Statistically Downscaled Climate Scenarios. Downloaded from pacificclimate.org.
12 Shifting Extremes Change in the Number of Very Cold Days Five different versions of maps for each variable will be presented: (RCP4.5) (RCP8.5) (RCP4.5) (RCP8.5) Annual number of days -30 C Recent Past Near Future Far Future Data Source: Pacific Climate Impacts Consortium (PCIC), University of Victoria, (2014). Statistically Downscaled Climate Scenarios. Downloaded from pacificclimate.org.
13 Shifting Extremes Change in the Number of Very Cold Days Annual number of days -30 C Recent Past Near Future Far Future Data Source: Pacific Climate Impacts Consortium (PCIC), University of Victoria, (2014). Statistically Downscaled Climate Scenarios. Downloaded from pacificclimate.org.
, University of Victoria, (2014). Statistically Downscaled Climate Scenarios. Downloaded from pacificclimate.org.")
14 Shifting Extremes Change in the Number of Very Cold Days Annual number of days -30 C Recent Past Near Future Far Future Data Source: Pacific Climate Impacts Consortium (PCIC), University of Victoria, (2014). Statistically Downscaled Climate Scenarios. Downloaded from pacificclimate.org.
, University of Victoria, (2014). Statistically Downscaled Climate Scenarios. Downloaded from pacificclimate.org.")
15 Shifting Extremes Change in the Number of Very Cold Days Annual number of days -30 C Recent Past Near Future Far Future Data Source: Pacific Climate Impacts Consortium (PCIC), University of Victoria, (2014). Statistically Downscaled Climate Scenarios. Downloaded from pacificclimate.org.
16 Days +30 or Warmer
, University of Victoria, (2014). Statistically Downscaled Climate Scenarios. Downloaded from pacificclimate.")
17 Shifting Extremes Change in the Number of Very Hot Days Annual number of days 30 C Recent Past Near Future Far Future Data Source: Pacific Climate Impacts Consortium (PCIC), University of Victoria, (2014). Statistically Downscaled Climate Scenarios. Downloaded from pacificclimate.org.
18 Shifting Extremes Change in the Number of Very Hot Days Annual number of days 30 C Recent Past Near Future Far Future Data Source: Pacific Climate Impacts Consortium (PCIC), University of Victoria, (2014). Statistically Downscaled Climate Scenarios. Downloaded from pacificclimate.org.
19 Shifting Extremes Change in the Number of Very Hot Days Annual number of days 30 C Recent Past Near Future Far Future Data Source: Pacific Climate Impacts Consortium (PCIC), University of Victoria, (2014). Statistically Downscaled Climate Scenarios. Downloaded from pacificclimate.org.
20 Shifting Extremes Change in the Number of Very Hot Days Annual number of days 30 C Recent Past Near Future Far Future Data Source: Pacific Climate Impacts Consortium (PCIC), University of Victoria, (2014). Statistically Downscaled Climate Scenarios. Downloaded from pacificclimate.org.
, University of Victoria, (2014). Statistically Downscaled Climate Scenarios. Downloaded from pacificclimate.")
21 Shifting Extremes Change in the Number of Very Hot Days Annual number of days 30 C Recent Past Near Future Far Future Data Source: Pacific Climate Impacts Consortium (PCIC), University of Victoria, (2014). Statistically Downscaled Climate Scenarios. Downloaded from pacificclimate.org.

22 Frost-Free Period
, University of Victoria, (2014). Statistically Downscaled Climate Scenarios. Downloaded from pacificclimate.org.")
23 Frost-Free Period A Much Longer Growing Season Length of the Frost-Free Period (days) Recent Past Near Future Far Future Data Source: Pacific Climate Impacts Consortium (PCIC), University of Victoria, (2014). Statistically Downscaled Climate Scenarios. Downloaded from pacificclimate.org.
, University of Victoria, (2014). Statistically Downscaled Climate Scenarios. Downloaded from pacificclimate.org.")
24 Frost-Free Period A Much Longer Growing Season Length of the Frost-Free Period (days) Recent Past Near Future Far Future Data Source: Pacific Climate Impacts Consortium (PCIC), University of Victoria, (2014). Statistically Downscaled Climate Scenarios. Downloaded from pacificclimate.org.
, University of Victoria, (2014). Statistically Downscaled Climate Scenarios. Downloaded from pacificclimate.org.")
25 Frost-Free Period A Much Longer Growing Season Length of the Frost-Free Period (days) Recent Past Near Future Far Future Data Source: Pacific Climate Impacts Consortium (PCIC), University of Victoria, (2014). Statistically Downscaled Climate Scenarios. Downloaded from pacificclimate.org.
, University of Victoria, (2014). Statistically Downscaled Climate Scenarios. Downloaded from pacificclimate.org.")
26 Frost-Free Period A Much Longer Growing Season Length of the Frost-Free Period (days) Recent Past Near Future Far Future Data Source: Pacific Climate Impacts Consortium (PCIC), University of Victoria, (2014). Statistically Downscaled Climate Scenarios. Downloaded from pacificclimate.org.
, University of Victoria, (2014). Statistically Downscaled Climate Scenarios. Downloaded from pacificclimate.org.")
27 Frost-Free Period A Much Longer Growing Season Length of the Frost-Free Period (days) Recent Past Near Future Far Future Data Source: Pacific Climate Impacts Consortium (PCIC), University of Victoria, (2014). Statistically Downscaled Climate Scenarios. Downloaded from pacificclimate.org.
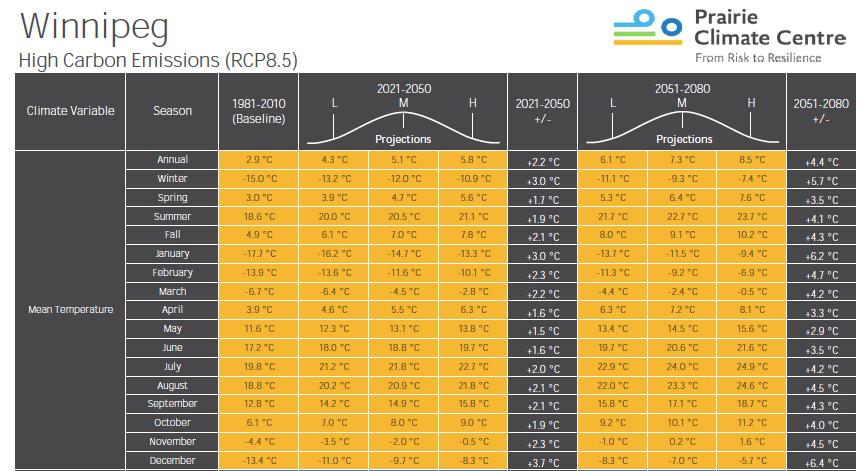
28 Temperature Change ( o C) from ΔT: RCP Edmonton Regina Winnipeg Jan Feb Mar Apr May Jun Jul Aug Sep Oct Nov Dec

29 Spring Precipitation
30 Prairie Precipitation Projected Changes in Total Spring Precipitation Total Spring Precipitation (mm) Recent Past Near Future Far Future Data Source: Pacific Climate Impacts Consortium (PCIC), University of Victoria, (2014). Statistically Downscaled Climate Scenarios. Downloaded from pacificclimate.org.
31 Prairie Precipitation Projected Changes in Total Spring Precipitation Total Spring Precipitation (mm) Recent Past Near Future Far Future Data Source: Pacific Climate Impacts Consortium (PCIC), University of Victoria, (2014). Statistically Downscaled Climate Scenarios. Downloaded from pacificclimate.org.
32 Prairie Precipitation Projected Changes in Total Spring Precipitation Total Spring Precipitation (mm) Recent Past Near Future Far Future Data Source: Pacific Climate Impacts Consortium (PCIC), University of Victoria, (2014). Statistically Downscaled Climate Scenarios. Downloaded from pacificclimate.org.
, University of Victoria, (2014). Statistically Downscaled Climate Scenarios. Downloaded from pacificclimate.")
33 Prairie Precipitation Projected Changes in Total Spring Precipitation Total Spring Precipitation (mm) Recent Past Near Future Far Future Data Source: Pacific Climate Impacts Consortium (PCIC), University of Victoria, (2014). Statistically Downscaled Climate Scenarios. Downloaded from pacificclimate.org.
34 Prairie Precipitation Projected Changes in Total Spring Precipitation Total Spring Precipitation (mm) Recent Past Near Future Far Future Data Source: Pacific Climate Impacts Consortium (PCIC), University of Victoria, (2014). Statistically Downscaled Climate Scenarios. Downloaded from pacificclimate.org.

35 Summer Precipitation
36 Prairie Precipitation Projected Changes in Total Summer Precipitation Total Summer Precipitation (mm) Recent Past Near Future Far Future Data Source: Pacific Climate Impacts Consortium (PCIC), University of Victoria, (2014). Statistically Downscaled Climate Scenarios. Downloaded from pacificclimate.org.
, University of Victoria, (2014). Statistically Downscaled Climate Scenarios. Downloaded from pacificclimate.")
37 Prairie Precipitation Projected Changes in Total Summer Precipitation Total Summer Precipitation (mm) Recent Past Near Future Far Future Data Source: Pacific Climate Impacts Consortium (PCIC), University of Victoria, (2014). Statistically Downscaled Climate Scenarios. Downloaded from pacificclimate.org.
38 Prairie Precipitation Projected Changes in Total Summer Precipitation Total Summer Precipitation (mm) Recent Past Near Future Far Future Data Source: Pacific Climate Impacts Consortium (PCIC), University of Victoria, (2014). Statistically Downscaled Climate Scenarios. Downloaded from pacificclimate.org.
39 Prairie Precipitation Projected Changes in Total Summer Precipitation Total Summer Precipitation (mm) Recent Past Near Future Far Future Data Source: Pacific Climate Impacts Consortium (PCIC), University of Victoria, (2014). Statistically Downscaled Climate Scenarios. Downloaded from pacificclimate.org.
40 Prairie Precipitation Projected Changes in Total Summer Precipitation Total Summer Precipitation (mm) Recent Past Near Future Far Future Data Source: Pacific Climate Impacts Consortium (PCIC), University of Victoria, (2014). Statistically Downscaled Climate Scenarios. Downloaded from pacificclimate.org.
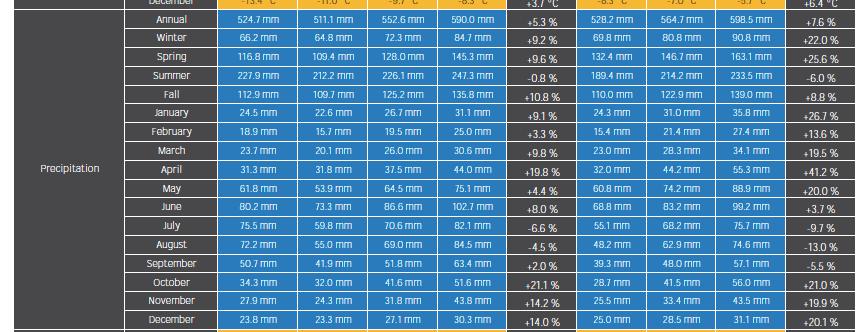
41 % Change from ΔPPT: RCP Edmonton Regina Winnipeg Jan Feb Mar Apr May Jun Jul Aug Sep Oct Nov Dec
42 An Example of Climate Analogues

43 Winnipeg Winter Climate Analogues AdaptWest data was used to identify whose climates we will have in the future, using seasonal temperature and precipitation projections. Summer Winter 2020s 2050s 2080s
44 Winnipeg Winter Climate Analogues Similarity index: Mean temperature within 1 C Total precipitation within 20% Summer Winter 2020s 2050s 2080s
45 Winnipeg Winter Climate Analogues Summer Winter 2020s 2050s 2080s

46 Winnipeg Summer Climate Analogues Summer Winter 2020s 2050s 2080s
47 Winnipeg Summer Climate Analogues Summer Winter 2020s 2050s 2080s
48 Winnipeg Summer Climate Analogues Summer Winter 2020s 2050s 2080s
49 References BCSD-downscaled climate data supplied by: Pacific Climate Impacts Consortium, University of Victoria, (Jan. 2015). Statistically Downscaled Climate Scenarios. Downloaded from pacificcliamte.org THANK YOU PCIC! AdaptWest Project Gridded current and projected climate data for North America at 1km resolution, interpolated using the ClimateNA v5.10 software (T. Wang et al., 2015). Available at adaptwest.databasin.org
50 Role of the Prairie Climate Centre Inform policy and develop solutions Inspire adaptation and mitigation Make climate change data accessible to all Build decision making tools Produce peer-reviewed research results Foster Prairie-wide collaborations and partnerships Conduct workshops and training sessions Educate the public
51 Implications Shifting seasons Shorter, warmer winters Longer, hotter summers More precipitation in winter, spring, fall Less precipitation in summer More intense precipitation events More severe weather More heat waves A less stable climate
52 Risks Floods and droughts Water resource management Human health Crop failure Invasive species Forest fires Winter roads Infrastructure and building codes Disaster management and response Summer energy demand
53 Benefits Longer growing season New crop varieties Lower winter heating costs Fewer extreme cold events
54 Thank You We look forward to working with you
Estimation of Energy Demand Taking into Account climate change in Southern Québec
 Estimation of Energy Demand Taking into Account climate change in Southern Québec Diane Chaumont Ouranos In collaboration with René Roy 1, Barbara Casati 2, Ramon de Elia 2, Marco Braun 2 IREQ 1, Ouranos
Climate also has a large influence on how local ecosystems have evolved and how we interact with them.
 The Mississippi River in a Changing Climate By Paul Lehman, P.Eng., General Manager Mississippi Valley Conservation (This article originally appeared in the Mississippi Lakes Association s 212 Mississippi
GAMINGRE 8/1/ of 7
 FYE 09/30/92 JULY 92 0.00 254,550.00 0.00 0 0 0 0 0 0 0 0 0 254,550.00 0.00 0.00 0.00 0.00 254,550.00 AUG 10,616,710.31 5,299.95 845,656.83 84,565.68 61,084.86 23,480.82 339,734.73 135,893.89 67,946.95
Communicating Climate Change Consequences for Land Use
 Communicating Climate Change Consequences for Land Use Site: Prabost, Skye. Event: Kyle of Lochalsh, 28 th February 28 Further information: http://www.macaulay.ac.uk/ladss/comm_cc_consequences.html Who
The Norwegian Centre for Climate Services - NCCS
 The Norwegian Centre for Climate Services - NCCS Extremes Products - Dissemination Eirik J. Førland, Norwegian Meteorological Institute, Oslo, Norway Impact assessment consultation workshop, Budapest,
Climatic and Ecological Conditions in the Klamath Basin of Southern Oregon and Northern California: Projections for the Future
 Climatic and Ecological Conditions in the Klamath Basin of Southern Oregon and Northern California: Projections for the Future A Collaborative Effort by: CLIMATE LEADERSHIP INITIATIVE INSTITUTE FOR A SUSTAINABLE
Global Climate Change and the Implications for Oklahoma. Gary McManus Associate State Climatologist Oklahoma Climatological Survey
 Global Climate Change and the Implications for Oklahoma Gary McManus Associate State Climatologist Oklahoma Climatological Survey OCS LEGISLATIVE MANDATES Conduct and report on studies of climate and weather
Climate Change: bridging scientific knowledge and public policy. Forum Parliament House, Canberra 18 March 2010
 Climate Change: bridging scientific knowledge and public policy Forum Parliament House, Canberra 18 March 2010 Opening Comments Prof. Peter Coaldrake Chair Universities Australia Session 1 Climate change
Implications of Climate Change on Long Lead Forecasting and Global Agriculture. Ray Motha
 Implications of Climate Change on Long Lead Forecasting and Global Agriculture Ray Motha Source: http://www.coaps.fsu.edu/lib/climatoons/toon38.shtml ENSO Teleconnections 30 Observed Monthly Sea Surface
THE CANADIAN CENTRE FOR CLIMATE MODELLING AND ANALYSIS
 THE CANADIAN CENTRE FOR CLIMATE MODELLING AND ANALYSIS As Canada s climate changes, and weather patterns shift, Canadian climate models provide guidance in an uncertain future. CANADA S CLIMATE IS CHANGING
Climate Change Impact Assessment on Long Term Water Budget for Maitland Catchment in Southern Ontario
 215 SWAT CONFERENCE, PURDUE Climate Change Impact Assessment on Long Term Water Budget for Maitland Catchment in Southern Ontario By Vinod Chilkoti Aakash Bagchi Tirupati Bolisetti Ram Balachandar Contents
CLIMATE OVERVIEW. Thunder Bay Climate Overview Page 1 of 5
 CLIMATE OVERVIEW The climate in the Thunder Bay area is typical of a mid-latitude inland location with a Great Lake Moderating influence. The moderating effect of Lake Superior results in cooler summer
Climate Change RMJOC Study Summary
 Climate Change RMJOC Study Summary Erik Pytlak Weather and Streamflow Forecasting Bonneville Power Administration Portland, OR IPCC: International Panel on Climate Change Established by the United Nations
Science Standard 1: Students analyze monthly precipitation and temperature records, displayed in bar charts, collected in metric units (mm).
.") Title: Precipitation Patterns across the Globe NSF GK-12 Fellow: Terry Legg Type of Lesson: STEM Grade Level(s): 4 th - 7 th grade This activity can be tailored to older, more advanced students by having
Title: Precipitation Patterns across the Globe NSF GK-12 Fellow: Terry Legg Type of Lesson: STEM Grade Level(s): 4 th - 7 th grade This activity can be tailored to older, more advanced students by having
The Climate of Oregon Climate Zone 5 High Plateau
 105 E55 Unbound issue i". 9 13oes not circulate CZe Special Report 917 May 1993 The Climate of Oregon Climate Zone 5 Property of OREGON STATE UNIVERSITY Library Serials Corvallis, OR 97331-4503 Agricultural
Highlights of the 2006 Water Year in Colorado
 Highlights of the 2006 Water Year in Colorado Nolan Doesken, State Climatologist Atmospheric Science Department Colorado State University http://ccc.atmos.colostate.edu Presented to 61 st Annual Meeting
Climate Science to Inform Climate Choices. Julia Slingo, Met Office Chief Scientist
 Climate Science to Inform Climate Choices Julia Slingo, Met Office Chief Scientist Taking the planet into uncharted territory Impacts of climate change will be felt most profoundly through hazardous weather
Tracking the Climate Of Northern Colorado Nolan Doesken State Climatologist Colorado Climate Center Colorado State University
 Tracking the Climate Of Northern Colorado Nolan Doesken State Climatologist Colorado Climate Center Colorado State University Northern Colorado Business Innovations November 20, 2013 Loveland, Colorado
Climate Change Projections for Newfoundland and Labrador Implications for Our Economy. NEIA Conference October 10 th 2013.
 Climate Change Projections for Newfoundland and Labrador Implications for Our Economy NEIA Conference October 10 th 2013 Jackie Janes, ADM Overview To provide a high-level overview of the climate change
Constructing a typical meteorological year -TMY for Voinesti fruit trees region and the effects of global warming on the orchard ecosystem
 Constructing a typical meteorological year -TMY for Voinesti fruit trees region and the effects of global warming on the orchard ecosystem ARMEANU ILEANA*, STĂNICĂ FLORIN**, PETREHUS VIOREL*** *University
Chiang Rai Province CC Threat overview AAS1109 Mekong ARCC
 Chiang Rai Province CC Threat overview AAS1109 Mekong ARCC This threat overview relies on projections of future climate change in the Mekong Basin for the period 2045-2069 compared to a baseline of 1980-2005.
An Introduc5on: Climate Change Adapta5on
 Dr. Joseph Hagg Science Officer Adapta/on Scotland An Introduc5on: Climate Change Adapta5on 13 th February 2013 contact: joseph.hagg@sepa.org.uk Adapta5on Scotland Partnership: Increase the resilience
National Remote Sensing Center of China. Space Technology for Sustainable Development in China Status, Achievements and Futures.
 National Remote Sensing Center of China Space Technology for Sustainable Development in China Status, Achievements and Futures Jing Li National Remote Sensing Center of China Ministry of Science and Technology,
Variability of Reference Evapotranspiration Across Nebraska
 Know how. Know now. EC733 Variability of Reference Evapotranspiration Across Nebraska Suat Irmak, Extension Soil and Water Resources and Irrigation Specialist Kari E. Skaggs, Research Associate, Biological
Global Climate Change and the Implications for Oklahoma. Gary McManus Associate State Climatologist Oklahoma Climatological Survey
 Global Climate Change and the Implications for Oklahoma Gary McManus Associate State Climatologist Oklahoma Climatological Survey Our previous stance on global warming Why the anxiety? Extreme Viewpoints!
Global Climates. Name Date
 Global Climates Name Date No investigation of the atmosphere is complete without examining the global distribution of the major atmospheric elements and the impact that humans have on weather and climate.
2015: A YEAR IN REVIEW F.S. ANSLOW
 2015: A YEAR IN REVIEW F.S. ANSLOW 1 INTRODUCTION Recently, three of the major centres for global climate monitoring determined with high confidence that 2015 was the warmest year on record, globally.
CGE TRAINING MATERIALS ON VULNERABILITY AND ADAPTATION ASSESSMENT. Climate change scenarios
 CGE TRAINING MATERIALS ON VULNERABILITY AND ADAPTATION ASSESSMENT Climate change scenarios Outline Climate change overview Observed climate data Why we use scenarios? Approach to scenario development Climate
2015 Fall Conditions Report
 2015 Fall Conditions Report Prepared by: Hydrologic Forecast Centre Date: December 21 st, 2015 Table of Contents Table of Figures... ii EXECUTIVE SUMMARY... 1 BACKGROUND... 2 SUMMER AND FALL PRECIPITATION...
Introduction to TIGGE and GIFS. Richard Swinbank, with thanks to members of GIFS-TIGGE WG & THORPEX IPO
 Introduction to TIGGE and GIFS Richard Swinbank, with thanks to members of GIFS-TIGGE WG & THORPEX IPO GIFS-TIGGE/NCAR/NOAA Workshop on EPS developments, June 2012 TIGGE THORPEX Interactive Grand Global
2003 Water Year Wrap-Up and Look Ahead
 2003 Water Year Wrap-Up and Look Ahead Nolan Doesken Colorado Climate Center Prepared by Odie Bliss http://ccc.atmos.colostate.edu Colorado Average Annual Precipitation Map South Platte Average Precipitation
Quenching the Valley s thirst: The connection between Sierra Nevada snowpack & regional water supply
 Quenching the Valley s thirst: The connection between Sierra Nevada snowpack & regional water supply Roger Bales, UC Merced Snow conditions Snow & climate change Research directions Sierra Nevada snow
Changing Hydrology under a Changing Climate for a Coastal Plain Watershed
 Changing Hydrology under a Changing Climate for a Coastal Plain Watershed David Bosch USDA-ARS, Tifton, GA Jeff Arnold ARS Temple, TX and Peter Allen Baylor University, TX SEWRU Objectives 1. Project changes
ZUMWALT WEATHER AND CLIMATE ANNUAL REPORT ( )
") ZUMWALT WEATHER AND CLIMATE ANNUAL REPORT (26-29) FINAL DRAFT (9 AUGUST 21) J.D. HANSEN 1, R.V. TAYLOR 2, AND V.S. JANSEN 3 INTRODUCTION The Zumwalt Prairie in northeastern Oregon is a unique grassland
ZUMWALT WEATHER AND CLIMATE ANNUAL REPORT (26-29) FINAL DRAFT (9 AUGUST 21) J.D. HANSEN 1, R.V. TAYLOR 2, AND V.S. JANSEN 3 INTRODUCTION The Zumwalt Prairie in northeastern Oregon is a unique grassland
Understanding Weather and Climate Risk. Matthew Perry Sharing an Uncertain World Conference The Geological Society, 13 July 2017
 Understanding Weather and Climate Risk Matthew Perry Sharing an Uncertain World Conference The Geological Society, 13 July 2017 What is risk in a weather and climate context? Hazard: something with the
Manitoba s Future Climate
 Climate Change Connection: Severe Weather in MB Workshop, 2 April 2013 Manitoba s Future Climate Danny Blair Associate Dean of Science, University of Winnipeg Professor of Geography Co-Chair, MB s Climate
Supplementary appendix
 Supplementary appendix This appendix formed part of the original submission and has been peer reviewed. We post it as supplied by the authors. Supplement to: Lowe R, Stewart-Ibarra AM, Petrova D, et al.
US Drought Status. Droughts 1/17/2013. Percent land area affected by Drought across US ( ) Dev Niyogi Associate Professor Dept of Agronomy
 Dev Niyogi Associate Professor Dept of Agronomy") Droughts US Drought Status Dev Niyogi Associate Professor Dept of Agronomy Deptof Earth Atmospheric Planetary Sciences Indiana State Climatologist Purdue University LANDSURFACE.ORG iclimate.org climate@purdue.edu
Droughts US Drought Status Dev Niyogi Associate Professor Dept of Agronomy Deptof Earth Atmospheric Planetary Sciences Indiana State Climatologist Purdue University LANDSURFACE.ORG iclimate.org climate@purdue.edu
ROCKY MOUNTAIN CLIMATE
 future PRECIPITATION in the denver MEtRO AREA By Stephen Saunders, Tom Easley, and Melissa Mezger A report by the Rocky Mountain Climate Organization To Denver Environmental Health June 2017 the ROCKY
DROUGHT IN MAINLAND PORTUGAL
 DROUGHT IN MAINLAND Ministério da Ciência, Tecnologia e Ensino Superior Instituto de Meteorologia, I. P. Rua C Aeroporto de Lisboa Tel.: (351) 21 844 7000 e-mail:informacoes@meteo.pt 1749-077 Lisboa Portugal
CLIMATE RESILIENCE FOR ALBERTA MUNICIPALITIES CLIMATE PROJECTIONS NORTHERN ALBERTA. Dr. Mel Reasoner Reasoner Environmental Consulting
 CLIMATE RESILIENCE FOR ALBERTA MUNICIPALITIES CLIMATE PROJECTIONS NORTHERN ALBERTA Dr. Mel Reasoner Reasoner Environmental Consulting Probability of occurrence Increase in Mean Temperature & Variance Less
SIS Meeting Oct AgriCLASS Agriculture CLimate Advisory ServiceS. Phil Beavis - Telespazio VEGA UK Indicators, Models and System Design
 1 SIS Meeting 17-19 Oct 2016 AgriCLASS Agriculture CLimate Advisory ServiceS Phil Beavis - Telespazio VEGA UK Indicators, Models and System Design Michael Sanderson - UK Met Office Climate Data and Weather
Weather and Climate of the Rogue Valley By Gregory V. Jones, Ph.D., Southern Oregon University
 Weather and Climate of the Rogue Valley By Gregory V. Jones, Ph.D., Southern Oregon University The Rogue Valley region is one of many intermountain valley areas along the west coast of the United States.
The Colorado Drought of 2002 in Perspective
 The Colorado Drought of 2002 in Perspective Colorado Climate Center Nolan Doesken and Roger Pielke, Sr. Prepared by Tara Green and Odie Bliss http://climate.atmos.colostate.edu Known Characteristics of
CWV Review London Weather Station Move
 CWV Review London Weather Station Move 6th November 26 Demand Estimation Sub-Committee Background The current composite weather variables (CWVs) for North Thames (NT), Eastern (EA) and South Eastern (SE)
Midwest and Great Plains Climate and Drought Update
 Midwest and Great Plains Climate and Drought Update June 20,2013 Laura Edwards Climate Field Specialist Laura.edwards@sdstate.edu 605-626-2870 2012 Board of Regents, South Dakota State University General
Fire Season Prediction for Canada, Kerry Anderson Canadian Forest Service
 Fire Season Prediction for Canada, 2014 Kerry Anderson Canadian Forest Service 1 Introduction The Canadian Forest Service is now presenting monthly and seasonal forecast maps through the Canadian Wildland
AFAC 2006 page 536. Climate-Change Impacts on fire-weather in SE Australia Kevin Hennessy, Principal Research Scientist, CSIRO
 AFAC 2006 page 536 Climate-Change Impacts on fire-weather in SE Australia Kevin Hennessy, Principal Research Scientist, CSIRO AFAC 2006 page 537 Climate change impacts on fire-weather risk in south-east
OVERVIEW OF IMPROVED USE OF RS INDICATORS AT INAM. Domingos Mosquito Patricio
 OVERVIEW OF IMPROVED USE OF RS INDICATORS AT INAM Domingos Mosquito Patricio domingos.mosquito@gmail.com Introduction to Mozambique /INAM Introduction to AGRICAB/SPIRITS Objectives Material & Methods Results
The Climate of Oregon Climate Zone 4 Northern Cascades
 /05 E55 Unbound issue No. 9/ is Does not circulate Special Report 916 May 1993 The Climate of Oregon Climate Zone 4 Property of OREGON STATE UNIVERSITY Library Serials Corvallis, OR 97331-4503 Agricultural
Long-range Forecast of Climate Change: Sri Lanka Future Scenario. G. B. Samarasinghe Director General of Meteorology
 Long-range Forecast of Climate Change: Sri Lanka Future Scenario G. B. Samarasinghe Director General of Meteorology 1 Line-up Global and Regional Future Scenarios Observed and Potential Impacts Observed
Seasonal Hydrometeorological Ensemble Prediction System: Forecast of Irrigation Potentials in Denmark
 Seasonal Hydrometeorological Ensemble Prediction System: Forecast of Irrigation Potentials in Denmark Diana Lucatero 1*, Henrik Madsen 2, Karsten H. Jensen 1, Jens C. Refsgaard 3, Jacob Kidmose 3 1 University
EXPERT MEETING TO ASSESS PROGRESS MADE IN THE PROCESS TO FORMULATE AND IMPLEMENT ANATIONAL ADAPTATION PANS (NAPs)
") EXPERT MEETING TO ASSESS PROGRESS MADE IN THE PROCESS TO FORMULATE AND IMPLEMENT ANATIONAL ADAPTATION PANS (NAPs) LESOTHO'S EXPERIENCE MOKOENA FRANCE MINISTRY OF ENERGY AND METEOROLOGY OUTLINE Key Risks
EXPERT MEETING TO ASSESS PROGRESS MADE IN THE PROCESS TO FORMULATE AND IMPLEMENT ANATIONAL ADAPTATION PANS (NAPs) LESOTHO'S EXPERIENCE MOKOENA FRANCE MINISTRY OF ENERGY AND METEOROLOGY OUTLINE Key Risks
CLIMATE IMPACTS TO INFRASTRUCTURE ENHANCING CLIMATE RESILIENCY FOR MANITOBA INFRASTRUCTURE
 CLIMATE IMPACTS TO INFRASTRUCTURE ENHANCING CLIMATE RESILIENCY FOR MANITOBA INFRASTRUCTURE Heather Auld, Neil Comer, Simon Eng, Erik Sparling Manitoba: Climate Impacts on Infrastructure - OUTLINE of TALK
In this activity, students will compare weather data from to determine if there is a warming trend in their community.
 Overview: In this activity, students will compare weather data from 1910-2000 to determine if there is a warming trend in their community. Objectives: The student will: use the Internet to locate scientific
CATCHMENT DESCRIPTION. Little River Catchment Management Plan Stage I Report Climate 4.0
 CATCHMENT DESCRIPTION Little River Catchment Management Plan Stage I Report Climate 4. Little River Catchment Management Plan Stage I Report Climate 4.1 4. CLIMATE 4.1 INTRODUCTION Climate is one of the
Decadal Changes of Rainfall and Temperature Extremes over the different Agro Economical Zones (AEZ) of Bangladesh
 of Bangladesh") Decadal Changes of Rainfall and Temperature Extremes over the different Agro Economical Zones (AEZ) of Bangladesh Professor A.K.M. Saiful Islam Md. Alfi Hasan Institute of Water and Flood Management Bangladesh
Decadal Changes of Rainfall and Temperature Extremes over the different Agro Economical Zones (AEZ) of Bangladesh Professor A.K.M. Saiful Islam Md. Alfi Hasan Institute of Water and Flood Management Bangladesh
Local Climate Change Impacts for Central Illinois
 Local Climate Change Impacts for Central Illinois Molly Woloszyn Extension Climatologist Midwestern Regional Climate Center & Illinois-Indiana Sea Grant Urbana Sustainability Advisory Commission February
Champaign-Urbana 2000 Annual Weather Summary
 Champaign-Urbana 2000 Annual Weather Summary ILLINOIS STATE WATER SURVEY 2204 Griffith Dr. Champaign, IL 61820 wxobsrvr@sws.uiuc.edu Maria Peters, Weather Observer January: January started on a mild note,
Climatography of the United States No
 Climate Division: AK 5 NWS Call Sign: ANC Month (1) Min (2) Month(1) Extremes Lowest (2) Temperature ( F) Lowest Month(1) Degree s (1) Base Temp 65 Heating Cooling 90 Number of s (3) Jan 22.2 9.3 15.8
Three main areas of work:
 Task 2: Climate Information 1 Task 2: Climate Information Three main areas of work: Collect historical and projected weather and climate data Conduct storm surge and wave modeling, sea-level rise (SLR)
Future Weather in Toronto and the GTA
 Future Weather in Toronto and the GTA Due to Climate Change Electrical Sector Meeting, Nov. 23 rd, 2011 Christopher Ll. Morgan, PhD Toronto Environment Office Contents 2 Introduction (Why We Did What We
SAWIDRA Southern Africa
 SAWIDRA Southern Africa Presenter: Thembani Moitlhobogi Assistant Database and IT Expert SADC Climate Services Centre 13 th EUMETSAT Forum in Africa 24-28 September 2018, Abidjan, Cote d Ivoire Context
Climate Change in the Northeast: Past, Present, and Future
 Climate Change in the Northeast: Past, Present, and Future Dr. Cameron Wake Institute for the Study of Earth, Oceans, and Space (EOS) University of New Hampshire 62nd Annual Meeting of the Northeastern
CLIPDAR -- DESIGN GUIDELINE FOR A CLIMATE PROJECTION DATA BASE AND SPECIFIC CLIMATE
 CEDR Transnational Road Research Programme Call 2012 Road owners adapting to Climate Change CLIPDAR -- DESIGN GUIDELINE FOR A CLIMATE PROJECTION DATA BASE AND SPECIFIC CLIMATE INDICES FOR ROADS CHRISTOPH
Climate Summary for the Northern Rockies Adaptation Partnership
 Climate Summary for the Northern Rockies Adaptation Partnership Compiled by: Linda Joyce 1, Marian Talbert 2, Darrin Sharp 3, John Stevenson 4 and Jeff Morisette 2 1 USFS Rocky Mountain Research Station
TILT, DAYLIGHT AND SEASONS WORKSHEET
 TILT, DAYLIGHT AND SEASONS WORKSHEET Activity Description: Students will use a data table to make a graph for the length of day and average high temperature in Utah. They will then answer questions based
Climate Change Impact Analysis
 Climate Change Impact Analysis Patrick Breach M.E.Sc Candidate pbreach@uwo.ca Outline July 2, 2014 Global Climate Models (GCMs) Selecting GCMs Downscaling GCM Data KNN-CAD Weather Generator KNN-CADV4 Example
Study of Changes in Climate Parameters at Regional Level: Indian Scenarios
 Study of Changes in Climate Parameters at Regional Level: Indian Scenarios S K Dash Centre for Atmospheric Sciences Indian Institute of Technology Delhi Climate Change and Animal Populations - The golden
Meteorological alert system in NMS of Mongolia
 Meteorological alert system in NMS of Mongolia L.Oyunjargal, NAMEM Regional Workshop on Impact-based Forecasts in Asia Seoul, Korea, 07-09 NOV 2017 Weather related disasters 1. Strong wind and snow and
The Copernicus Climate Change (C3) service: State of play
 service: State of play") Enterprise and Industry The Copernicus Climate Change (C3) service: State of play B. Pinty (a) & J-N. Thépaut (b) (a) Copernicus G.2 unit (b) ECMWF CCI October2014 Legal frame & MS consultations Publica6on
Enterprise and Industry The Copernicus Climate Change (C3) service: State of play B. Pinty (a) & J-N. Thépaut (b) (a) Copernicus G.2 unit (b) ECMWF CCI October2014 Legal frame & MS consultations Publica6on
Sierra Weather and Climate Update
 Sierra Weather and Climate Update 2014-15 Kelly Redmond Western Regional Climate Center Desert Research Institute Reno Nevada Yosemite Hydroclimate Workshop Yosemite Valley, 2015 October 8-9 Percent of
A Report on a Statistical Model to Forecast Seasonal Inflows to Cowichan Lake
 A Report on a Statistical Model to Forecast Seasonal Inflows to Cowichan Lake Prepared by: Allan Chapman, MSc, PGeo Hydrologist, Chapman Geoscience Ltd., and Former Head, BC River Forecast Centre Victoria
The Climate of Bryan County
 The Climate of Bryan County Bryan County is part of the Crosstimbers throughout most of the county. The extreme eastern portions of Bryan County are part of the Cypress Swamp and Forest. Average annual
The Climate of Oregon Climate Zone 3 Southwest Interior
 .k) 105 Unbound issue " " 1 4oes not circulate C4P. Special Report 915 May 1993 The Climate of Oregon Climate Zone 3 Southwest Interior Property of OREGON STATE UNIVERSITY Library Serials Corvallis, OR
Statistically Downscaled Climate Projections of Temperature, Precipitation, and Snow for Wisconsin. Michael Notaro
 Statistically Downscaled Climate Projections of Temperature, Precipitation, and Snow for Wisconsin Michael Notaro Associate Scientist Center for Climatic Research University of Wisconsin-Madison mnotaro@wisc.edu
DOWNSCALING INTERCOMPARISON PROJECT SUMMARY REPORT
 DOWNSCALING INTERCOMPARISON PROJECT SUMMARY REPORT 1 DOWNSCALING INTERCOMPARISON PROJECT Method tests and future climate projections The Pacific Climate Impacts Consortium (PCIC) recently tested a variety
The Climate of Grady County
 The Climate of Grady County Grady County is part of the Central Great Plains, encompassing some of the best agricultural land in Oklahoma. Average annual precipitation ranges from about 33 inches in northern
2016 Meteorology Summary
 2016 Meteorology Summary New Jersey Department of Environmental Protection AIR POLLUTION AND METEOROLOGY Meteorology plays an important role in the distribution of pollution throughout the troposphere,
YACT (Yet Another Climate Tool)? The SPI Explorer
? The SPI Explorer") YACT (Yet Another Climate Tool)? The SPI Explorer Mike Crimmins Assoc. Professor/Extension Specialist Dept. of Soil, Water, & Environmental Science The University of Arizona Yes, another climate tool for
YACT (Yet Another Climate Tool)? The SPI Explorer Mike Crimmins Assoc. Professor/Extension Specialist Dept. of Soil, Water, & Environmental Science The University of Arizona Yes, another climate tool for
Operational Practices in South African Weather Service (SAWS)
") Operational Practices in South African Weather Service (SAWS) Abiodun Adeola, Hannes Rautenbach, Cobus Olivier 2018/06/12 1 Overview Seasonal Forecasting System at SAWS How to Interpret Seasonal Forecasts
Operational Practices in South African Weather Service (SAWS) Abiodun Adeola, Hannes Rautenbach, Cobus Olivier 2018/06/12 1 Overview Seasonal Forecasting System at SAWS How to Interpret Seasonal Forecasts
Use of climate reanalysis for EEA climate change assessment. Blaz Kurnik. European Environment Agency (EEA)
") Use of climate reanalysis for EEA climate change assessment Blaz Kurnik European Environment Agency (EEA) 2016: EEA content priorities Circular economy Climate and Energy Sustainable Development Goals
Use of climate reanalysis for EEA climate change assessment Blaz Kurnik European Environment Agency (EEA) 2016: EEA content priorities Circular economy Climate and Energy Sustainable Development Goals
In Centre, Online Classroom Live and Online Classroom Programme Prices
 In Centre, and Online Classroom Programme Prices In Centre Online Classroom Foundation Certificate Bookkeeping Transactions 430 325 300 Bookkeeping Controls 320 245 225 Elements of Costing 320 245 225
The Climate of Murray County
 The Climate of Murray County Murray County is part of the Crosstimbers. This region is a transition between prairies and the mountains of southeastern Oklahoma. Average annual precipitation ranges from
Will a warmer world change Queensland s rainfall?
 Will a warmer world change Queensland s rainfall? Nicholas P. Klingaman National Centre for Atmospheric Science-Climate Walker Institute for Climate System Research University of Reading The Walker-QCCCE
Summary report for Ruamāhanga Whaitua Committee The climate of the Ruamāhanga catchment
 Summary report for Ruamāhanga Whaitua Committee The climate of the Ruamāhanga catchment The Tararua and Rimutaka ranges have a large influence on the climate of the Ruamāhanga catchment. The ranges shelter
LEVERAGING DWFI RESOURCES TO ADDRESS WATER FOR AGRICULTURE IN LATIN AMERICA UNDER A CHANGING CLIMATE
 LEVERAGING DWFI RESOURCES TO ADDRESS WATER FOR AGRICULTURE IN LATIN AMERICA UNDER A CHANGING CLIMATE Rachindra Mawalagedara Robert J. Oglesby Presented at the DWFI Student Support Research Forum, May 12,
Drought Characterization. Examination of Extreme Precipitation Events
 Drought Characterization Examination of Extreme Precipitation Events Extreme Precipitation Events During the Drought For the drought years (1999-2005) daily precipitation data was analyzed to find extreme
Climate Change in Newfoundland & Labrador
 Climate Change in Newfoundland & Labrador Impacts and Adaptation Newleef Conference 08 October 2015 Met-Ocean Services The Team 55 personnel; 24/7 operational weather forecast desk; Equipment technician
The Climate of Payne County
 The Climate of Payne County Payne County is part of the Central Great Plains in the west, encompassing some of the best agricultural land in Oklahoma. Payne County is also part of the Crosstimbers in the
The Climate of Kiowa County
 The Climate of Kiowa County Kiowa County is part of the Central Great Plains, encompassing some of the best agricultural land in Oklahoma. Average annual precipitation ranges from about 24 inches in northwestern
The ENSEMBLES Project
 The ENSEMBLES Project Providing ensemble-based predictions of climate changes and their impacts by Dr. Chris Hewitt Abstract The main objective of the ENSEMBLES project is to provide probabilistic estimates
DROUGHT INDICES BEING USED FOR THE GREATER HORN OF AFRICA (GHA)
") DROUGHT INDICES BEING USED FOR THE GREATER HORN OF AFRICA (GHA) Christopher Oludhe IGAD Climate Prediction and Applications Centre (ICPAC) Inter-Regional Workshop on Indices and Early Warning Systems for
DROUGHT INDICES BEING USED FOR THE GREATER HORN OF AFRICA (GHA) Christopher Oludhe IGAD Climate Prediction and Applications Centre (ICPAC) Inter-Regional Workshop on Indices and Early Warning Systems for
Coupling of Diurnal Climate to Clouds, Land-use and Snow
 Coupling of Diurnal Climate to Clouds, Land-use and Snow Alan K. Betts akbetts@aol.com http://alanbetts.com Co-authors: Ray Desjardins, Devon Worth, Darrel Cerkowniak Agriculture and Agri-Food Canada Shusen
HAIDA GWAII CLIMATE ASSESSMENT 2010 Special Report for MIEDS Franc Pridoehl
 HAIDA GWAII CLIMATE ASSESSMENT 2010 Special Report for MIEDS Franc Pridoehl INTRODUCTION Climatic conditions have varied considerably on Haida Gwaii over the past centuries and millennia (Hebda 2007).
Introduction. 2. Pilot Project 1. EWE. Users. Development of an early warning system for agriculture. User Interface Platform (UIP)
") Introduction 2. Pilot Project Development of an early warning system for agriculture 1. EWE Early Warning Information on Extreme Weather User Interface Platform (UIP) Climate Services Information System
Introduction 2. Pilot Project Development of an early warning system for agriculture 1. EWE Early Warning Information on Extreme Weather User Interface Platform (UIP) Climate Services Information System
Analysis of Historical Pattern of Rainfall in the Western Region of Bangladesh
 24 25 April 214, Asian University for Women, Bangladesh Analysis of Historical Pattern of Rainfall in the Western Region of Bangladesh Md. Tanvir Alam 1*, Tanni Sarker 2 1,2 Department of Civil Engineering,
Alberto Troccoli, Head of Weather and Energy Research Unit, CSIRO, Australia ICCS 2013 Jamaica, 5 December 2013 (remotely, unfortunately)
") 013 Alberto Troccoli, Head of Weather and Energy Research Unit, CSIRO, Australia ICCS 013 Jamaica, 5 December 013 (remotely, unfortunately) Historical and projected changes in World primary energy demand
013 Alberto Troccoli, Head of Weather and Energy Research Unit, CSIRO, Australia ICCS 013 Jamaica, 5 December 013 (remotely, unfortunately) Historical and projected changes in World primary energy demand
Climatography of the United States No
 Month (1) Min (2) Month(1) Extremes Lowest (2) Temperature ( F) Lowest Month(1) Degree s (1) Base Temp 65 Heating Cooling 100 Number of s (3) Jan 63.9 39.3 51.6 86 1976 16 56.6 1986 20 1976 2 47.5 1973
Climatography of the United States No
 Temperature ( F) Month (1) Min (2) Month(1) Extremes Lowest (2) Lowest Month(1) Degree s (1) Base Temp 65 Heating Cooling 100 Number of s (3) Jan 32.8 21.7 27.3 62 1918 1 35.8 1983-24 1950 29 10.5 1979