Tracking the Climate Of Northern Colorado Nolan Doesken State Climatologist Colorado Climate Center Colorado State University
|
|
|
- Candice Long
- 5 years ago
- Views:
Transcription

1 Tracking the Climate Of Northern Colorado Nolan Doesken State Climatologist Colorado Climate Center Colorado State University Northern Colorado Business Innovations November 20, 2013 Loveland, Colorado So... How are we faring this ye

2 Our Climate is an essential natural resource Temperature Humidity Wind Sunshine Precipitation Storms Extremes Rapid changes


3 First -- A short background In 1973 the federal government abolished the State Climatologist program nationwide leaving Colorado without Later that same year, Colorado re-established the State Climate program with support through the Colorado Agricultural Experiment Station at Colorado State University.
4 Colorado Climate Center Mission The Colorado Climate Center at CSU provides valuable climate expertise to the residents of the state through its threefold program of: 1) Climate Monitoring (data acquisition, analysis, and archiving), 2) Climate Research 3) Climate Services.(providing data, analysis, climate education and outreach)

5 Monitoring our Climate Elements: temperature, precipitation, snow, wind, solar, evaporation, soil temperatures, humidity, clouds, etc. Fort Collins Historic Weather Station. Continuous monitoring on CSU campus since the 1880s
6

7 There is good news -- The basics of our climate are not changing.

8 High elevation (highest state in the Union by far) Mid-Latitude location (lively seasonal changes) Interior Continental Location far from atmospheric moisture sources Complex Mountain topography Solar energy and seasonal cycles drive our climate


9 Colorado has and will continue to be a bright and sunny place most of the time and we ll not be too hot or too cold most of the time National Renewal Energy Laboratory:
10 Temperature (deg Fahrenheit) Winters will still be colder than summers Average Monthly Temperature ( ) for Selected Station Grand Junction Delta Palisade Collbran Vail Climax Jan Feb Mar Apr May Jun Jul Aug Sep Oct Nov Dec

11 Actual daily temperatures will always be much more variable than the nice smooth monthly averages

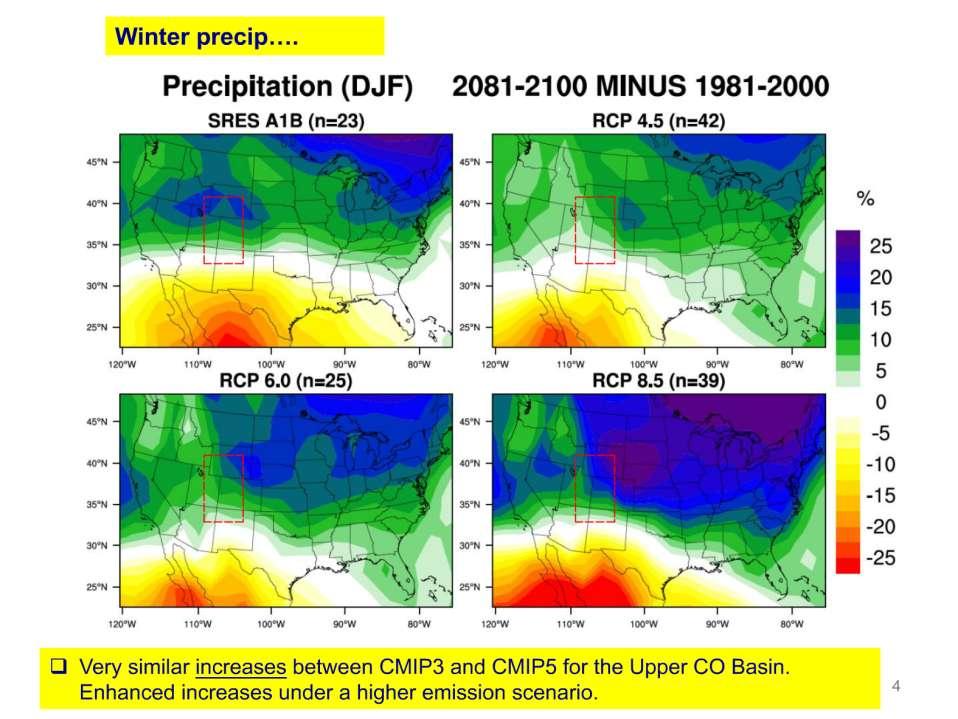
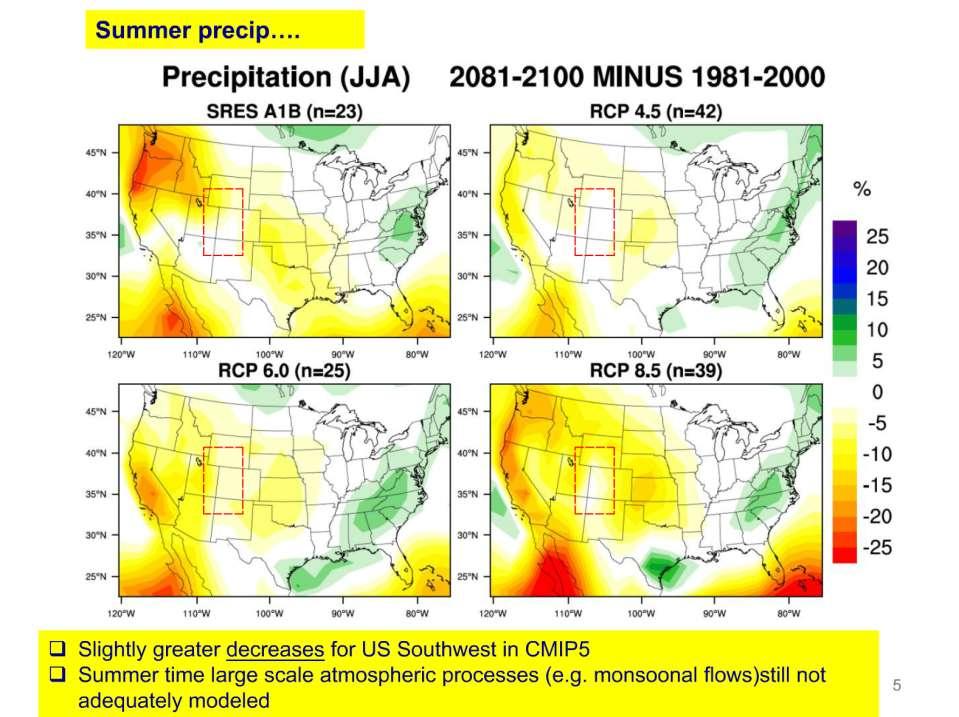
12 We ll still get rain and snow but often not enough
13 Precipitation (inches) Precipitation in Colorado will still vary greatly from place to place with changing seasons Water Year Average Precipitation for Selected Stations 5.0 Grand Junction Vail Vail Pass Georgetown Denver Burlington Oct Nov Dec Jan Feb Mar Apr May Jun Jul Aug Sep

14 Variability will drive us crazy and keep us humble No two years are ever the same
15
16 We ll think about paying good money for long-range forecasts, but those forecasts still won t be great El Nino periods La Nina periods

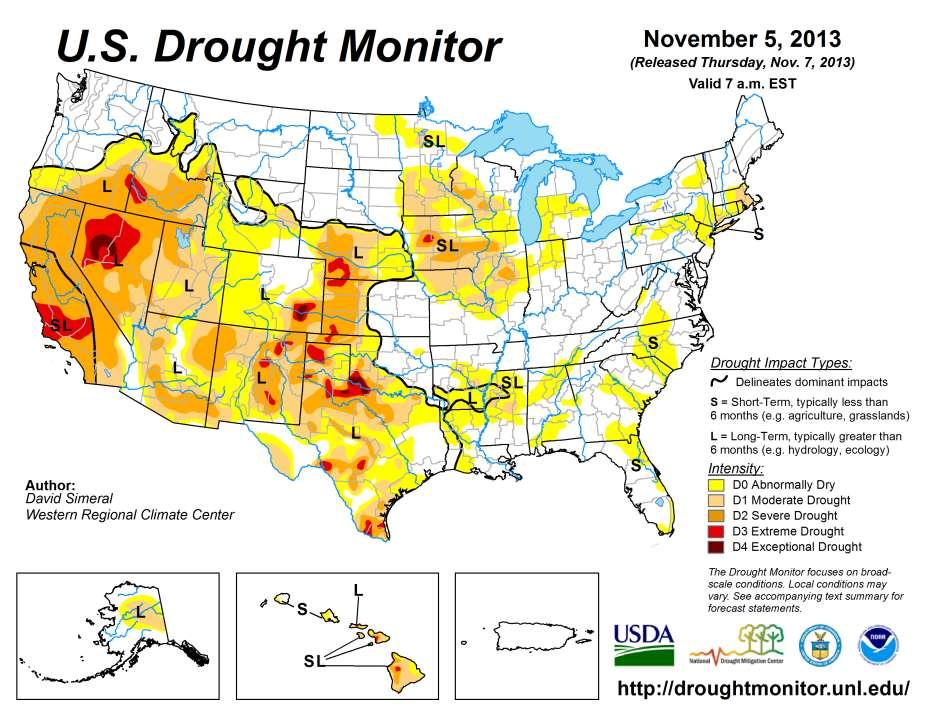
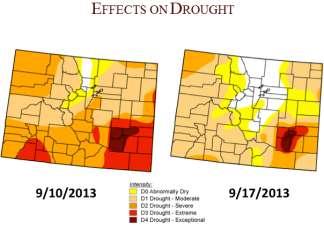
17 And sometimes Drought will just about put us under and make us really irritable Photo by Lyric Lucero 2013 Manzanola, CO


18 Impacts from drought may be perilous at time
19
20
21

22 If the basics of our climate are not changing much, is there a valid reason to still be concerned? My answer is YES

23 Here is our challenge
24

25 The changes we ve observed so far in our local climate are fairly modest and masked by year to year variations
26
27
28

29 We can tolerate warmer temperatures But only if our water supplies hold out
30
31

32 Lake Powell Historic Water Level

33 Lake Granby Historic Water Level

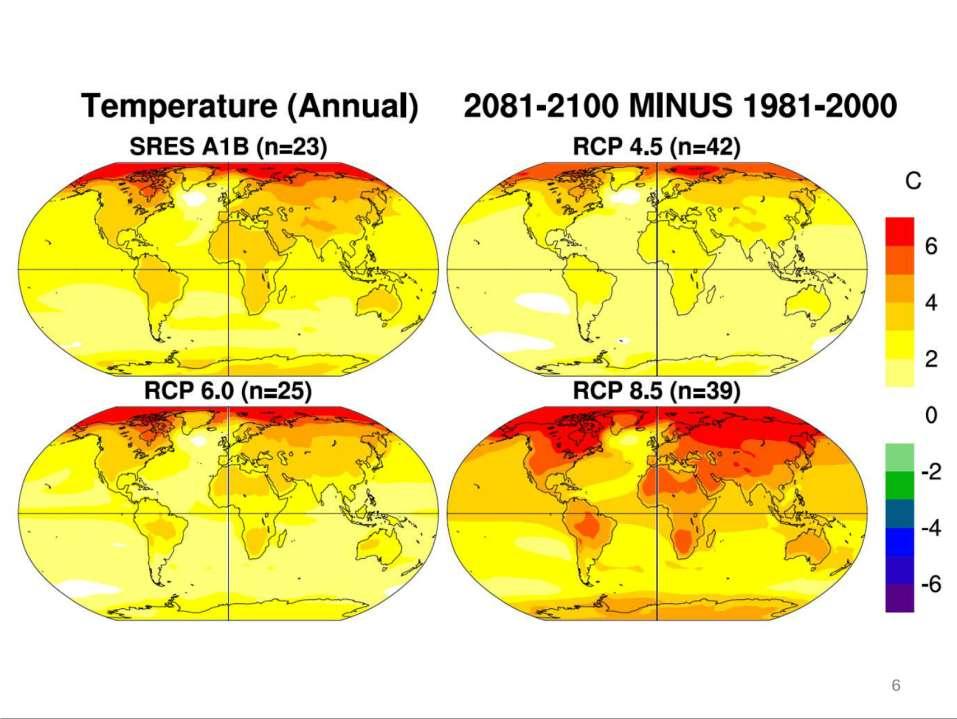
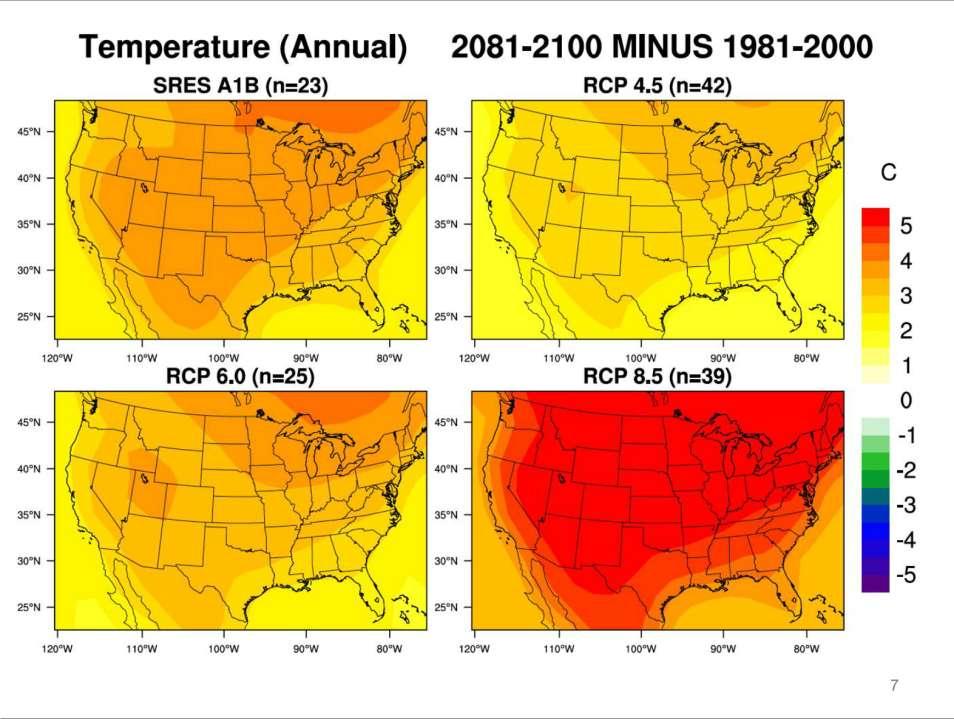
34 What comes next is sure to be very interesting
35 65 F Projected annual temperatures, for northern Colorado, including Denver Ensemble of 16 GCMs (CMIP3), medium (A1B) emissions scenario (white line = ensemble median) 60 F 55 F 50 F +4ºF by 2050 vs Observed temp. 45 F ºF by 2100 Source: Jeff Lukas, Western Water Assessment; Projections data available from Observed data available from PRISM,
36
37
38
39
40
41

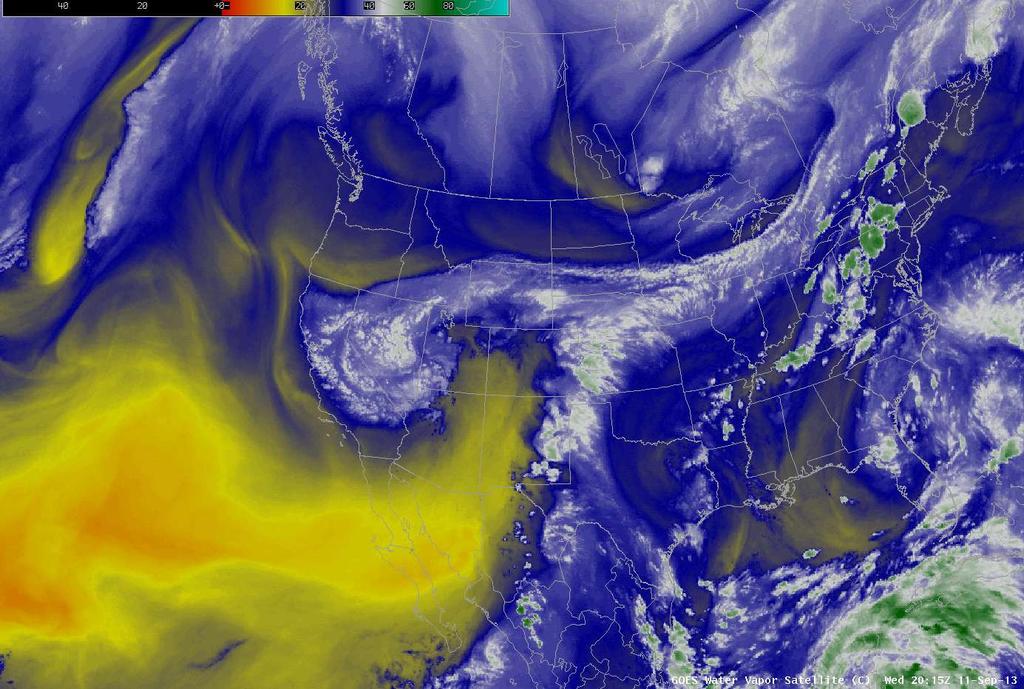
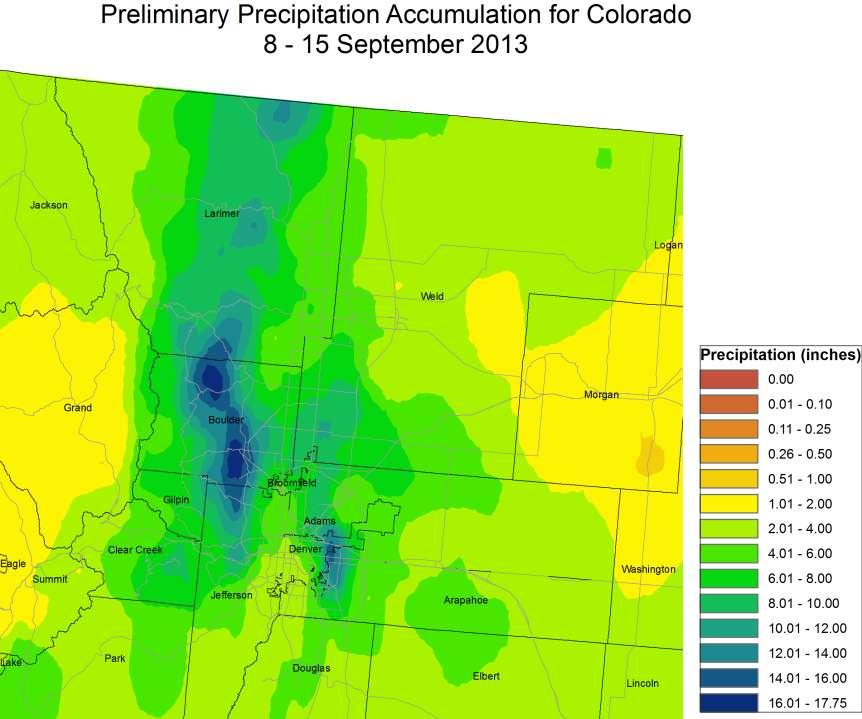
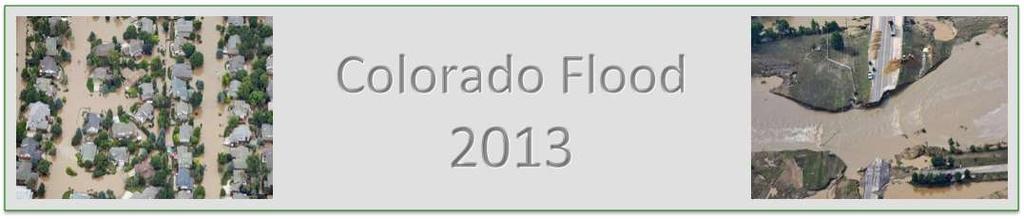
42 How do our recent floods fit in? Credit: Henry Reges


43 1904 Poudre River Flood, Greeley, CO With or without climate change we ve had floods before Railroad tracks on N. College Ave. Credit: City of Fort Collins

44 Credit: Denver Public Library Digital Collections June 1921 Pueblo Flood

45 1935 Republican River Flood Credit: National Weather Service- Goodland, KS

46 September 1938 Flood in Eldorado Springs, CO Some Similarity to September 2013 Photo copyright by the Denver Public Library.


47 Credit: Colorado State University Library Flooding on Colorado State University Campus, 1938

48 1965 Flooding on South Platte River Credit: Denver Post

49 1976 Big Thompson Flood Credit: Denver Post


50 1997 Fort Collins Flood Credit: coloradoan.com

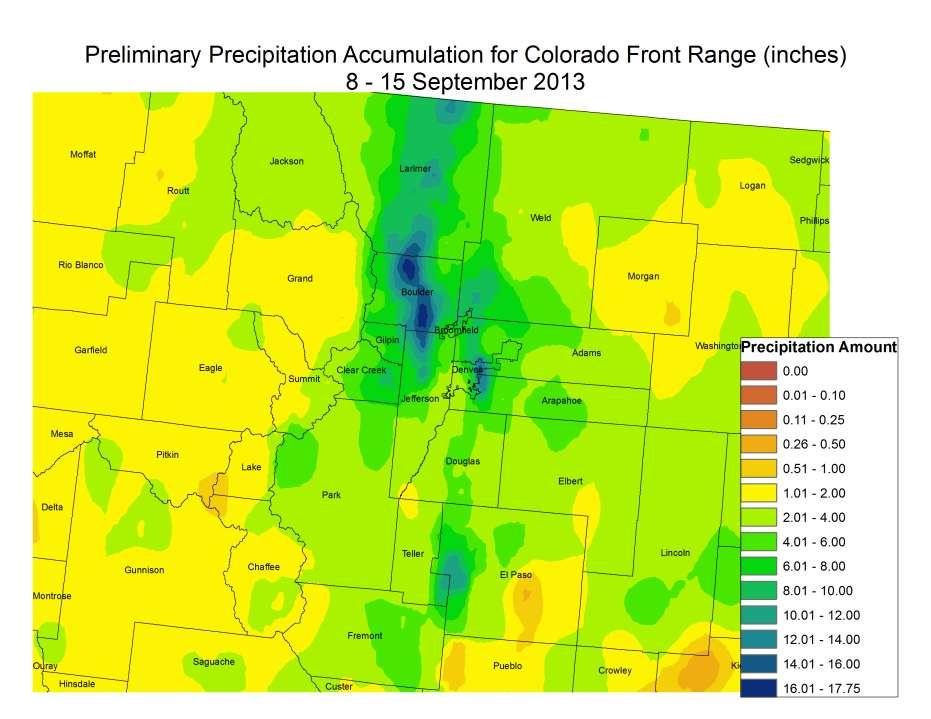
51 But what we just had was Big

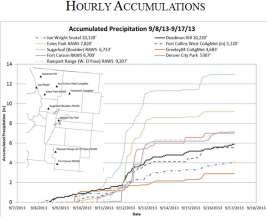
52 Total Atmospheric Precipitable water over Denver from
53
54
55
56
57
58
59
60
61
62

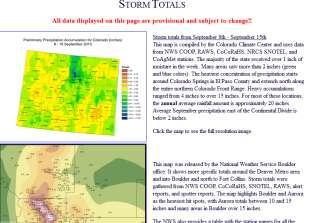
63 September Precipitation (inches)
64 Top 10 Years: 1. September May November April July/August March July June October April 1944

65 New content is still being added: Photos, resources and more Bookmark and share with friends!
66 September 2013 Colorado Floods Rainfall Report Coming Soon


67 Colorado Climate Center Department of Atmospheric Science Colorado State University
Applications/Users for Improved S2S Forecasts
 Applications/Users for Improved S2S Forecasts Nolan Doesken Colorado Climate Center Colorado State University WSWC Precipitation Forecasting Workshop June 7-9, 2016 San Diego, CA First -- A short background
Let s Talk Climate! Nolan Doesken Colorado Climate Center Colorado State University. Yampatika Seminar February 16, 2011 Steamboat Springs, Colorado
 Let s Talk Climate! Nolan Doesken Colorado Climate Center Colorado State University Yampatika Seminar February 16, 2011 Steamboat Springs, Colorado First -- A short background In 1973 the federal government
Funding provided by NOAA Sectoral Applications Research Project CLIMATE. Basic Climatology Colorado Climate Center
 Funding provided by NOAA Sectoral Applications Research Project CLIMATE Basic Climatology Colorado Climate Center Remember These? Factor 1: Our Energy Source Factor 2: Revolution & Tilt Factor 3: Rotation!
2003 Water Year Wrap-Up and Look Ahead
 2003 Water Year Wrap-Up and Look Ahead Nolan Doesken Colorado Climate Center Prepared by Odie Bliss http://ccc.atmos.colostate.edu Colorado Average Annual Precipitation Map South Platte Average Precipitation
Taking the Pulse of Colorado s Climate
 Taking the Pulse of Colorado s Climate Nolan Doesken State Climatologist, Colorado Climate Center Atmospheric Science Department Colorado State University Presented 5 May 2012 Univ. of Colorado, Boulder,
Taking the Pulse of Colorado s Climate
 Taking the Pulse of Colorado s Climate Nolan Doesken State Climatologist, Colorado Climate Center Atmospheric Science Department Colorado State University Presented 5 August 2011 Colorado State University,
Colorado s AMAZING Climate
 Colorado s AMAZING Climate Nolan Doesken, State Climatologist Colorado Climate Center Atmospheric Science Department Colorado State University Fort Collins, CO Graphics assistance provided by Wendy Ryan,
Colorado s 2003 Moisture Outlook
 Colorado s 2003 Moisture Outlook Nolan Doesken and Roger Pielke, Sr. Colorado Climate Center Prepared by Tara Green and Odie Bliss http://climate.atmos.colostate.edu How we got into this drought! Fort
2003 Moisture Outlook
 2003 Moisture Outlook Nolan Doesken and Roger Pielke, Sr. Colorado Climate Center Prepared by Tara Green and Odie Bliss http://climate.atmos.colostate.edu Through 1999 Through 1999 Fort Collins Total Water
CoCoRaHS Monitoring Colorado s s Water Resources through Community Collaborations
 CoCoRaHS Monitoring Colorado s s Water Resources through Community Collaborations Nolan Doesken Colorado Climate Center Atmospheric Science Department Colorado State University Presented at Sustaining
Highlights of the 2006 Water Year in Colorado
 Highlights of the 2006 Water Year in Colorado Nolan Doesken, State Climatologist Atmospheric Science Department Colorado State University http://ccc.atmos.colostate.edu Presented to 61 st Annual Meeting
What Does It Take to Get Out of Drought?
 What Does It Take to Get Out of Drought? Nolan J. Doesken Colorado Climate Center Colorado State University http://ccc.atmos.colostate.edu Presented at the Insects, Diseases and Drought Workshop, May 19,
Drought in Southeast Colorado
 Drought in Southeast Colorado Nolan Doesken and Roger Pielke, Sr. Colorado Climate Center Prepared by Tara Green and Odie Bliss http://climate.atmos.colostate.edu 1 Historical Perspective on Drought Tourism
A Review of the 2007 Water Year in Colorado
 A Review of the 2007 Water Year in Colorado Nolan Doesken Colorado Climate Center, CSU Mike Gillespie Snow Survey Division, USDA, NRCS Presented at the 28 th Annual AGU Hydrology Days, March 26, 2008,
The Colorado Climate Center at CSU. residents of the state through its threefold
 The CoAgMet Network: Overview History and How It Overview, Works N l Doesken Nolan D k and d Wendy W d Ryan R Colorado Climate Center Colorado State University First -- A short background In 1973 the federal
Climate Update. Wendy Ryan and Nolan Doesken Colorado Climate Center. Atmospheric Science Department Colorado State University
 Climate Update Wendy Ryan and Nolan Doesken Colorado Climate Center Atmospheric Science Department Colorado State University Presented to Water Availability Task Force June 26, 2008 Denver, CO Prepared
The Climate of Oregon Climate Zone 4 Northern Cascades
 /05 E55 Unbound issue No. 9/ is Does not circulate Special Report 916 May 1993 The Climate of Oregon Climate Zone 4 Property of OREGON STATE UNIVERSITY Library Serials Corvallis, OR 97331-4503 Agricultural
The Colorado Drought of 2002 in Perspective
 The Colorado Drought of 2002 in Perspective Colorado Climate Center Nolan Doesken and Roger Pielke, Sr. Prepared by Tara Green and Odie Bliss http://climate.atmos.colostate.edu Known Characteristics of
Colorado weather and climate update: a bit more than halfway through the water year (Or: What s going on with the weather?? )
") Colorado weather and climate update: a bit more than halfway through the water year (Or: What s going on with the weather?? ) Russ S. Schumacher Colorado State Climatologist Director, Colorado Climate
Colorado weather and climate update: a bit more than halfway through the water year (Or: What s going on with the weather?? ) Russ S. Schumacher Colorado State Climatologist Director, Colorado Climate
Chiang Rai Province CC Threat overview AAS1109 Mekong ARCC
 Chiang Rai Province CC Threat overview AAS1109 Mekong ARCC This threat overview relies on projections of future climate change in the Mekong Basin for the period 2045-2069 compared to a baseline of 1980-2005.
The Climate of Payne County
 The Climate of Payne County Payne County is part of the Central Great Plains in the west, encompassing some of the best agricultural land in Oklahoma. Payne County is also part of the Crosstimbers in the
The Climate of Marshall County
 The Climate of Marshall County Marshall County is part of the Crosstimbers. This region is a transition region from the Central Great Plains to the more irregular terrain of southeastern Oklahoma. Average
The Climate of Murray County
 The Climate of Murray County Murray County is part of the Crosstimbers. This region is a transition between prairies and the mountains of southeastern Oklahoma. Average annual precipitation ranges from
Long-term Precipitation Trends in Colorado. Nolan Doesken Colorado State Climatologist Presented: Friday, December 12, 2008
 Long-term Precipitation Trends in Colorado Nolan Doesken Colorado State Climatologist Presented: Friday, December 12, 28 Colorado Mean Annual Precipitation (1971-2) Of All Our Climate Observing Stations
The Climate of Grady County
 The Climate of Grady County Grady County is part of the Central Great Plains, encompassing some of the best agricultural land in Oklahoma. Average annual precipitation ranges from about 33 inches in northern
The Climate of Seminole County
 The Climate of Seminole County Seminole County is part of the Crosstimbers. This region is a transition region from the Central Great Plains to the more irregular terrain of southeastern Oklahoma. Average
The Climate of Texas County
 The Climate of Texas County Texas County is part of the Western High Plains in the north and west and the Southwestern Tablelands in the east. The Western High Plains are characterized by abundant cropland
The Climate of Pontotoc County
 The Climate of Pontotoc County Pontotoc County is part of the Crosstimbers. This region is a transition region from the Central Great Plains to the more irregular terrain of southeast Oklahoma. Average
The Climate of Haskell County
 The Climate of Haskell County Haskell County is part of the Hardwood Forest. The Hardwood Forest is characterized by its irregular landscape and the largest lake in Oklahoma, Lake Eufaula. Average annual
Presentation Overview. Southwestern Climate: Past, present and future. Global Energy Balance. What is climate?
 Southwestern Climate: Past, present and future Mike Crimmins Climate Science Extension Specialist Dept. of Soil, Water, & Env. Science & Arizona Cooperative Extension The University of Arizona Presentation
Weather and Climate of the Rogue Valley By Gregory V. Jones, Ph.D., Southern Oregon University
 Weather and Climate of the Rogue Valley By Gregory V. Jones, Ph.D., Southern Oregon University The Rogue Valley region is one of many intermountain valley areas along the west coast of the United States.
Winter Climate Forecast
 Winter 2018-2019 Climate Forecast 26 th Winter Weather Meeting, OMSI and Oregon AMS, Portland Kyle Dittmer Hydrologist-Meteorologist Columbia River Inter-Tribal Fish Commission Portland, Oregon Professor
The Climate of Bryan County
 The Climate of Bryan County Bryan County is part of the Crosstimbers throughout most of the county. The extreme eastern portions of Bryan County are part of the Cypress Swamp and Forest. Average annual
The Climate of Kiowa County
 The Climate of Kiowa County Kiowa County is part of the Central Great Plains, encompassing some of the best agricultural land in Oklahoma. Average annual precipitation ranges from about 24 inches in northwestern
Changing Hydrology under a Changing Climate for a Coastal Plain Watershed
 Changing Hydrology under a Changing Climate for a Coastal Plain Watershed David Bosch USDA-ARS, Tifton, GA Jeff Arnold ARS Temple, TX and Peter Allen Baylor University, TX SEWRU Objectives 1. Project changes
Variability of Reference Evapotranspiration Across Nebraska
 Know how. Know now. EC733 Variability of Reference Evapotranspiration Across Nebraska Suat Irmak, Extension Soil and Water Resources and Irrigation Specialist Kari E. Skaggs, Research Associate, Biological
Winter Climate Forecast
 Winter 2017-2018 Climate Forecast 25 th Winter Weather Meeting, OMSI and Oregon AMS, Portland Kyle Dittmer Hydrologist-Meteorologist Columbia River Inter-Tribal Fish Commission Portland, Oregon Professor
A Review of the 2003 Water Year in Colorado
 Hydrology Days 24 A Review of the 23 Water Year in Colorado Nolan J. Doesken 1 Colorado Climate Center, Atmospheric Science Department, Colorado State University, Fort Collins, Colorado Michael A. Gillespie
Sierra Weather and Climate Update
 Sierra Weather and Climate Update 2014-15 Kelly Redmond Western Regional Climate Center Desert Research Institute Reno Nevada Yosemite Hydroclimate Workshop Yosemite Valley, 2015 October 8-9 Percent of
WHEN IS IT EVER GOING TO RAIN? Table of Average Annual Rainfall and Rainfall For Selected Arizona Cities
 WHEN IS IT EVER GOING TO RAIN? Table of Average Annual Rainfall and 2001-2002 Rainfall For Selected Arizona Cities Phoenix Tucson Flagstaff Avg. 2001-2002 Avg. 2001-2002 Avg. 2001-2002 October 0.7 0.0
Climate of Columbus. Aaron Wilson. Byrd Polar & Climate Research Center State Climate Office of Ohio.
 Climate of Columbus Aaron Wilson Byrd Polar & Climate Research Center http://bpcrc.osu.edu/greenteam Overview Historical Climatology Climate Change & Impacts Projected Changes Summary 2 Historical Climatology
Future Weather in Toronto and the GTA
 Future Weather in Toronto and the GTA Due to Climate Change Electrical Sector Meeting, Nov. 23 rd, 2011 Christopher Ll. Morgan, PhD Toronto Environment Office Contents 2 Introduction (Why We Did What We
Local Ctimatotogical Data Summary White Hall, Illinois
 SWS Miscellaneous Publication 98-5 STATE OF ILLINOIS DEPARTMENT OF ENERGY AND NATURAL RESOURCES Local Ctimatotogical Data Summary White Hall, Illinois 1901-1990 by Audrey A. Bryan and Wayne Armstrong Illinois
Champaign-Urbana 2001 Annual Weather Summary
 Champaign-Urbana 2001 Annual Weather Summary ILLINOIS STATE WATER SURVEY 2204 Griffith Dr. Champaign, IL 61820 wxobsrvr@sws.uiuc.edu Maria Peters, Weather Observer January: After a cold and snowy December,
2015 Fall Conditions Report
 2015 Fall Conditions Report Prepared by: Hydrologic Forecast Centre Date: December 21 st, 2015 Table of Contents Table of Figures... ii EXECUTIVE SUMMARY... 1 BACKGROUND... 2 SUMMER AND FALL PRECIPITATION...
Missouri River Basin Climate Outlook 1 May Dr. Dennis Todey State Climatologist South Dakota State Univ.
 Missouri River Basin Climate Outlook 1 May 2014 Dr. Dennis Todey State Climatologist South Dakota State Univ. dennis.todey@sdstate.edu 605-688-5141 Photo taken Feb 19, 2013 General Information Providing
Jackson County 2013 Weather Data
 Jackson County 2013 Weather Data 61 Years of Weather Data Recorded at the UF/IFAS Marianna North Florida Research and Education Center Doug Mayo Jackson County Extension Director 1952-2008 Rainfall Data
Champaign-Urbana 2000 Annual Weather Summary
 Champaign-Urbana 2000 Annual Weather Summary ILLINOIS STATE WATER SURVEY 2204 Griffith Dr. Champaign, IL 61820 wxobsrvr@sws.uiuc.edu Maria Peters, Weather Observer January: January started on a mild note,
2016 Meteorology Summary
 2016 Meteorology Summary New Jersey Department of Environmental Protection AIR POLLUTION AND METEOROLOGY Meteorology plays an important role in the distribution of pollution throughout the troposphere,
The Colorado Drought : 2003: A Growing Concern. Roger Pielke, Sr. Colorado Climate Center.
 The Colorado Drought 2001-2003: 2003: A Growing Concern Roger Pielke, Sr. Colorado Climate Center Prepared by Tara Green and Odie Bliss http://climate.atmos.colostate.edu 2 2002 Drought History in Colorado
The Climate of Oregon Climate Zone 5 High Plateau
 105 E55 Unbound issue i". 9 13oes not circulate CZe Special Report 917 May 1993 The Climate of Oregon Climate Zone 5 Property of OREGON STATE UNIVERSITY Library Serials Corvallis, OR 97331-4503 Agricultural
Agricultural Science Climatology Semester 2, Anne Green / Richard Thompson
 Agricultural Science Climatology Semester 2, 2006 Anne Green / Richard Thompson http://www.physics.usyd.edu.au/ag/agschome.htm Course Coordinator: Mike Wheatland Course Goals Evaluate & interpret information,
Missouri River Basin Water Management Monthly Update
 Missouri River Basin Water Management Monthly Update Participating Agencies 255 255 255 237 237 237 0 0 0 217 217 217 163 163 163 200 200 200 131 132 122 239 65 53 80 119 27 National Oceanic and Atmospheric
Midwest and Great Plains Climate and Drought Update
 Midwest and Great Plains Climate and Drought Update June 20,2013 Laura Edwards Climate Field Specialist Laura.edwards@sdstate.edu 605-626-2870 2012 Board of Regents, South Dakota State University General
Climatography of the United States No
 Climate Division: AK 5 NWS Call Sign: ANC Month (1) Min (2) Month(1) Extremes Lowest (2) Temperature ( F) Lowest Month(1) Degree s (1) Base Temp 65 Heating Cooling 90 Number of s (3) Jan 22.2 9.3 15.8
Missouri River Basin Water Management Monthly Update
 Missouri River Basin Water Management Monthly Update Participating Agencies 255 255 255 237 237 237 0 0 0 217 217 217 163 163 163 200 200 200 131 132 122 239 65 53 80 119 27 National Oceanic and Atmospheric
Minnesota s Climatic Conditions, Outlook, and Impacts on Agriculture. Today. 1. The weather and climate of 2017 to date
 Minnesota s Climatic Conditions, Outlook, and Impacts on Agriculture Kenny Blumenfeld, State Climatology Office Crop Insurance Conference, Sep 13, 2017 Today 1. The weather and climate of 2017 to date
Drought Characterization. Examination of Extreme Precipitation Events
 Drought Characterization Examination of Extreme Precipitation Events Extreme Precipitation Events During the Drought For the drought years (1999-2005) daily precipitation data was analyzed to find extreme
Global Climates. Name Date
 Global Climates Name Date No investigation of the atmosphere is complete without examining the global distribution of the major atmospheric elements and the impact that humans have on weather and climate.
Montana Drought & Climate
 Montana Drought & Climate MARCH 219 MONITORING AND FORECASTING FOR AGRICULTURE PRODUCERS A SERVICE OF THE MONTANA CLIMATE OFFICE IN THIS ISSUE IN BRIEF PAGE 2 REFERENCE In a Word PAGE 3 REVIEW Winter 219:
Climatography of the United States No
 Climate Division: CA 5 NWS Call Sign: Elevation: 6 Feet Lat: 37 Month (1) Min (2) Month(1) Extremes Lowest (2) Temperature ( F) Lowest Month(1) Degree s (1) Base Temp 65 Heating Cooling 1 Number of s (3)
Climatography of the United States No
 Climate Division: CA 4 NWS Call Sign: Elevation: 2 Feet Lat: 37 Month (1) Min (2) Month(1) Extremes Lowest (2) Temperature ( F) Lowest Month(1) Degree s (1) Base Temp 65 Heating Cooling 1 Number of s (3)
Climatography of the United States No
 Climate Division: CA 4 NWS Call Sign: Elevation: 13 Feet Lat: 36 Month (1) Min (2) Month(1) Extremes Lowest (2) Temperature ( F) Lowest Month(1) Degree s (1) Base Temp 65 Heating Cooling 1 Number of s
Climatography of the United States No
 Climate Division: CA 5 NWS Call Sign: Elevation: 1,14 Feet Lat: 36 Month (1) Min (2) Month(1) Extremes Lowest (2) Temperature ( F) Lowest Month(1) Degree s (1) Base Temp 65 Heating Cooling 1 Number of
Seasonal Climate Watch November 2017 to March 2018
 Seasonal Climate Watch November 2017 to March 2018 Date issued: Oct 26, 2017 1. Overview The El Niño Southern Oscillation (ENSO) continues to develop towards a La Niña state, and is expected to be in at
What is the difference between Weather and Climate?
 What is the difference between Weather and Climate? Objective Many people are confused about the difference between weather and climate. This makes understanding the difference between weather forecasts
Climatography of the United States No
 Month (1) Min (2) Month(1) Extremes Lowest (2) Temperature ( F) Lowest Month(1) Degree s (1) Base Temp 65 Heating Cooling 100 Number of s (3) Jan 63.9 39.3 51.6 86 1976 16 56.6 1986 20 1976 2 47.5 1973
Climatography of the United States No
 Temperature ( F) Month (1) Min (2) Month(1) Extremes Lowest (2) Lowest Month(1) Degree s (1) Base Temp 65 Heating Cooling 100 Number of s (3) Jan 32.8 21.7 27.3 62 1918 1 35.8 1983-24 1950 29 10.5 1979
Monthly Long Range Weather Commentary Issued: APRIL 18, 2017 Steven A. Root, CCM, Chief Analytics Officer, Sr. VP,
 Monthly Long Range Weather Commentary Issued: APRIL 18, 2017 Steven A. Root, CCM, Chief Analytics Officer, Sr. VP, sroot@weatherbank.com MARCH 2017 Climate Highlights The Month in Review The average contiguous
OVERVIEW OF IMPROVED USE OF RS INDICATORS AT INAM. Domingos Mosquito Patricio
 OVERVIEW OF IMPROVED USE OF RS INDICATORS AT INAM Domingos Mosquito Patricio domingos.mosquito@gmail.com Introduction to Mozambique /INAM Introduction to AGRICAB/SPIRITS Objectives Material & Methods Results
Climatography of the United States No
 Climate Division: CA 6 NWS Call Sign: LAX Elevation: 1 Feet Lat: 33 Month (1) Min (2) Month(1) Extremes Lowest (2) Temperature ( F) Lowest Month(1) Degree s (1) Base Temp 65 Heating Cooling 1 Number of
Climatography of the United States No
 Climate Division: CA 6 NWS Call Sign: TOA Elevation: 11 Feet Lat: 33 2W Temperature ( F) Month (1) Min (2) Month(1) Extremes Lowest (2) Lowest Month(1) Degree s (1) Base Temp 65 Heating Cooling 1 Number
Constructing a typical meteorological year -TMY for Voinesti fruit trees region and the effects of global warming on the orchard ecosystem
 Constructing a typical meteorological year -TMY for Voinesti fruit trees region and the effects of global warming on the orchard ecosystem ARMEANU ILEANA*, STĂNICĂ FLORIN**, PETREHUS VIOREL*** *University
Three main areas of work:
 Task 2: Climate Information 1 Task 2: Climate Information Three main areas of work: Collect historical and projected weather and climate data Conduct storm surge and wave modeling, sea-level rise (SLR)
The Climate of Oregon Climate Zone 3 Southwest Interior
 .k) 105 Unbound issue " " 1 4oes not circulate C4P. Special Report 915 May 1993 The Climate of Oregon Climate Zone 3 Southwest Interior Property of OREGON STATE UNIVERSITY Library Serials Corvallis, OR
Climatography of the United States No
 Climate Division: CA 4 NWS Call Sign: Month (1) Min (2) Month(1) Extremes Lowest (2) Temperature ( F) Lowest Month(1) Degree s (1) Base Temp 65 Heating Cooling 100 Number of s (3) Jan 55.6 39.3 47.5 77
Climatography of the United States No
 Climate Division: CA 5 NWS Call Sign: Month (1) Min (2) Month(1) Extremes Lowest (2) Temperature ( F) Lowest Month(1) Degree s (1) Base Temp 65 Heating Cooling 100 Number of s (3) Jan 56.6 36.5 46.6 81
Climatography of the United States No
 Climate Division: CA 1 NWS Call Sign: Month (1) Min (2) Month(1) Extremes Lowest (2) Temperature ( F) Lowest Month(1) Degree s (1) Base Temp 65 Heating Cooling 100 Number of s (3) Jan 57.9 38.9 48.4 85
Climatography of the United States No
 Climate Division: CA 5 NWS Call Sign: Month (1) Min (2) Month(1) Extremes Lowest (2) Temperature ( F) Lowest Month(1) Degree s (1) Base Temp 65 Heating Cooling 100 Number of s (3) Jan 44.8 25.4 35.1 72
Climatography of the United States No
 Climate Division: CA 4 NWS Call Sign: Month (1) Min (2) Month(1) Extremes Lowest (2) Temperature ( F) Lowest Month(1) Degree s (1) Base Temp 65 Heating Cooling 100 Number of s (3) Jan 49.4 37.5 43.5 73
Climatography of the United States No
 Climate Division: CA 6 NWS Call Sign: Month (1) Min (2) Month(1) Extremes Lowest (2) Temperature ( F) Lowest Month(1) Degree s (1) Base Temp 65 Heating Cooling 100 Number of s (3) Jan 69.4 46.6 58.0 92
Climatography of the United States No
 Climate Division: CA 4 NWS Call Sign: Month (1) Min (2) Month(1) Extremes Lowest (2) Temperature ( F) Lowest Month(1) Degree s (1) Base Temp 65 Heating Cooling 1 Number of s (3) Jan 58.5 38.8 48.7 79 1962
Climatography of the United States No
 Climate Division: CA 6 NWS Call Sign: Month (1) Min (2) Month(1) Extremes Lowest (2) Temperature ( F) Lowest Month(1) Degree s (1) Base Temp 65 Heating Cooling 1 Number of s (3) Jan 67.5 42. 54.8 92 1971
Climatography of the United States No
 Climate Division: CA 1 NWS Call Sign: Month (1) Min (2) Month(1) Extremes Lowest (2) Temperature ( F) Lowest Month(1) Degree s (1) Base Temp 65 Heating Cooling 1 Number of s (3) Jan 57.8 39.5 48.7 85 1962
Colorado CoCoRaHS. Colorado CoCoRaHS. Because Every Drop Counts! November 2014 Volume 2, Issue 11
 U.S. PRECIPITATION (% OF AVERAGE) LOOKING BACK AT OCTOBER 2014 October was a fairly dry month for much of the nation with the exception of the Pacific Northwest, portions of New England and the Tennessee
Climatography of the United States No
 Climate Division: ND 8 NWS Call Sign: BIS Month (1) Min (2) Month(1) Extremes Lowest (2) Temperature ( F) Lowest Month(1) Degree s (1) Base Temp 65 Heating Cooling 100 Number of s (3) Jan 21.1 -.6 10.2
Champaign-Urbana 1999 Annual Weather Summary
 Champaign-Urbana 1999 Annual Weather Summary ILLINOIS STATE WATER SURVEY 2204 Griffith Dr. Champaign, IL 61820 wxobsrvr@sws.uiuc.edu Maria Peters, Weather Observer A major snowstorm kicked off the new
Climatography of the United States No
 Climate Division: TN 1 NWS Call Sign: Month (1) Min (2) Month(1) Extremes Lowest (2) Temperature ( F) Lowest Month(1) Degree s (1) Base Temp 65 Heating Cooling 100 Number of s (3) Jan 47.6 24.9 36.3 81
Midwest and Great Plains Drought and Climate Summary 20 February 2014
 Midwest and Great Plains Drought and Climate Summary 20 February 2014 Wendy Ryan Assistant State Climatologist Colorado Climate Center Colorado State University wendy.ryan@colostate.edu 970-491-8506 General
Champaign-Urbana 1998 Annual Weather Summary
 Champaign-Urbana 1998 Annual Weather Summary ILLINOIS STATE WATER SURVEY Audrey Bryan, Weather Observer 2204 Griffith Dr. Champaign, IL 61820 wxobsrvr@sparc.sws.uiuc.edu The development of the El Nìno
Climatography of the United States No
 Climate Division: CA 5 NWS Call Sign: FAT Month (1) Min (2) Month(1) Extremes Lowest (2) Temperature ( F) Lowest Month(1) Degree s (1) Base Temp 65 Heating Cooling 1 Number of s (3) Jan 53.6 38.4 46. 78
Fire Season Prediction for Canada, Kerry Anderson Canadian Forest Service
 Fire Season Prediction for Canada, 2014 Kerry Anderson Canadian Forest Service 1 Introduction The Canadian Forest Service is now presenting monthly and seasonal forecast maps through the Canadian Wildland
Becky Bolinger Water Availability Task Force November 13, 2018
 Colorado Climate Center WATF Climate Update Becky Bolinger Water Availability Task Force November 13, 2018 COLORADO CLIMATE CENTER Water Year 2018 Colorado s Climate in Review COLORADO CLIMATE CENTER
Climatography of the United States No
 Climate Division: CA 6 NWS Call Sign: 1L2 N Lon: 118 3W Month (1) Min (2) Month(1) Extremes Lowest (2) Temperature ( F) Lowest Month(1) Degree s (1) Base Temp 65 Heating Cooling 1 Number of s (3) Jan 63.7
Climatography of the United States No
 Climate Division: CA 5 NWS Call Sign: BFL Month (1) Min (2) Month(1) Extremes Lowest (2) Temperature ( F) Lowest Month(1) Degree s (1) Base Temp 65 Heating Cooling 1 Number of s (3) Jan 56.3 39.3 47.8
Monthly Long Range Weather Commentary Issued: APRIL 1, 2015 Steven A. Root, CCM, President/CEO
 Monthly Long Range Weather Commentary Issued: APRIL 1, 2015 Steven A. Root, CCM, President/CEO sroot@weatherbank.com FEBRUARY 2015 Climate Highlights The Month in Review The February contiguous U.S. temperature
LAB J - WORLD CLIMATE ZONES
 Introduction LAB J - WORLD CLIMATE ZONES The objective of this lab is to familiarize the student with the various climates around the world and the climate controls that influence these climates. Students
Monthly Long Range Weather Commentary Issued: APRIL 25, 2016 Steven A. Root, CCM, Chief Analytics Officer, Sr. VP, sales
 Monthly Long Range Weather Commentary Issued: APRIL 25, 2016 Steven A. Root, CCM, Chief Analytics Officer, Sr. VP, sales sroot@weatherbank.com MARCH 2016 Climate Highlights The Month in Review The March
Climatography of the United States No
 No. 2 1971-2 Asheville, North Carolina 2881 COOP ID: 46175 Climate Division: CA 6 NWS Call Sign: 3L3 Elevation: 1 Feet Lat: 33 Month (1) Min (2) Month(1) Extremes Lowest (2) Temperature ( F) Lowest Month(1)
Climatography of the United States No
 No. 2 1971-2 Asheville, North Carolina 2881 COOP ID: 42713 Climate Division: CA 7 NWS Call Sign: Elevation: -3 Feet Lat: 32 Month (1) Min (2) Month(1) Extremes Lowest (2) Temperature ( F) Lowest Month(1)