Final Report. Predicting of the stiffness of cracked reinforced concrete structure. Author: Yongzhen Li
|
|
|
- Mervyn Hunter
- 6 years ago
- Views:
Transcription
1 Predicting of the stiffness of cracked reinforced concrete structure Final Report Predicting of the Stiffness of Cracked Reinforced Concrete Structures Author: Delft University of Technology Faculty of Civil Engineering & Geosciences Department Design and Construction Section Structural and Building Engineering Stevinweg 1, Delft Commissioner: Van Hattum en Blankevoort Korenmolenlaan, Woerden Supervisors: Prof. dr. ir. J.C. Walraven Prof.dr.ir. Ningxu Han Dr.ir.drs. C.R. Braam Dr.ir. P.C.J. Hoogenboom Ir. L.J.M. Houben TU Delft Van Hattum en Blankevoort TU Delft TU Delft TU Delft July 010 1
2 II
3 Acknowledgements This research was conducted at the Faculty of Civil Engineering and Geosciences at Delft University of Technology and Van Hattum en Blankevoort. I would like to thank Prof.dr.ir. J.C. Walraven for his help and encouragement during the past year. I especially would like to thank Dr.ir.drs. C.R. Braam and Prof.dr.ir. Ningxu Han for their valuable guidance and their help throughout this project, without which this work would not have been possible. I also would like to thank Dr.ir. P.C.J. Hoogenboom for giving me a lot of advises and help in solving problems. I would like to thank my coordinator Ir. L.J.M. Houben who helped me a lot in the graduation process. I also would like to thank to Van Hattum en Blankevoort, since they gave me the chance to carry out my thesis work there with a lot of help and advices. Finally, I wish to thank my family for their support and care. III
4 Summary Cracking is inherent in design of reinforced concrete, and it influences the structure s durability and its appearance. If the cracks are too wide, the structure might not fulfill requirements with regard to durability and serviceability e.g. liquid tightness. Therefore a good design and detailing of a structure should be made to limit crack widths. But unexpected cracking might occur. Many factors influence the cracking behavior of concrete structures: Cracks can not only be caused by imposed loads, but also by (partially) restrained imposed deformations. In the latter case there is an interaction between the forces generated and the stiffness of the structure, which is influenced by the cracking behavior: the more the stiffness is reduced by cracking, the lower the forces. It is difficult to make a design in which all influencing factors are taken into account. So, when structural modeling imposed deformations, engineers often reduce the uncracked stiffness when modeling the structure and designing the reinforcement. The question arises which reduction factor to use. In practice, Young s modulus is often reduced to 1/3 of its original value. Answering the question whether this is a suitable value is the main goal of the research. The research focused on basic theories on cracking behavior. The tension stiffening law is used and it is researched from micro size to macro size, from cross-section to system, from effect to action. Finally, an appropriate stiffness reduction value is obtained. The procedure is: 1. By using the cross section stress balance, the accurate compression zone height will be obtained under both axial force and bending moment.. The elastic modulus is an important parameter related to the moment caused by restrained deformation. After the compression zone height is obtained, by using the Tension Stiffening Law, the Elastic Modulus in the crack is calculated. 3. After transferring the cross sectional stiffness into system stiffness, the accurate moment curvature curve and the design mean stiffness are obtained. The design mean stiffness is not constant for different loading combinations. It is larger than one third of the uncracked stiffness when there is a tensile axial force and a high positive temperature gradient. On the other hand, the design mean stiffness might also be less than one third of uncracked stiffness. There is no difference for the loading sequence. That means that whether external loading or restrained deformation is applied first, the results will be same at the final state. After cracking, the non-linear response of the member investigated will influence the bending moment distribution. As a result, the bending moment in a cross-section is not only influenced by external loading and restrained deformation, but also by the stiffness distribution over the length of the member. It is not suitable for engineers to always use one third of the uncracked stiffness to design the reinforcement since they might then underestimate the forces caused by the temperature gradient: It will be higher when there is an axial tensile force in combination with a high positive temperature gradient. A program to obtain the accurate value of the stiffness of a clamped beam is developed. This will help engineers to prepare a more accurate structural model. IV
5 CONTENTS 1.General introduction Introduction Problem description Goal of the research Research outline... 4.Literatures survey Different codes in calculation crack Crack width calculation equations and comparison Steel stress equations under crack width control and comparison Conclusion General literatures Introduction of crack width control Causes of cracks External Loading Imposed strain Loading combination Calculation of compression zone height H under only tension reinforcement and only N H under both compression and tension reinforcement with only M H under only tension reinforcement with both M and N H under both compression and tension reinforcement with both M and N The compression zone height equation of Noakowski Example by using two method of calculation compression zone height Calculation of the stiffness Cracking Force Bending stiffness in a crack Difference of the centroidal axis x after moved Tension stiffening value Calculation of the mean stiffness Beam under dead load and temperature gradient M ΔT & M cracking at both ends &ΔT enlarge the cracking at ends and no cracking at middle span Dead load effect Temperature gradient effect Example: Calculation including normal force Analysis procedure Determine the compression zone height End rotation calculation End moment and moment due to temperature gradient Design stiffness and mean stiffness V
6 6.3 Comparison of mean stiffness with different situations Comparison with different temperature gradient Comparison with different normal force Comparison with different q load Bio-diesel project Project analysis Redesign of the project Program for obtaining mean stiffness Conclusion and recommendations References Appendix Appendix Appendix Appendix Appendix Appendix VI
7 Predicting of the stiffness of cracked reinforced concrete structure Chapter 1 General introduction 1

8 1.1 Introduction Nowadays, concrete is one of the most important construction materials in the world. Concrete projects are distributed in many fields, such as buildings, tunnels, bridges and so on. Concrete is a kind of construction material with high compressive strength and a good durability, but a relatively low tensile strength. The tensile strength of concrete is much lower than its compressive strength. Cracks might occur in concrete at a low tensile stress. Cracking is inherent in design of reinforced concrete. These cracks might influence the structure s durability and its appearance. If the cracks are too wide, the structure might not fulfill requirements with regard to durability and service ability e.g. liquid tightness. Therefore a good design and detailing of a structure should be made to limit crack widths. Fig. 1-1 Cracks in a concrete structure 1. Problem description In order to prevent the failure of a structure caused by cracking, a good understanding of cracking is required. Usually, cracks which have small width will not or hardly affect the structure. The crack width should therefore be controlled under a limit level. Unexpected or excessive cracking might occur. An example is the new cast wall which is restrained at both sides at early age when there is no external loading on it. But still some cracks might occur as shown in Fig.1-. The design of the wall is ok with regard to ULS design, but why are there some cracks? What is the reason for the formation of these cracks? Might these cracks influence the durability of the structure? How to model these cracks with the cracks together caused by the other actions?

9 Fig.1- Early age cracking on concrete structure Generally, cracking can be caused by various kinds of reasons, such as external loading, restrained deformation, creep and so on. External loading and restrained deformation always are the main reasons of cracking. But codes often deal extensively with the first category which is the external loading, whereas the second category is hardly dealt with. Therefore, cracking caused by restrained deformation might be ignored by using codes to design. The cracking in the Fig.1- mostly is caused by the restrained deformation. Or cracks might be caused by a combination of external loading and restrained deformation. The key point is how to calculate the stiffness, for the stiffness is used to transfer a restrained deformation from an action to an effect on the structure. Before cracking, the stiffness will be constant as the stiffness of the uncracked cross-section, but if the concrete is cracked by external loading or restrained deformation, the stiffness of the structure also change. The stiffness will decrease as the cracking increases. 1.3 Goal of the research The goal of this research is to find an expression of the structural crack width calculation for cracking caused by different action combinations in different structures, such as combinations of external loading and thermal deformation, or external moment and imposed curvature. There might be a difference in the order of the actions that occurred. So what is the difference between the imposed deformation first and the external loading first? Is there also any difference when an imposed deformation and an external load occur together? Firstly cracking caused by an individual action should be investigated. After this, there is a problem about how to combine the individual actions. In order to solve the problem of action combination, the stiffness of the structure should be calculated exactly. Also the conversion from the structure action to the cross-sectional effect is another important point. 3
10 1.4 Research outline Fig. 1-3 Outline of the research 4
11 Chapter Literatures survey 5
12 In the literatures survey chapter,the main contents will be presented as two parts: crack width calculation in different codes and theoretical model for the calculation the crack width. The literature study on comparison with different codes includes four different codes to calculate the crack width. Dutch Code Eurocode American Code Chinese Code The literature study on theoretical models is divided into four parts: Introduction of crack width control Causes of crack formation Crack combinations Height of compression zone Continuous theory to determine crack widths.1 Different codes in calculation crack Nowadays, in an actual project, the crack width has always been calculated by following a Code. But there are differences between different codes, which depend on their different theories. Four different codes will be compared, namely the Dutch Code, EuroCode, American Code and Chinese Code. In these codes, the theories for the calculation of crack width are not totally the same. Mostly, the equations are found by an empirical equation or a semi-theoretical and semi-empirical equation. Crack width control based on steel stress and bar diameter/spacing is derived from crack width equations, so their basis is the same in different codes. But the calculation methods or criteria in different code have a little difference. For example, in the American code the crack width will be controlled by controlling the reinforcement stress or bar spacing. In the Chinese code it will be controlled by calculating the crack width and comparing with the maximum width. In the Eurocode both methods are mentioned. For these two methods, the basic theory is the same. If the maximum crack width is substituted into the equation of the crack width calculation, the maximum steel stress will be obtained. So crack width control might be transferred into steel stress control which is much easier for an engineer to use..1.1 Crack width calculation equations and comparison In the Eurocode and the Chinese Code GB50009 is presented the method of directly calculating the crack width to control crack width. The equations to calculate the crack width are shown below. 6
13 In the Eurocode [4], the equation of calculating crack width is, w ( ) k sr,max sm cm (1-1) sr,max is the maximum crack spacing sr,max k3c k1kk4 / p, eff Eq.(7.11) in [4] sm is the mean strain in the reinforcement under the relevant combination of loads, including the effect of imposed deformations and taking into account the effects of tension stiffening. Only the additional tensile strain beyond the state of zero strain of the concrete at the same level is considered cm is the mean strain in the concrete between cracks Where sm fct, eff s kt (1 ep, eff) peff, s cm 0.6 (1-) E E s s s is the stress in the tension reinforcement assuming a cracked section. For e pretensioned members, s may be replaced by p the stress variation in prestressing tendons from the state of zero of the concrete at the same level. is the ratio E / E s cm peff, is ( A A ) s A ' 1 p ceff, k 1 is a factor dependent on the duration of the load A ceff, is the effective area of concrete in tension surrounding the reinforcement or prestressing tendons of depth, see Fig -1 Fig -1 Effective tension area of cross section 7
14 And in the Chinese Code GB50009 [7], the equation for calculating crack width is d sk eq wmax cr (1.9c 0.08 ) (1-3) E cr is the coefficient in [7] table s ts (1-4) is a strain coefficient of steel between cracks. When ψ<0., then ψ=0.. When ftk ψ>1, then ψ= sk is calculated in [7] equation te sk f tk is the concrete tensile strength. c is concrete cover, when c<0mm, then c=0mm; when c>65mm, then c=65mm. te is the ratio of reinforcement in the effective tension zone which is similar as A ceff, in Fig -1. When ρ te <0.01, then te d eq is equivalent diameter of the reinforcement. v i is bond coefficient in [7] table Also in the American code ACI [5], there is an equation to calculate the crack width. This equation is based on the Gergely-Lutz equation [14]. This equation is derived by data fitting from many experiments. After Frosch s derivation [15], the equation used in ACI is shown as below. w c s s ( dc) Es (1-5) W e is the crack width, is the ratio of the distances to the neutral axis from the extreme tension fiber and from the centroid of the reinforcement, s is calculated stress in the reinforcement at service loads, d c is thickness of the concrete cover measured from the extreme tension fiber to the center of the bar or wire located closest to it, A is effective tension area of concrete surrounding the flexural tension reinforcement and having the same centroid as that reinforcement, divided by 8
15 the number of bars or wires. s is bar spacing. In Eurocode [4] and the Chinese Code GB50009 [7], the allowable crack width will be determined by different exposure class and reinforcement condition. The allowable crack width is derived from Table 1 and Table in Eurocode and Chinese Code GB The maximum crack width in Eurocode will be found in Table -1 [4]. Table -1 Recommended values of w max in Eurocode [4] In Table -1, the exposure class is defined in Table -3 as below: 9

16 Table -3 Exposure class in Eurocode
17 And the maximum crack width in Chinese Code GB50009 will be found in Table -3. Exposure Only reinforced members in concrete Prestressed members in the concrete Class Cracking control level Crack width (mm) Cracking control level Crack width (mm) Decompression Decompression Table -3 Recommended values of w max in Chinese Code GB50010 [7] In Table -3, the exposure class is defined as below: Exposure Class 1: Normal environment indoor. Exposure Class : Moist environment indoor or outdoor except in cold area and corrosion environment. Exposure Class 3: The other exposure condition. Compared with the above two tables, the Chinese code GB50009 seems more strictly than Eurocode And in Eurocode, it is divided with bonded tendons. But in Chinese Code GB50009, it is divided with whether contain pre-stressed reinforcement. The crack width calculation equations in the codes and its influential factors are compared in the following Table -4. illustrates that the factor is present the equation. Δ illustrates that the factor is not in the equation but it is already considered in the equation. Influence factor Direct method in Chinese Code Eq.(5) refer to Eurocode GB90005 ACI Concrete cover thickness Concrete tensile Δ strength E modulus of steel Steel stress Reinforcement Δ Δ diameter Bar spacing Δ Δ Exposure Δ Δ environment Tension reinforcement ratio Effective tension Δ area of concrete Table -4 Comparison the factors in crack width calculation equations of three codes 11

18 From Table -4 and above equations, some conclusions will be obtained as below. 1> All the equations consider the concrete cover thickness, steel stress, steel diameter and bar spacing. Especially for the steel stress which directly influences the crack width. > Changing the steel diameter, bar spacing and reinforcement ratio has impact on the crack width. It will also respond to a change in the steel stress. So in American code ACI and Dutch Code NEN670, they use the method of controlling steel stress to control crack width is used. 3> This direct calculation method is more complicated compared with the other methods. When changing the reinforcement properties, it should be recalculated again..1. Steel stress equations under crack width control and comparison By using this method, it is only necessary to substitute the structural parameters and exposure parameters in to the equations to find out the maximum allowable steel stress. And comparing the steel stress with the maximum steel stress, it will let the engineers know whether it is sufficient. Or even it can use the steel stress and the maximum crack width to determine the maximum bar spacing or bar size. The following tables will illustrate the different indirect crack width controls in different codes. Table -5 Maximum bar diameters for crack control in Eurocode [4] 1
![Table -6 maximum bar spacing for crack control in Eurocode 199-1-1 [4] Table -7 maximum bar spacing for crack control in ACI 318-0 [5] Table -8 Maximum bar diameters for](/docs-images/79/78913887/images/19-0.jpg "crack control in NEN670 [6].1.3 Conclusion From above it can be seen that there are two different methods to compute crack width.")

19 Table -6 maximum bar spacing for crack control in Eurocode [4] Table -7 maximum bar spacing for crack control in ACI [5] Table -8 Maximum bar diameters for crack control in NEN670 [6].1.3 Conclusion From above it can be seen that there are two different methods to compute crack width. One method is to calculate the crack width directly and compare with the maximum width. On the other hand, detailing requirements with regard to bar diameter or bar spacing linked to steel stress are linked with the crack width equation, acquired by presenting this equation in a different form. The latter method is more convenient for engineers, which do not need to calculate the crack width. 13
20 . General literatures..1 Introduction of crack width control Generally, a concrete crack is generated when the stress in the concrete is larger than the cracking stress. So in a reinforced concrete cross-section the concrete carries the compressive stress and the reinforcement has to carry the tensile stress. In the beginning of the crack stage, if too little reinforcement is used, the crack can be too wide, even if the cracking force is only exceeded to a small extend. So we also have to define a maximum crack width value to check whether the crack in the structure is sufficient... Causes of cracks Though there are many reasons for cracking, the main reasons are external loading and restrained deformation....1 External Loading From [1, ], the axial force strain diagram of a reinforced concrete tension member is obtained see Fig.-1. From this diagram it can be seen that there are four stages of cracking behavior. Fig. -1 The axial force strain relation diagram in a reinforced concrete Stage I is the uncracked stage. In this stage concrete does not crack, and the axial 14
21 force is smaller than the cracking force of the concrete N cr. So in this stage, the equivalent stiffness is equal to the concrete stiffness. E b is the concrete elastic modulus E A ( EA) b m CS (-1) A m is the equivalent area of the section which is transfer the steel area into concrete area by times Es E. c Stage II is the crack development stage. This stage only occurs under the condition of ε fdc >ε>ε cr and N = N cr. When the imposed strain is larger than the cracking strain, the crack will occur, and in the whole stage II the axial force will be equal to cracking force. So in this stage, the equivalent stiffness will be computed by the following equation, m is the mean steel strain E b A m N cr m (-) Stage III is the crack widening stage and the crack pattern is fully developed. In this stage, the number of cracks will be constant while their width will increase. The tensile force will be fully carried by the steel, and the bond force will transfer part of the force from the steel to the concrete. In this stage, the equivalent stiffness will be calculated by the following equation, E b A II EA is the steel stiffness only. m is the mean steel strain. ts is the tension stiffening. m ( m ) EA m II (-3) Stage IV is the final stage. In this stage, the force reaches the yield strength of the steel. The deformation will increase when the force remains unchanged. The equivalent stiffness will be calculated by the following equation, E b A m N sy m (-4) 15
22 ... Imposed strain Mostly the response caused by an imposed strain is similar to the axial force without two major differences. Firstly, the force caused by an imposed deformation dose not exceed the stiffness of the tensile member in stage I times the imposed strain, N ( EA) cs (-5) This stage it only present for small imposed deformations, because the imposed deformation must be limited to cr is cracking strain of concrete So mostly ( EA ) cs cr will be larger than N. (-6) On the other hand, the length of the stage II largely depend on the reinforcement ratio. Because the external loading is constant in this stage, so the lower reinforcement ratio will cause the longer in this stage...3 Loading combination In actual projects, there usually is not only one action that will act on the structure. External loading and deformation will often take place together. From the previous part the substantive force or deformation calculation method and theory are obtained. But if two or more different types of force and deformation together are combined, what will happen? From [1], several examples will be demonstrated here Axial force and Imposed strain in tensile member 1> The external load will occur before the restrained deformation. N N cr : If the external load is larger than the cracking force, then the crack pattern will be fully developed which directly in the 3 rd stage in Fig.4. After that, the imposed deformation will be added. The existing crack will become larger due to the imposed deformation. From [1], to calculation of crack width, there is not a purely theoretically exact method. In this method, the incremental crack width is 16
23 the mean crack spacing times the imposed strain at the level of reinforcement, which is also equivalent to the steel stress of Es v. N N cr On the other hand, if the external load will not exceed the cracking force, the member will be in the 1 st stage in Fig.-1. The crack is caused by the following imposed strain. This is mostly a not fully developed crack pattern, since a fully developed crack pattern will be found for a really large imposed strain. > The external load will occur after the imposed deformation. fdc If the imposed deformation is larger than the fully developed crack pattern strainε fdc., an increased of the external load will result in an increase of the stress in the steel. So the increase of the steel stress is N / A. So the total N F stress s s, cr( at Ncr). A s F s fdc The crack pattern now is not fully developed due to the imposed deformation. So the following external load will cause the fully developed crack pattern mostly. In [1], the calculation method can be that the resulting steel stress in a crack is: if the concrete is not cracked under imposed deformation( E N )/ A ; if the concrete is cracked under imposed deformation ( N N )/ A cr F s c F s..3. Bending moment and imposed strain 1> Bending moment before imposed strain If the bending moment is larger than the crack bending moment, there will be a fully developed crack pattern. This is similar as in section the..3.1, the widening of existing cracks will be caused by the imposed strain. If the bending moment is smaller than the cracking bending moment, there will be a not fully developed crack pattern. So in [1], the fully developed crack pattern will mostly develop, and the resulting steel stress is the steel stress due to 17
24 the bending moment plus the stress due to the imposed deformation times the incremental stiffness from stage III M /( za ) E. q s s v > Bending moment after imposed strain If the imposed strain is larger than the cracking strain, the bending moment causes an increase of the steel stress equal to M /( za ). The stress due to the strain will be calculated by using Fig.-1. q s On the other hand, if the imposed strain is smaller than the cracking strain,the crack pattern will stay in the not fully developed pattern. From [1], the resulting steel stress in a crack is, M /( za ) s cr q s From the above we can obtain that a critical part in a loading combination is the definition of the stiffness. In general, the stiffness will be estimated in practice. But this value is often not exactly correct. Considering this, we will work out a more exact result in the latter part of the thesis. 18
25 Chapter 3 Calculation of compression zone height 19
26 In this section, the calculation of compression zone height in different condition and with different forces will be illustrated. Fig 3-1 Compression zone height in a concrete element The compression zone is the compressive area of the cross section after cracking. It will bear the compressive stress due to moment or a normal force. Also in the cross section equilibrium, the compressive force taken by the compression zone is equal to the tensile force taken by tension reinforcement for pure bending. If the compression zone height is equal to zero, that means the cross section is all under tensile stress. On the other hand, if the compression zone height reaches its maximum value which is equal to h, the section is all under a compressive stress. The compression zone height is a very important parameter in the concrete cross section calculation. The stiffness of the cross section after cracking largely depends on the compression height. So obtain the exact value of the compression zone height is necessary. In order to obtain the compression zone height in a crack, we need to calculate in a cracking cross section as Fig 3-. The Normal force balance N 0 and moment balance M 0 will be used in the calculation for solving the compression zone height. And the cross section parameters and materials parameters also are needed for solving the compression zone height. The calculation process will be found in the following sections and Appendix.1. The compression zone height calculation will be divided into several conditions as below: 1> Only moment & only tension reinforcement (bottom reinforcement) > Moment and Normal force & only tension reinforcement (bottom reinforcement) 3> Only moment & both compression and tension reinforcement 4> Moment and Normal force & both compression and tension reinforcement At last, the general equation for solving the compression zone height will be obtained. 0
27 Fig 3- Cross section in a crack 3.1 Compression zone height under only tension reinforcement and only bending moment In this condition, there is only bending moment and tension reinforcement. So the cross section parameters are shown in Fig 3-3 as below. Fig 3-3 Cross section M & only tension reinforcement By using the normal force N 0 the compression zone height will be calculated. The, stress and strain distribution is shown in Fig 3-4. The process of obtaining the 1
28 compression zone height is illustrated later. Fig 3-4 Stress and strain of the cross section By using the normal force equilibrium N 0, which is derived from the stress distribution in Fig 3-4 the following relationship will be obtained: N 0N N 0 Where, bx The concrete area force Nc Ec c The tension reinforcement force Ns AE s s s So the relationship can be rewritten as bx E c c A s E s s 0 (3-1) In this equation, b is the cross section width x is the compression zone height A s is the tension reinforcement area c s E c is the elastic modulus of concrete E s is the elastic modulus of tension reinforcement c is the concrete strain s is the tension reinforcement strain
29 The relationship between concrete strain c and reinforcement strain s can be derived by the strain relation in the Fig 3-4 as below d x s c x (3-) If we substitute Eq. (3-) into Eq. (3-1), the following relationship will be obtained: bx d x bx d x c( Ec AsEs ) 0 Ec AsEs 0 x x (3-3) Finally, the compression zone height x will be obtained by solving the Eq. (3-3) and the result is as below. AsEs AE s s( AE s s Ecbd) x (3-4) Eb c If we use the ratio of E-modulus E s e and reinforcement ratio Ec A s in the bd equations, the Eq. (3-4) will be rewritten as below. x d (3-5) ( e ( e ) e ) 3. Compression zone height under both compression and tension reinforcement with only bending moment In this condition, there is only bending moment with both compression and tension reinforcement. So the cross section basic parameters are shown in Fig 3-5 as below. Fig 3-5 Cross section M & both compression and tension reinforcement 3
30 By using the normal force N 0 the compression zone height will be calculated. The, stress and strain distribution is shown in Fig 3-6. The process of obtaining the compression zone height is illustrated later. Fig 3-6 Stress and strain of the cross section By using the normal force equilibrium N 0, which is derived from the stress distribution in Fig 3-8 the following relationship will be obtained: N 0N N N 0 Where, bx The concrete area force Nc Ec c The tension reinforcement force Ns AE s s s c scomp s The compression reinforcement force Nscomp AscompEscomp scomp So the relationship can be rewritten as bx E c c A scomp E scomp scomp A s E s s 0 (3-6) In this equation, b is the cross section width x is the compression zone height A s is the tension reinforcement area A scomp is the compression reinforcement area 4
31 E c is the elastic modulus of concrete E s is the elastic modulus of tension reinforcement E scomp is the elastic modulus of compression reinforcement c is the concrete strain s is the tension reinforcement strain scomp is the compression reinforcement strain The relationship between concrete strain compression reinforcement strain c, tension reinforcement strain s and scomp can be derived by the strain relation in the Fig 3-6 as below d x s c (3-7) x x cu scomp c (3-8) x If we substitute Eq. (3-7) and Eq. (3-8) into Eq. (3-6), the following relationship will be obtained: bx x cu d x c( Ec AscompEscomp AsEs ) 0 x x bx x cu d x Ec AscompEscomp AsEs 0 x x (3-9) Finally, the compression zone height x will be obtained by solving the Eq. (3-9) and the result is as below. A E A E A E A A E E E bda E A E E bc A E x Eb s s scomp scomp s s s scomp s scomp c s s scomp scomp c u scomp scomp c (3-10) If we use the ratio of E-modulus E s e, Ec E scomp escomp and reinforcement Ec ratio A s, bd A scomp scomp in the equations, the Eq. (3-10) will be rewritten as bd below. xd ( e escomp scomp ( e ) e escomp scomp ( escomp scomp ) escomp scomp e ) 5
32 (3-11) 3.3 Compression zone height under only tension reinforcement with both bending moment and normal force In this condition, there is both normal force and bending moment with only tension reinforcement. So the cross section basic parameters are shown in Fig 3-7 as below. Fig 3-7 Cross section M and N & only tension reinforcement By using the normal force N 0 and M 0 the compression zone height will, be calculated. The stress and strain distribution is shown in Fig 3-8. The process of obtaining the compression zone height is illustrated below. Fig 3-8 Stress and strain of the cross section 6
33 By using the normal force equilibrium N 0 and M 0, which are derived from the stress distribution in Fig 3-8 the following relationship will be obtained: N N N N 0 s c h h x M 0 Ns( d ) Nc( ) M 3 Where, bx The concrete area force Nc Ec c The tension reinforcement force Ns AE s s s h is the total height of the cross section d is the distance between the reinforcement and the top of the cross section So the relationship can be rewritten as bx AsEss Ecc N (3-1) bx Ec ( h c x ) AE s ss( d h ) M (3-13) 3 In this equation, b is the cross section width x is the compression zone height A s is the tension reinforcement area E c is the elastic modulus of concrete E s is the elastic modulus of tension reinforcement c is the concrete strain s is the tension reinforcement strain The relationship between concrete strain compression reinforcement strain c, tension reinforcement strain s and scomp can be derived by the strain relation in the Fig 3-8 as below d x s c (3-14) x If we substitute Eq. (3-14) and Eq. (3-15) into Eq. (3-16), the following relationship will be obtained: 7
34 d x bx c( AsEs Ec) N (3-15) x bx h x d x h c( Ec( ) AE s s ( d )) M (3-16) 3 x From equations (3-15) and (3-16), the relationship between M/N ration and compression zone height x is as below: bx h x d x h Ec( ) AsEs ( d ) 3 x M (3-17) d x bx AE N s s Ec x So we can obtain the value of compression zone height x by given a certain M / N value. If we use the ratio of E-modulus e E E s c, the moment and normal force ratio e M N and reinforcement ratio below. A s bd, in the equations, the Eq. (3-17) will be rewritten as x h x d x h ( ) e ( d ) d x e (3-18) d x x e x d 3.4 Compression zone height under both compression and tension reinforcement with both normal force and bending moment In this condition, there is both normal force and bending moment with both compression and tension reinforcement. So the cross section basic parameters are shown in Fig 3-9 as below. 8
35 Fig 3-9 Cross section N and M & both compression and tension reinforcement By using the normal force N 0 and M 0 the compression zone height will, be calculated. The stress and strain distribution is shown in Fig The process of obtaining the compression zone height is illustrated below. Fig 3-10 Stress and strain of the cross section By using the normal force equilibrium N 0 and M 0, which are derived from the stress distribution in Fig 3-10 the following relationship will be obtained: N N N N N 0 s c scomp h h h x M 0 Ns( d ) Nscomp( cu) Nc( ) M 3 9
36 Where, bx The concrete area force Nc Ec c The tension reinforcement force Ns AE s s s The compression reinforcement force Nscomp AscompEscomp scomp h is the total height of the cross section d is the distance between the reinforcement and the top of the cross section So the relationship can be rewritten as As Ess bx Ecc AscompEscompscomp N (3-19) bx Ec ( c x ) AscompEscompscomp ( cu ) As Ess ( d h ) M 3 (3-0) In this equation, b is the cross section width x is the compression zone height A s is the tension reinforcement area A scomp is the compression reinforcement area E c is the elastic modulus of concrete E s is the elastic modulus of tension reinforcement E scomp is the elastic modulus of compression reinforcement c is the concrete strain s is the tension reinforcement strain scomp is the compression reinforcement strain The relationship between concrete strain compression reinforcement strain c, tension reinforcement strain s and scomp can be derived by the strain relation in the Fig 3-10 as below d x s c (3-) x 30
37 x c x If we substitute Eq. (3-7) and Eq. (3-8) into Eq. (3-6), the following relationship will be u scomp c (3-1) obtained: d x bx x cu c( AsEs Ec AscompEscomp ) N (3-) x x bx h x x cu h d x h c( Ec( ) AscompEscomp ( cu) AsEs ( d )) M (-3) 3 x x Finally, the compression zone height x will be obtained by solving the Eq. (3-9) and the result is as below. d x h bx h x x cu h AE s s( )( d ) Ec( ) AscompEscomp( )( cu) x 3 x M (3-4) x cu d x bx AscompEscomp ( ) As Es ( ) E N c x x If we use the ratio of E-modulus E s e, Ec E scomp escomp and reinforcement Ec ratio A s, bd A scomp scomp in the equations, the Eq. (3-10) will be rewritten as bd below. d x h x x h x x cu h e ( )( ) ( ) escompscomp( )( c u) x d 3 x e x cu d x x escompscomp( ) e( ) x x d (3-5) 31
38 3.5 The compression zone height equation of Noakowski From [17], Noakowski obtained an equation of calculation compression zone height. In his equation he moved the centroidal axis to the position where the area moment equal to 0 after cracked which is shown in Fig His basic theory is using the area inertia equal to 0 and the stress at compression zone height position equal to 0 to obtain the relationship between compression zone height and force. Fig 3-11 Stress and strain in situation I and II by Noakowski In Fig 3-11, situation I is the uncracked stage, the centroidal axis is at position h. After moved, the centroidal axis from o to o '. The position of ' o is the stress equal to 0 only under moved bending moment after cracked. After calculation [17], the compression zone height equation is shown as Eq. (3-6). k 4Ak 1Bk 1Ck 1AC1B 4 3 x x x x 3 6kx 18Akx 1( A B) kx 1AB (3-6) In this equation, A ( ) e s scomp B ( k ) e s u scomp C ( k ) e s u scomp E α e is the modulus ratio between reinforcement and concrete e E s c 3
39 s is the area ratio between tension reinforcement and concrete s As A ceff, is the area ratio between compression reinforcement and concrete scomp scomp A A scomp ceff, A Where ceff, bd k u is the related height from the reinforcement to bottom k u cu d is the moment and normal force ratio after moved the centroidal axis, ( B kx ) 1k x0 ( A k ) x 1 is the moment and normal force ratio before moved the centroidal axis, e M 1 d dn k x0 is the ratio of centroidal position and total height, in rectangular cross section, it is always
40 3.6 Example by using two method of calculation compression zone height There is a cross section shown in Fig 3-1. The external normal force and moment is applied on it. Both top and bottom have the reinforcement. The two methods in section 3.4 and 3.5 will be applied to calculate in this example. Fig 3-1 Cross section of example The basic parameters of the cross section and the external force are shown as below: Ec N / mm 5 Es E 5 scomp 10 N / mm n 1.5 E 10 N / mm E s h 605mm d 550mm c 55mm A, bd mm ceff u 1000 As 1000mm Ascomp 1000mm s M scomp e mm 0000 N M dn c Substituting the above values into the Eq. (3-5) and Eq. (3-6), the compression zone height will be obtained. The process of calculation is shown in Appendix 1. After calculation, the results of Noakowski equation and Eq. (3-5) are similar which are 34
41 165mm and mm respectively. The difference between Eq. (3-6) and Eq. (3-5) is that, for Eq. (3-5) the basic theory is the cross section strain and stress balance. But for Eq. (3-6), Noakowski use the area moment equal to 0 and stress balance after moved centroidal axis to obtain the compression zone height equation. The result obtained by both methods is similar, so that either of the methods can be used in compression zone height calculation. The η 1 -k x curves by using equation (3-5) and (3-6) are plotted as Fig 3-13 and Fig In these figures, η 1 is the moment and normal force ratio, and k x is related height of compression zone height. Fig 3-13 η 1 -k x relationship curve by using Eq. (3-5) 35
42 Fig 3-14 η 1 -k x relationship curve by using Eq. (3-6) Chapter 4 Calculation of the stiffness 36
43 Stiffness is a very important parameter in crack width calculation. Always the stiffness can be easily found if only one type of action is applied on the element. But if there are two or more different actions on the structure, such as external loading and restrained deformation, the calculation of stiffness is much more complicated. For obtaining the mean stiffness of the element ( EI ) m and ( EA ) m, the Tension Stiffening Law [, 3, 16, 17] is applied. The moment-curvature relationship in Fig 4-1 is used to obtain a realistic determination of the bending moment or normal force. Also after having obtained the stiffness of the element, every parameters of the element in both the uncracked and the cracked stage will be known. So the mean stiffness of the element is the key parameter in the future calculation. Fig 4-1 Tension Stiffening Law moment-curvature relationship By using Tension Stiffening Law in Fig 4-1, the stiffness calculation process is divided into several steps in Fig 4- as below, and it will be described detailed in the following sections. 37


44 Fig 4- Process of mean stiffness calculation 4.1 Cracking Force In the cracking force calculation, there are three conditions. For every condition, there is a different expression for the cracking force. 1> Only bending: Cracking moment Mcr W fct W is the area moment of the cross section in the uncracked stage f ct is the concrete cracking tensile strength > Only Normal force Cracking normal force Ncr A fct A is the area of the cross section in the uncracked stage 3> Both bending and normal force Cracking moment with a constant normal force N0 Mcr W fct A N 0 o for tension. 38
45 4. Bending stiffness in a crack From Fig 4-1, the stiffness in a crack ( EI ) s, cr is equal to the mean stiffness of the element in stage II. ( EI) scr, II EcI (4-1) And the inertia modulus in a crack is equal to b is the cross section width x is the compression zone height A s is the tension reinforcement area 3 II bx x I bx ( ) eas( d x) (4-) 1 e is the ratio of E-modulus where e E E s c So that the stiffness in a crack should be bx x (4-3) 1 3 II ( EI) scr, EcI Ec ( bx ( ) eas( d x) ) The stiffness in a crack can also be calculated by another method as below II 1 EcI EsAs( d x)( d x) 3 (4-4) By using the same theory, the axial stiffness also will be obtained as below. ( EA) E A E bx II scr, c c 4.3 Difference of the centroidal axis x after moved h The centroidal axis moves from the original axis which always is at position in the uncracked stage to the area moment equal to 0 after cracking which is shown in Fig By using the area moment equal to 0 to determine the position of the centroidal axis after cracking. The difference x is Where A ( ) e s scomp II B kd Wo 0 x ( A k ) d (4-5) B ( k ) e s u scomp 39
46 e is the modulus ratio between reinforcement and concrete e E E s c s is the area ratio between tension reinforcement and concrete s As A ceff, scomp is the area ratio between the compression reinforcement and the concrete scomp A A scomp ceff, Where Aceff, bd k d is the related height of compression zone k d x d 4.4 Tension stiffening value From Fig 4-1, the distance ( ) between the mean moment-curvature line and the cracked cross section moment-curvature line is called the tension stiffening effect. The value of ( ) describes the magnitude of the tension stiffening effect. Between the cracks the bond stresses are active and the concrete takes over part of the tension from the steel. Thus the reinforcement is being stiffened by the concrete. [16, 17]. Fig 4-3 shows the strains for calculating the crack spacing and the average strains. [18] Fig 4-3 Strains for calculating the crack spacing and the average strains By using the mean bond law from the Model Code [18], Fig 4-4 and Fig 4-5 show the 40
47 basic theory to obtain the tension stiffening value. In Fig 4-4, 1 means the maximum curvature in a cracked section at the beginning of the crack formation stage. By using the mean bond law [18], the mean curvature in a cracked section should be 0.44 by using the theory in CEB-FIP Model Code [18]. So that the m1 1 a 1. In Fig 4-5, the element is (10.44) And the transfer length is in fully developed crack pattern. So the transfer length will be changed to a a []. So the tension stiffening factor also will be changed. Fig.4-4 Curvature at crack section in beginning of crack formation stage by mean bond law Fig 4-5 Curvature at crack in fully developed crack pattern by mean bond law The value of the tension stiffening factor at a fully developed crack pattern is equal to s. cr fdc 1 s, cr s. cr fdc 1 s, cr 41 (4-6) (4-7)
48 Where is the curvature at a cracked section, s, cr scr M Nx ( EI) s, cr N s, cr is the strain at a cracked section scr, ( EA) s, cr 4.5 Calculation of the mean stiffness In the calculation of the mean stiffness of a element, if there is only one action on the element it is easily obtained by the tension stiffening law [1,, 16, 17]. But if there is two or more different actions on the element, the method should be followed as presented below. The black line is the moment-curvature effect line in total element. The red line is the moment-curvature effect in the cracked cross section. The blue line is the moment-curvature effect in the cracked cross section without M which is caused by moving the centroidal axis. Fig 4-5 Moment-curvature relationship by applying both moment and normal force 4
49 The procedure to obtain the mean moment-curvature relationship of whole element which is shown as black line in Fig 4-5 is described as below: 1> Defining the M cr value and position in Y axis. > Calculating the stiffness at a crack ( EI ) s, cr. 3> Using the stiffness at a crack, the slope of the blue line in Fig 4-5 can be defined. 4> Adding the extra moment due to normal force M 5> The position of red line in Fig 4-5 will be defined by using M. 6> Calculating the tension stiffening value. 7> By using tension stiffening law, the position of fdc will be found. 8> At last, the mean moment-curvature relationship of whole element shown as black line will be obtained. From Fig 4-5, the there are 3 different stages in the cracking development: uncracked stage, crack formation stage and fully developed crack stage. So each stage will have different expression of mean stiffness. Uncracked stage: ( EI) m E c I c (4-7) M Crack formation stage: ( EI) m m m s M s (4-8) ( EI) s, cr Fully developed crack stage: M M1 Nx ( EI) m m s (4-9) M 1 is the bending moment after moving the centroidal axis M ( )( EI) ( EI) 1 m s, cr s s, cr M is the original moment without moving the centroidal axis M is the extra moment caused by moving centroidal axis M N x x is the moving distance of centroidal axis is the tension stiffening effect 0.4 s, cr s, cr is the curvature at the cracked cross section under cracking moment s is the curvature at the cracked cross section at the load considered ( EI ) s, cr is the stiffness in a crack Eq. (4-5). 43
50 Chapter 5 Beam under dead load and temperature gradient 44
51 After discussed about the cross section problem, in this chapter, the calculation based on a simple structure will be illustrated. In order to illustrate it more clearly, a clamped beam will be discussed in this chapter to show the characteristics under different loading combination. As solving this problem, the theory of the simple element can be used in some complicated real projects. The simple element is shown in Fig 5-1. It is a clamped beam with tension reinforcement under both dead load and temperature gradient effects. The dead load can be transferred as a uniform distribute load q, and the temperature gradient is T. So there will be a bending moment due to self-weight, and also a bending moment due to thermal difference. A big problem is that how to combine these two actions together, and is there any difference among different combinations? The following calculation will illustrate it. Fig 5-1 Clamped beam under both dead load and temperature gradient For a combination of dead load and temperature gradient, there are many various situations. Such as dead load is given first, and then the temperature gradient is loaded, or exchange the order. For different situations, there will be different procedures and results respectively. So using an appropriate calculation procedure is essential to obtain correct results. All the different situations are listed as below: 1. M ΔT 1.1 M Uncracked ΔT Uncracked 1.1. ΔT Not fully developed cracked pattern ΔT Fully developed cracked pattern 1. M Cracking at ends only 1..1 ΔT Ends Cracking increased No cracking at middle span Cracking at middle span 1.. ΔT Ends cracking decreased No cracking at middle span 1... Cracking at middle span Cracking at middle span but ends cracking disappeared 1.3 M Cracking at both ends and middle span 45
52 1.3.1 ΔT Ends cracking increased Middle span cracking is not disappeared Middle span cracking is disappeared 1.3. ΔT Ends cracking decreased Ends cracking is not disappeared Ends cracking is disappeared. ΔT M.1 ΔT Uncracked.1.1 M Uncracked.1. M Cracking at ends.1.3 M Cracking at both ends and middle span.1.4 M Cracking at middle span. ΔT Not fully developed cracked pattern..1 M Cracking at ends.. M Cracking at both middle span and ends..3 M Cracking at middle span.3 ΔT Fully developed cracked pattern.3.1 M Cracking at ends.3. M Cracking at both middle span and ends.3.3 M Cracking at middle span 3. ΔT & M 3.1 Uncracked 3. Cracked 3..1 Cracking at ends 3.. Cracking at both middle span and ends 3..3 Cracking at middle span In order to illustrate it, one typical condition will be discussed in the following section. And one example will be calculated to prove this theory. 5.1 M ΔT & M cracking at both ends &ΔT enlarge the cracking at ends and no cracking at middle span In this situation, the moment due to uniformly distribute load q will be added first. The beam will crack at both ends for this moment. Then the temperature gradient is loaded, the cracking at ends will increase. It is shown as Fig
53 Fig 5- Loading procedure So the effect caused by dead load only need to be analyzed first, then added the temperature gradient Dead load effect. Dead load of a beam is uniformly distributed. So it can be recognized as a uniform distributed load q. The moment due to dead load should be a parabola line. In order to make the calculation easier, the linear line is instead of parabola line. The moment curve due to dead load is shown as Fig 5-3. The moment due to dead load at end is 1 equal to 1 ql and at mid span is equal to 1 4 ql. Fig 5-3 Moment curve due to dead load In the first step, the cracking length due to moment will be estimated. The length is the area where moment is larger than cracking moment on an uncracked beam which is also shown in Fig 5-3. This estimated length is called L, and this value will be used in the future calculation. Usually the estimated cracking length can be used as the area where the moment is larger than cracking moment on an uncracked beam. The cracking moment can be calculated as 1 Mcr bh cr (5-1) 6 Since the cracking length is estimated, the moment curve due to dead load will be calculated as below. In order to obtain the exact moment due to dead load, the following method will be used. Firstly, this uniformly distributed load can be divided into two parts: one is dead load on a simple support beam, and the other one is a simple support beam with a constant moment which is shown as Fig 5-4. By using this method, the clamped beam will be translated into two simple support beam problems with the rotation at ends equal to 0. It is much easier to calculate the moment curve. 47
54 Fig 5-4 Transition from clamped beam to simple support beam In the Fig 5-4, EI 1 is the stiffness of uncracked part, EI is the stiffness of cracked part which is not fixed and M qend, is the moment at both ends. Considering the first part which is the dead load on the simple support beam, by using symmetry, the stiffness curve, the moment curve and the curvature curve can be easily calculated as shown in the Fig 5-5: 48
55 Fig 5-5 Stiffness, moment and curvature of first part From the second graph in the Fig 5-5, the stiffness in the cracked section can be calculated which is specified in chapter 3 and 4. By applying the equation (3-4), (3-10), (3-17), and (3-14), the compression zone height of the cracked section can be drawn. In this case the compression zone height will be calculated as below, AsEs AE s s( AE s s Ecbd) x (5-) Eb c After obtained the compression zone height, the stiffness on the cracked section will be calculated by using equation (4-3) as below bx x (5-3) 1 3 II ( EI) scr, EcI Ec ( bx ( ) eas( d x) ) By using the knowledge in chapter 4, the stiffness at position Lx should be calculated as below: 49
56 ( EI) x M M end, DL qllx qlx qllx qlx ( EI) end, DL scr (5-4) Where 0.4 scr M scr ( EI ) cr scr The final curvature at point 1,, 3 can be calculated as below: 1 M L EI (5-5) M L (5-6) EI 1 3 M mid EI 1 (5-7) The rotation at cracked section with a certain position L x is x, cracked qllx qlx (5-8) ( EI) x And the rotation at uncracked section with a certain position L x is x, uncracked qllx qlx (5-9) ( EI) c The rotation at end due to dead load on the simple support beam is the uncracked part plus cracked part. So the uncracked part rotation is L1, and the uncracked part rotation is L, so the total rotation at end should be qend, L1 L (5-10) 50
57 Where L qllx qlx L1 dlx ( EI) L c (5-11) L L 0 M M end, DL end, DL qllx qlx dl qllx qlx qllx qlx ( EI) scr x (5-1) Considering the second part which is the constant moment on the simple support beam which is shown in Fig 5-6, by using symmetry, for the moment on the simple support beam, the stiffness curve, the moment curve and the curvature curve are shown in Fig 5-7: Fig 5-6 The second part which is only moment applied on the beam 51
58 Fig 5-7 Stiffness, moment and curvature of second part From the fourth graph in Fig 5-6, the curvature at cracked and uncracked parts can be calculated as below: M 1 M EI M qend, 1 (5-13) qend, M (5-14) EI x Similar as before, the rotation at the end due to moment at this case is: Where L M1 M1 1 (5-15) M qend,, end M 1 M L dl M M x 0 By substituting Equation (5-4), the expression of the total rotation due to moment can be written as L L1 1 end, M ( dl ) x M q, end ( EI) c qll 0 x qlx M end, DL (5-16) M end, DL qllx qlx ( EI) scr Because it is a clamped beam, there is no rotation at the end. So the rotation due to dead load plus the rotation due to constant moment should be equal to 0: q, end M,, 0 qend end (5-17) Substituting (5-10) and (5-16) into (5-17), the moment at end due to dead load on a clamped beam should be M qend, L1 ( EI) c L 0 M M end, DL end, DL end, DL 1 dl qllx qlx qllx qlx ( EI) scr x (5-18) 5
59 So the moment curve due to dead load should be shown as Fig 5-8: Fig 5-8 Moment curve due to dead load For the cracking length L is estimated, so find the moment value at L from the curve in the Fig 5-8. L 1 ( 1) (5-19) L ML ql M q, end And then compare M L with M cr, if they are equal, then the estimation is correct. Otherwise, re-estimate L until M L M. cr Temperature gradient effect. Caused by the dead load effect, the beam has already changed to three parts, two cracked parts and one uncracked part. The cracking length due to dead load is known as L after several iterations. The moment due to temperature gradient should be constant as the Fig 5-9. But the value should be calculated by using the rotation at end which is equal to 0. So by using the similar method in 5.1., the clamped beam with temperature gradient can be divided into two parts as in the Fig Fig 5-9 Moment due to a temperature gradient on an uncracked beam 53
60 Fig 5-10 Transition from clamped beam to simple support beam In order to obtain the actual moment, the cracking length L 3 also should be estimated first. In section graph in Fig 5-10, there is a constant moment on the simple support beam. Similar with Dead load section, by using symmetry, for the moment on the simple support beam, the stiffness curve, the moment curve and the curvature curve are shown in Fig 5-11: 54
61 Fig 5-11 Stiffness, moment and curvature of beam From the fourth graph in Fig 5-11, the curvature at each part can be calculated as below: M 1 EI Tend, (5-0) M EI Tend, 1 (5-1) Similar as before, the rotation at end due to moment at this case is: Where L3 L1 1 M Tend,, end 1 M T, end dl x EI c c ( EI) 0 x ( ) (5-) 55
62 ( EI) x M M qllx qlx M qllx qlx M ( EI) end, DL end, T end, DL end, T scr (5-3) In third graph in Fig 5-10, there is a rotation at end on the simple support beam. The value of this rotation can be directly calculated by the temperature gradient and temperature gradient coefficient as below: rotation T ( L L 1 3) (5-4) From equation (5-4) and (5-), the total rotation should be equal to 0 for it is a clamped beam. (5-5) M,, 0 Tend end rotation Substitute (5-) and (5-4) into (5-5), the moment due to temperature gradient will be obtained: M T L1 EI c c L3 0 M M ( L L ) T dl ) x qllx qlx M qllx qlx M ( EI) end, DL end, T end, DL end, T scr (5-6) At last, plus the moment due to temperature gradient and dead load, the final moment curve will be obtained. Then the moment at position L 3 should be calculated and compare with cracking moment M cr. If they are same, that means the estimated cracking length L 3 is correct. If not same, the cracking length L 3 should be estimated again until they are same. 56
63 5. Example: There is an example which will be used by Tension Stiffening Law to calculate the exact moment distribution shown in Fig 5-1. This is a clamped beam with dead load and a constant temperature gradient. All the parameters of the beam and load are shown as below. Fig 5-1 Clamped beam with dead load and temperature gradient The basic parameters: E N / mm c E 10 N / mm s 5 n E E s c 1.5 cr 3 N / mm L 10000mm h 605mm d 550mm c 55mm A, bd mm As ceff 4000mm q 40 N / mm T 5C 4000 s / C u By using the calculation method in 5.1, the final moment distribution will be obtained. See workings in Appendix. The final moment distribution is shown in the Fig 5-13 as below. In this example, the cracking moment is equal to 8 10 Nmm. The moment at end and middle span are Nmm, Nmm respectively. The cracking length is 1400mm at both end, and there is no cracking at midspan. 57
64 Fig 5-13 The moment distribution on the beam [Nmm] In order to compare the moment distribution with other condition, the moment distribution under following condition will be also calculated and compared. A. Calculation with the uncracked stiffness in the whole span.. Fig 5-14 Moment distribution with uncracked stiffness B. Calculation with the 1/3 uncracked stiffness in whole span. [Nmm] Fig 5-16 Moment distribution with 1/3 uncracked stiffness whole span [Nmm] 58
65 Chapter 6 Calculation including normal force 59
66 Actually, there are many actions on a structure in real projects. Due to many complicated factors, moment and normal stress are the direct effects on the structure. All the loading actions are transformed into effects on the structure. If the complicated system can be easily analysis. In Chapter 5, the clamped beam under both temperature gradient and external loading is discussed. These actions cause moments only, whereas a normal stress will be caused by a normal force. After having applied the normal force, the reinforcement ratio and compression zone height will be changed. Also the moment distribution and stiffness will be changed as the reinforcement ratio and compression zone height changed. So if there is a normal force on the clamped beam, what will be changed? Will one third of the uncracked stiffness still be suited for designing the reinforcement correctly? Fig 6-1 Clamped beam under temperature gradient, uniformly distributed load and normal force In this chapter, the clamped beam will be also used, and the normal force is considered too, which is shown in Fig 6-1. With the similar method of chapter 5, the final state of the moment curve and mean stiffness will be obtained. The specific procedure is shown as Fig 6- as shown below. Fig 6- Analysis procedure There is another matter to which attention should be paid attention that the source of the 60
67 normal force. Usually the normal force is a mechanic load, but there is another important part which might be ignored easily. That is the temperature difference between construction temperature and operating temperature. Due to the difference between two states, some shrinkage or expansion will occur. It also will produce a normal stress. Thus in this chapter, the normal force s source will be considered as both mechanic load and temperature difference. 6.1 Analysis procedure The procedure is similar to the one used in chapter 5, though a little more complicated since including the normal force implies that there is one more procedure in the calculation of the compression zone height. In order to make the calculation procedure much easier, both dead load effect and temperature gradient effect will be considered together in this chapter which is different from that in chapter 5. In this way, the moment of each individual effect is not read directly, but is the result that can be calculated in one formula. The procedure is described below Determine the compression zone height If the reinforcement is unknown, the reinforcement ratio should be determined by cross-section equilibrium.but the compression also is unknown, so the reinforcement ratio and compression zone height need to be estimated first. In the estimated process, one empirical formula is given as below which is close to the correct value. A s M max NT 0.39 h 0.9 d 0.9d s s (6-1) In this equation, the value of M max contain both moment due to external load and temperature gradient. The moment due to temperature gradient can be calculated by using one third of the uncracked stiffness first which is an estimated value but close to the accurate value. After estimated the compression zone height and reinforcement, the following two equations should be checked. If they are not equal, the compression zone height and reinforcement should be estimated iterative again until equation (6-) and (6-3) are tenable. x h x d x h ( ) e ( )( d ) d x M max (6-) d x x ( ) NT e x d 61
68 A s h x Mmax NT ( ) 3 x s ( d ) 3 (6-3) When equation (6-) and (6-3) are tenable, the required reinforcement A s and compression zone height x are obtained. The two values will be used in the future calculation. With the value of compression zone height and reinforcement ratio, the stiffness at cracked cross-section will be obtained by equation (6-4) as below. bx x E EI E bx A d x (6-4) 3 s scr ( c( ( ) s ( ) )) 1 Ec 6.1. End rotation calculation The clamped beam will be divided into 3 parts which is shown in Fig 6-3: simple support beam with moment at ends; simple support beam with a rotation at end; simple support beam with uniform distributed load on the beam. The length of cracked area will be estimated. The length of end cracked area is estimated as L, also the length of middle cracked area is estimated as L 3. These two parameters should be given the estimated values which will be used in the future calculation. At the end of the calculation, these will be checked and iterative. Fig 6-3 Transition from clamped beam to simple support beam 6
69 After estimated the length of cracked zone, the mean stiffness can be obtained by using equation (6-4) by tension stiffening law. According to section 4.5, the stiffness at position L x will be obtained as below. EI x qltotallx qlx M end qltotallx qlx M end EI scr (6-5) Before calculation, the moment at end M end should be estimated too. Using this estimated moment in the calculation of rotation at end. For the uniformly distributed load on the beam, with the similar method in chapter 5, by using symmetry system the stiffness, moment and curvature distribution will be shown in Fig 6-4 as below. Fig 6-4 Stiffness, moment and curvature distribution From Fig 6-4, the curvature at section 1, and 3 can be obtained with the stiffness and moment. 63
70 qltotallx qlx x (6-6) EI x Then the rotation at end due to the uniformly distributed load will be obtained by equation (6-6), which is shown as below: Total rotation of section : qltotallx qlx dl (6-7) ql L ql qltotallx qlx M end EI L, estimated L, DL x 0 total x x M end Total rotation of section 1: Total rotation of section 3: scr qltotallx ql L x 1L, estimated dl (6-8) L1, DL x EI L, estimated c c qltotallx qlx dl (6-9) ql L ql qltotallx qlx M end EI Ltotal L1, DL x L1 L, estimated total x x M end The total rotation at end of the whole beam: scr (6-10) end, DL L1, DL L, DL L3, DL For the second part which is a simply supported beam with a moment at its ends, a similar method can be used to obtain the rotation at the end. The stiffness, moment and curvature distribution are illustrated in Fig 6-5 below. 64
71 Fig 6-4 Stiffness, moment and curvature distribution The total rotation at end in this situation is M c c L1 L, estimated L, estimated end, M end x 0 total x x M end L1 EI Ltotal ( 1 dl ql L ql qltotallx qlx M end EI scr 1 dl ) x qltotallx qlx M end qltotallx qlx M end EI scr (6-11) For the third part which is only a rotation at the end of the simply supported beam, the rotation can be easily calculated by the temperature gradient. Ltotal end, T (6-1) 65
72 6.1.3 End moment and moment due to temperature gradient In order to obtain the moment at end, the boundary condition of the beam is needed. Because it is clamped beam, there is no rotation at end. The sum of rotation at end of all three parts should be equal to zero which is shown in equation (6-13). If it is simple support beam or one end simple support and the other end clamped, the boundary condition will be changed. (6-13) end. DL end, M end, 0 M end By using the boundary condition, the relationship of moment and other parameters will be obtained. Substitute equation (6-10), (6-11) and (6-1) into (6-13), the equation of moment at end will be obtained as below. ql L ql ql L ql ql L ql Ltotal L total x x, estimated L1 L total x x total x x, estimated L total T x x dl dl ql 0 totallx ql x EI L total x x, estimated c c ql L ql L Mend 1L, estimated Mend qltotallx qlx qltotallx qlx Mend Mend EI EI L, estimated 0 scr Ltotal 1 L1 1 dl x total x x EI c c L total x x 1L, estimated Mend dl ql L ql ql L ql x Mend qltotallx qlx qltotallx qlx Mend Mend EI EI scr scr scr dl x (6-14) This end moment should be compared with estimated end moment. These two values should be equal, so that the estimation is correct. If not, the end moment should be estimated again, until the two values are equal. In order to check the estimated value, the moment at position L and L 3 should be calculated as equation (6-15) and (6-16) as below. M L qltotall, estimated ql, estimated Mend (6-15) M ql ( L L ) q( L L ) total, estimated 1, estimated 1 L3 Mend (6-16) If in the estimated stage, one of L and L 3 is equal to 0, which means the cracks is occurred at ends or middle span. So the moment related to the edge of cracking zone should be equal to cracking moment. The moment of L and L 3 which is not equal to 0 should be equal to M cr. If not, the cracking length should be 66
73 estimated again, until M L( L3) M cr. If the cracking occurred at both ends and middle span, the estimation of L and L 3 are both not equal to 0. Now the moment at L and L 3 should be both equal to cracking moment M cr. If not, estimating both values again, until the moment at L and L 3 are equal to M cr. M T L, estimated 0 After three parameters iteration, the end moment and cracking zone position will be determined. The moment curve will be obtained by using these. By using the similar method, the moment due to temperature gradient will be obtained as below. In this calculation, only second and third parts of Fig 6-3 are used. Because the temperature gradient on clamped beam can be divided into a rotation at end on simple support beam and a moment at end on simple support beam. T L total Ltotal 1 L1 1 dl x total x x EI c c L total x x 1L, estimated Mend dl ql L ql ql L ql Mend qltotallx qlx qltotallx qlx Mend Mend EI EI scr scr x (6-17) 6. Design stiffness and mean stiffness In the structural modeling process, there are many influential factors, such as: shrinkage, expansion or some external loading. For the influence of restrained imposed deformation, there is an interaction between the forces generated and the stiffness of the structure, which is influenced by the cracking behavior: the more the stiffness is reduced by cracking, the lower the forces. It is difficult to make a design in which all influencing factors are taken into account. So, when structural modeling imposed deformations, engineers often reduce the uncracked stiffness when modeling the structure and designing the reinforcement. The question arises which reduction factor to use. In practice, Young s modulus is often reduced to 1/3 of its original value. Actually, this value is unlikely to be appropriate for all conditions. Due to the design procedure, the beam is considered as an uncracked beam which only reduced the stiffness to 1/3. But in practice, the beam s geometry is not linear. Due to the nonlinear of geometry, the moment curve due to uniformly distributed load will be changed. If there is some 67
74 cracking at ends, the stiffness at end will be reduced and the stiffness of middle span has no changes. The system looks like a beam with two plastic hinges at end which is shown in Fig 6-5. Fig 6-5 Stiffness distribution on cracked beam So the moment distribution due to a uniformly distributed load will alter. A constant moment change related to the geometry of the cracked zone should be added to the original moment curve. For example, if there are some cracks at the both ends of clamped beam, the moment curve will move down relative to the original moment curve in Fig 6-6. As the cracking length increase, the changed moment value M x will increase. But after the cracking length reach 1/4 of the total length, the changed moment value will start to decrease. When the whole beam is cracked, the changed value will be again reduced to 0. Fig 6-6 Moment translational movement with end cracked Oppositely, if the cracking is occurred at middle span, the stiffness of the middle span zone will reduce. So the stiffness at ends will be higher than middle span. For this 68
75 situation, the clamped beam will be looked like two cantilever beams. Then the moment at end will increase, and the moment and middle span will decrease due to the lower stiffness. The moment curve trend has no changes, so there will be an upward translational movement of the moment curve compared with the original uniformly distributed loading moment. Similar with cracking at ends, after the cracking length is more than half total length, the translational movement of the moment will stop increase but start to decrease. When the total beam is cracked, the moment curve will be changed to the original geometry which is the moment distribution on uncracked beam. Fig 6-7 Moment translational movement with middle span cracked From Fig 6-6 and Fig 6-7, it is seen clearly that in the final state the moment is not only combined with the original uniformly distributed loading moment and the temperature gradient moment, but also with a moment decrease or increase due to the nonlinear properties of the beam. 1 M end M T qltotal 1 1 Mend M T qlto tal M x (6-18) 1 So two definitions of stiffness are given as below: Mean stiffness: Average stiffness including all uncracked and cracked zone. It is the actual 69
76 mean stiffness of the whole beam.this value directly influences the moment due to restrained imposed deformation. M T ( EI) actual (6-19) T Design stiffness: The stiffness difference between the original uniformly distributed loading moment and the moment at final stage. Both the moment due to temperature gradient and the moment changes due to the nonlinear geometry of beam are considered. This value is not actual stiffness. It can be used in the design procedure where engineers need moment estimation due to temperature gradient but with uncracked beam estimation. This value can be directly compared with 1/3 uncracked stiffness which is used in actual projects. In the future of the report, this value will be considered as mean stiffness. M T M x ( EI) design( mean) (6-19) T After obtained the moment due to temperature gradient in equation (6-17) and (6-19), the actual stiffness of the beam can be easily calculated with the curvature of temperature gradient. For the mean stiffness, the value M T M x can be obtained by the equation (6-0). Then the mean stiffness also can be easily calculated. 1 M T M x M end qltotal 1 (6-0) The value in equation (6-19) can be instead of 1/3 uncracked stiffness in the structural modeling and the reinforcement design procedure. This value is more accurate than 1/3 uncracked stiffness. By using the 1/3 uncracked stiffness, there might always be some unexpected cracking or too much reinforcement might be used. If the stiffness in equation (6-19) is used, one can avoid these problems. 6.3 Comparison of mean stiffness with different situations In order to find the difference between mean stiffness and 1/3 uncracked stiffness, and the influence factors of mean stiffness, different situation will be discussed and compared in this chapter. The trend of mean stiffness with different value of different parameters is very important for engineers to understand this topic. It can help engineer to improve their design Comparison with different temperature gradient Different temperature gradient may cause different magnitude and direction moment. The moment due to temperature gradient depend on the actual stiffness of beam and the magnitude of temperature difference. In this section, comparisons 70
77 of different temperature gradient under 3 different situations are discussed: no normal force, tensile normal force and compressive normal force. All the calculation sheets and moment curves are shown in Appendix 4. When there is no normal force on the beam, and the temperature gradient and related mean stiffness are shown as Table 6-1 as below. T(ºC) EIm(N=0)(*10^13Nmm^) Table 6-1 Temperature gradient and related mean stiffness with no normal force So the relationship between temperature gradient and mean stiffness can be illustrated by the curve in Fig 6-8. Fig 6-8 Relationship between temperature gradient and mean stiffness with no normal force 71
78 When the normal force on the beam is positive, which is a tensile normal force with the value equal to 400kN, and the temperature gradient and related mean stiffness are shown in Table 6- below. T(ºC) EIm(N=400) (*10^13Nmm^) Table 6- Temperature gradient and related mean stiffness with 400kN tensile normal force And the relationship between temperature gradient and mean stiffness can be illustrated by the curve in Fig 6-9. Fig 6-9 Relationship between temperature gradient and mean stiffness with 400kN tensile normal force 7
79 When the normal force on the beam is negative, which is a compressive normal force with the value equal to 400kN, and the temperature gradient and related mean stiffness are shown in Table 6-3 below. T(ºC) EIm(N=-400) (*10^13Nmm^) Table 6-3 Temperature gradient and related mean stiffness with 400kN compressive normal force And the relationship between temperature gradient and mean stiffness can be illustrated by the curve in Fig Fig 6-10 Relationship between temperature gradient and mean stiffness with 400kN compressive normal force 73
80 From Fig 6-8 to Fig 6-10, the moment curve due to temperature gradient is similar as double parabola curve. When the temperature gradient is negative, which means upper temperature is larger than lower temperature, the mean stiffness will increase as the value of temperature gradient decrease. Oppositely, when the temperature gradient is positive, which means upper temperature is less than lower temperature, the mean stiffness will increase as the value of temperature gradient increase. Fig 6-8 to 6-10 are combined in one graph which is shown in Fig 6-11, it is clearly seen that the value of mean stiffness compared with 1/3 uncracked stiffness. Under the condition with positive temperature gradient and tensile normal force, the mean stiffness is larger than 1/3 uncracked stiffness, which means the actual moment due to temperature gradient will be larger than the estimated moment due to temperature gradient. So the reinforcement which is designed by estimated temperature gradient moment under 1/3 uncracked stiffness is not enough to carry the actual moment, the cracks might be happened then. It is dangerous when there is both positive temperature gradient and tensile normal force existed. Obviously in this condition the 1/3 uncracked stiffness is not suitable to be used to design the reinforcement. More accurate design stiffness should be calculated by using equation (6-19). Fig 6-11 Relationship between temperature gradient and mean stiffness On the other hand, when there is no normal force or compressive normal force with negative temperature gradient, from Fig 6-11, the mean stiffness is much less than 1/3 uncracked stiffness. Under this circumstance, the structure designed by 1/3 uncracked stiffness is over safe. So less reinforcement can be used compared with the reinforcement designed by 1/3 uncracked stiffness. From Table 6-4 as below, whether using 1/3 uncracked stiffness to estimate moment due to temperature gradient is safe will be illustrated. 74
81 Tensile normal force No normal force Compressive normal force High negative temperature gradient Low negative temperature gradient Low positive temperatur e gradient Safe Safe Safe or dangerous High positive temperature gradient Dangerous Over safe Safe Over safe Safe Over safe Safe Over safe Over safe Table 6-4 Different combination of temperature gradient and normal force 6.3. Comparison with different normal force Different normal force will influence the reinforcement ratio of the structure and the compression zone height of cross-section. These factors will direct or indirect influence the mean stiffness of the structure. Different normal force under different temperature gradient will be compared in this section. Due to the curve of the relationship between normal force and mean stiffness looks like linear line, the regression of the curve will be obtained. All the calculation sheets and moment curves are shown in CD-ROM. When the temperature gradient is negative with the value of -40 degree, which means the upper temperature is higher than lower temperature of the structure, the normal force and the related mean stiffness are shown as Table 6-5 as below. N(kN) EIm(T=-40) (*10^13Nmm^) Table 6-5 Normal force and related mean stiffness with -40ºC temperature gradient From Table 6-5, the relationship between normal force and mean stiffness can be illustrated as curve as Fig
82 Fig 6-1 Relationship between normal force and mean stiffness with a -40ºC temperature gradient By using software Origin, the curve and equation can be regressed as Fig 6-13 and equation (6-1). Fig 6-13 Regression of the mean stiffness-normal force curve ( EI) N (6-1) m When the temperature gradient is negative with the value of -60 degree, which means the upper temperature is higher than lower temperature of the structure, the normal force and the related mean stiffness are shown as Table 6-6 as below. 76
83 N(kN) EIm(T=-60) (*10^13Nmm^) Table 6-6 Normal force and related mean stiffness with -60ºC temperature gradient From Table 6-6, the relationship between normal force and mean stiffness can be illustrated as curve as Fig Fig 6-14 Relationship between normal force and mean stiffness with a -60ºC temperature gradient By using software Origin, the curve and equation can be regressed as Fig 6-15 and equation (6-). 77
84 Fig 6-15 Regression of the mean stiffness-normal force curve ( EI) N (6-) m When the temperature gradient is negative with the value of 40 degree, which means the upper temperature is less than lower temperature of the structure, the normal force and the related mean stiffness are shown as Table 6-7 as below. N(kN) EIm(T=+40) (*10^13Nmm^) Table 6-7 Normal force and related mean stiffness with 40ºC temperature gradient From Table 6-7, the relationship between normal force and mean stiffness can be illustrated as curve as Fig
85 Fig 6-16 Relationship between normal force and mean stiffness with a 40ºC temperature gradient By using software Origin, the curve and equation can be regressed as Fig 6-17 and equation (6-3). Fig 6-17 Regression of the mean stiffness-normal force curve ( EI) N (6-3) m From Fig 6-1, Fig 6-14 and Fig 6-16, the trend is clearly seen that the mean stiffness will increase as the normal force increase. From equation (6-1) to (6-3), the slope and constant value (when normal force is 0) will increase as the positive temperature gradient increase and negative temperature gradient decrease which is 79
86 announced similar in previous section. So as the same result with previous section, it is dangerous for engineers to use 1/3 uncracked stiffness to estimate the moment due to temperature gradient when positive temperature gradient and tensile normal force are happened together. Fig 6-18 Relationship between normal force and mean stiffness Comparison with different q load If the uniformly distributed load is different, the cracking pattern and length will be different too. In this case, the uniformly distribute load is the only mechanic load which directly influence the moment value. So the cracking position of the clamped beam will be influence by the uniformly distributed load. If the q load is not big enough, the cracks will always at ends or middle span which is also depend on the temperature gradient. But if the q load is big enough and the temperature gradient is suitable, there will be cracking at both ends and middle span. What is happened in this situation? Is there any difference with only one part cracking? So in this section, in order to make all cracking phenomenon happened, different q load will be compared under different temperature gradient. In this case there is no normal force added, so mostly the obtained mean stiffness is less than 1/3 uncracked stiffness. The main point of this section is to find out the difference of mean stiffness with different cracking pattern. All the calculation sheets and moment curves are shown in CD-ROM. When the temperature gradient is negative with the value of -40 degree, which means the upper temperature is higher than lower temperature of the structure, the uniformly distributed load and the related mean stiffness are shown as Table 6-8 as below. 80
87 q (N/mm) EIm(T=-40) (*10^13Nmm^) Cracking length(mm) * mid * mid * mid * mid 7* end * mid 88* end * mid 147* end * mid 191* end Table 6-8 Uniformly distributed load with related mean stiffness and cracking length with -40ºC temperature gradient From Table 6-8, the relationship between uniformly distributed load and mean stiffness can be illustrated as curve as Fig 6-19 Fig 6-19 Relationship between uniformly distributed load and mean stiffness When the temperature gradient is negative with the value of -60 degree, which means the upper temperature is higher than lower temperature of the structure, the uniformly distributed load and the related mean stiffness are shown as Table 6-9 as below. q (N/mm) EIm(T=-60) (*10^13Nmm^) Cracking length (mm) * mid * mid * mid * mid * mid 7* end * mid 67* end * mid 113* end Table 6-9 Uniformly distributed load with related mean stiffness and cracking length with -60ºC temperature gradient 81
88 From Table 6-9, the relationship between uniformly distributed load and mean stiffness can be illustrated as curve as Fig 6-0. Fig 6-0 Relationship between uniformly distributed load and mean stiffness When the temperature gradient is negative with the value of 40 degree, which means the upper temperature is higher than lower temperature of the structure, the uniformly distributed load and the related mean stiffness are shown as Table 6-10 as below. q (N/mm) EIm(T=40) (*10^13Nmm^) Cracking length (mm) * end * end * end * end * end * end * end Table 6-10 Uniformly distributed load with related mean stiffness and cracking length with 40ºC temperature gradient From Table 6-10, the relationship between uniformly distributed load and mean stiffness can be illustrated as curve as Fig
89 Fig 6-1 Relationship between uniformly distributed load and mean stiffness Fig 6- is the combination of Fig 6-19 to 6-1. In Fig 6-, when temperature gradient is positive in this case, there is only cracking at end, so the mean stiffness will increase as the q load increase. If the temperature gradient is negative in this case, there will be cracks at both ends and middle span when the value of temperature gradient is large enough. So as shown in Fig 6-, the curve with negative temperature gradient has a transition point when the ends start to crack. When the cracking is only occurred at middle span, the mean stiffness decrease as the q load increase, but after the cracking is occurred at middle span and ends, the mean stiffness start to increase as the q load increase. Fig 6- Relationship between q load and mean stiffness 83
90 Chapter 7 Bio-diesel project 84

91 The Bio-diesel project is an oil industry project. A bracing structure is designed to support the oil tanks on it. Around the slab there is a wall to keep the oil from tanks inside in case of an emergency. As shown in the Fig 7-1 which is a corner part of Bio-diesel project, the oil tank is direct on the slab. In this tank, there is some high temperature liquid oil. For the oil tank is made of steel, so the high temperature will directly have impact at the top of the slab. Fig 7-1 A corner of Bio-diesel project 7.1 Project analysis Due to the structure and condition of the project, there are some load actions on it: dead load of slab, dead load of tank, storage loading of oil in the tank, temperature gradient due to higher temperature at upper of slab and a temperature difference between construction period and using period. Due to these load actions, the corresponding load effects are: uniformly distributed load, normal force and temperature gradient. The normal force on the slab is caused by the temperature difference between construction period and operating period. So a definition will be given of the reference temperature. A normal force will be caused by temperature difference at a specific time or within a specific environment;a standard should be made to distinguish the normal force value caused by temperature difference. So the temperature in the construction period will be considered as reference temperature. During the operating period, the gap between 85
92 reference temperature and operating temperature will cause a normal force which is shown in the Fig 7- as below. Fig 7- Reference temperature and normal force caused by it So in this case the axial loading effect is not only caused by a mechanic normal force, but also by a temperature difference. Even with a proper design of the reinforcement in the Bio-diesel project, there might still be some unexpected cracking in the slab. Engineers ofter assume that this phenomenon has no problem for the whole design procedure. The estimated moment due to temperature gradient in design process is based on1/3 of the Young modulus. From Chapter 6 it is clearly seen that the reinforcement is underestimated when tensile normal force and positive temperature gradient has been applied. When structural modeling imposed deformations, engineers often reduce the uncracked stiffness to 1/3 of uncracked stiffness when modeling the structure and designing the reinforcement. This is the question why the reinforcement might not be enough to carry the load in fact. More accurate design is needed in this project to prevent unexpected cracking occurring. The method mentioned in chapter 6 can be used to make a more exact estimation of reduced Young s modulus. Then a superior reinforcement design can be made by the new Young s modulus. 7. Redesign of the project In the original design of Bio-diesel project, some estimations are used to analyse: no cracking of the slab, Young s modulus is reduced to 1/3 of its original value due to many influenced factors. Under this estimation, a reinforcement ratio can be calculated. Actually, this reinforcement is not proper to every condition. A better design of reinforcement is needed to prevent unexpected cracking or reduce the reinforcement amount. As to this case, the model is a slab. In order to simplify the calculation, the most 86


93 unfavorable part of the slab will be recognized as a clamped beam to analysis. From the stress distribution as a result of a Scia Engineering, the most unfavorable part is the inner part of the edge of the tank which is shown in Fig 7-3. All the parameters at that part will be used in the clamped beam calculation. The calculation procedure is shown in Appendix 5. Fig 7-3 the stress distribution by Scia Engineering So the calculation result is the mean stiffness in design should be used as N mm, and where the 1/3 of uncracked stiffness 14 is N mm. 1/3 uncracked stiffness Mean design stiffness Fig 7-4 Comparison of stress distribution with different design stiffness 87
94 When compared with the stress distributions due to the two design stiffnesses in the Fig 7-4, the difference between both is not too wide. The reason is that the temperature gradient is negative in this case and the tensile force is not very strong. So the actual design mean stiffness should not be larger than 1/3 of the uncracked stiffness. If the normal force is changed, what s happened with the same reinforcement? So a normal force equal to 600kN, 400kN, 00kN, -00kN, -400kN and -600kN was also calculated, and the result is shown in Fig 7-5. The calculation procedures are shown in Appendix 6. Fig 7-5 comparison with different normal force From the Fig 7-5,the higher the tensile normal force added, the higher the mean design stiffness that should be used. If the normal force is higher than 600kN in this case, 1/3 of uncracked stiffness will be a considerable underestimated of actual stiffness. On the other hand, if the temperature gradient is changed from negative to positive, what will happen then? The calculation working is included in the CD-files. After calculation, the mean design stiffness will change from N mm to N mm as the temperature gradient is changed from -40 degree to +40 degree. So the stress distribution will be changed. The stress distribution under two mean design 88

95 stiffnesses is shown in the Fig 7-6 as below. 1/3 uncracked stiffness Mean design stiffness Fig 7-6 Comparison of stress distribution with different design stiffness It is clearly seen that the stress is much higher by using mean design stiffness than using 1/3 of uncracked stiffness. So in order to make a better design of Bio-diesel project, the mean design stiffness is suggested to be instead of 1/3 of uncracked stiffness in reinforcement design. 89
96 Chapter 8 Program for obtaining mean stiffness 90

97 In order to make the calculation simply, some easier method is needed to obtain. Due to the mean stiffness calculation procedure is too complicated, it is impossible for engineering to calculate the mean stiffness every time in each project. According to the experience, some solutions can be used: Calculation table: Making a calculation sheet which includes all the parameter and different situations. Engineers can directly search and find the corresponding value. Calculation program: A calculation program of computer can be developed. Engineers input all the parameters to the program, and the results will be obtained automatic. Safe reduction factor: Because 1/3 Young s modulus is dangerous to be used in the design procedure, so a safer reduction factor can be given to instead of 1/3. From the above three solutions, each of them has positive and negative. For calculation table, the parameters of the case are a little too much which is around 8 parameters. So the table should be very complicated, even there are some appendix tables. Engineers cannot find the result in a short time. For the calculation program, it should be designed by some computer language software. So the computer language should be also good at. For the safe reduction factor, this is the simplest method. But in some other conditions, it might be too much to be used. The reinforcement ratio will be over designed; the budget also will be higher than actual. Finally, the calculation program is chosen to be focused on. The software Matlab and C++ language will be used to design this program. Firstly, the Mathcad equations should be translated to Matlab input as Fig 8-1. Fig 8-1 Translation from Mathcad file to Matlab file 91

98 After input all the data to the Matlab program, combined with C++ language, the program of mean stiffness calculation will be obtained. As shown in Fig 8-, in this program all the parameters will be input in the left window. The results will be shown in the right window such as: cracked zone, moment at end and mean stiffness. All the input files and program will be included in the CD-ROM. Fig 8- Program for calculation of mean stiffness Fig 8-3 Example of calculation This program is only under the condition of clamped beam which mean both the ends are clamped. Under other conditions such as one end clamped and one end simple support, or both ends are simple support are not developed due to time limited and my computer language is not very good. So in the future, the rest conditions will be developed by me or 9

99 someone else. These programs can help engineers to make a better design. Fig 8-4 Condition of the program developed 93
100 Chapter 9 Conclusion and recommendations 94
101 9.1 Conclusion: Compression zone height If there is no axial loading on the cross-section, the compression zone height will be constant when the cross-section is cracked. This value is due to the cross-section properties but not due to the external loading or imposed deformation. The compression zone height is influenced by the ratio of moment and normal force. The relationship looks like a double parabola as in Fig Stiffness distribution on a cracked beam Stiffness depends on the moment of inertia, and inertia depends on the compression zone height. So the stiffness of the cracked area is influenced by the compression zone height. Mean stiffness which is used to calculate the moment due to temperature is the average value of the whole beam. The stiffness distribution on the cracked beam is non-linear. The normal force can also be caused by the temperature difference between the construction period and using period. A negative temperature difference can result in shrinkage; a positive temperature difference can result in expansion. Stiffness used in design procedure When structural modeling imposed deformations, engineers often reduce the uncracked stiffness when modeling the structure and designing the reinforcement. A new definition is given of a mean design stiffness which is to be used in design reinforcement. This reduction factor already considers all the influential action, such as shrinkage, expansion and creep. Usually a factor as 1/3 is used, but this value is not suitable for all the conditions. Some unexpected cracking may occur. The actual mean stiffness is larger than one third of the uncracked stiffness when there is a tensile axial force and a high positive?? temperature gradient. On the other hand, the design mean stiffness might also be less than one third of the uncracked stiffness. Loading sequence There is no difference for the loading sequence. That means that whether external loading or restrained deformation is applied first, the results will be same at the final state. Moment distribution influenced factors After cracking, the non-linear response of the member investigated will influence the bending moment distribution. As a result, the bending moment in a cross-section is not only influenced by external loading and restrained deformation, but also by the stiffness distribution over the length of the member. 9. Recommendations 95
102 Different conditions imply different reinforcement In the condition with positive temperature gradient and tensile normal force, more reinforcement should be used compared with the reinforcement designed with the reduction factor of Young s modulus of 1/3, and especially when the temperature gradient and normal force are high.in order to prevent some unexpected cracking, a more accurate mean stiffness should be calculated In the condition with a negative temperature gradient and a compressive normal force, less reinforcement can be used compared with the reinforcement designed with the reduction factor of Young s modulus to 1/3. In the condition with negative temperature gradient and a tensile normal force, or positive temperature gradient and compressive normal force, the mean stiffness is almost similar to 1/3 of the uncracked stiffness. Program developed A program to calculate the mean stiffness on the clamped beam is developed, which can help the engineers in the design procedure. References 96
103 [1] K. van Breugel. (008): Concrete Structures under imposed deformations. [] Noakowski, P. (1985): Continuous Theory for the Determination of Crack Width under the Consideration of Bond. Beton- und Stahlbetonbau, vol. 80, nos. 7/8, p & [3] Noakowski, P.: Mitwirkungsgesetze zur Ermittlung der Verformungen & Zwangbeanspruchung. Beton- und Stahlbetonbau, H. 1, S , [4] Eurocode EN [5] American Code ACI [6] Dutch Code NEN670 [7] Chinese Code GB50010 [8] J.C. Walraven. (006): Prestressed Concrete [9] H. Hwang. (1984): Probability-Based Load Combinations for the Design of Concrete Containments. Nuclear Engineering and Design 86 (1985) [10] Alessandro P. Fantilli. (009): Multiple cracking and strain hardening in fiber-reinforced concrete under uniaxial tension. Cement and Concrete Research 39 (009) [11] Bernardino Chiaia. (009): Evaluation of crack width in FRC structures and application to tunnel linings. Materials and Structures (009) 4: [1] Darwin, David et al, Debate: Crack Width, Cover and Corrosion, [13] Oesterle, R.G.,: The Role of Concrete Cover in Crack Control Crieria and Corrosion Protection, [14] Gergely P. Maximum Crack Width in Reinforced Concrete Flexural Memebers. Causes, Mechanism, and Control of Cracking in Concrete, SP 0. Detroit; American Concrete Institute. 1968: [15] A Ghali. (00): concrete structures stresses and deformation. [16] Noakowski, P.: Tower Structure Subjected to Temperature and Wind. ACI Structural Journal Volume 87 Issue 4 Pages [17] Noakowski, P.: Die Bewehrung von Stahlbetonbauteilen bei Zwangsbeanspruchung infolge Temperatur. Deutscher ausschuss fur stahlbeton Heft 96. (1978). Vertrieb durch verlag von Wilhelm Ernst & sohn. [18] CEB-FIP Model Code 1990.Thomas Telford. Appendix 1 97
104 For Noakowski s equation (3), The compression zone height is 165mm 98
105 For equation (), So the compression zone height is 165mm 99
106 And check 100
107 Appendix This is the calculation procedure of mean stiffness on a clamped beam. 101
108 10
109 103
110 104
111 105
112 106
113 107
114 108
115 109
116 110
117 111
118 11
119 113
120 Appendix 3 114

121 Appendix 4 These figures are the moment and moment due to temperature gradient under different temperature gradient situations. Fig A-1 Temperature gradient is

122 Fig A- Temperature gradient is -80 Fig A-3 Temperature gradient is

123 Fig A-4 Temperature gradient is
124 Fig A-5 Temperature gradient is

125 Fig A-6 Temperature gradient is
126 Fig A-7 Temperature gradient is -5 Fig A-8 Temperature gradient is -0 10
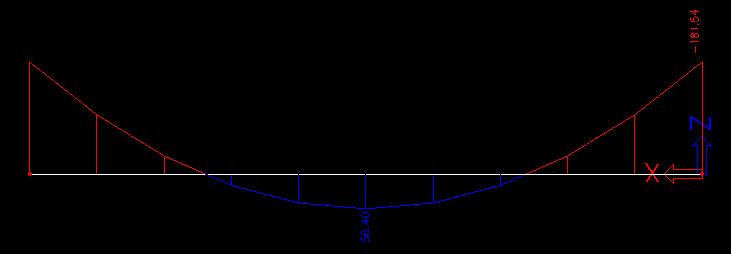
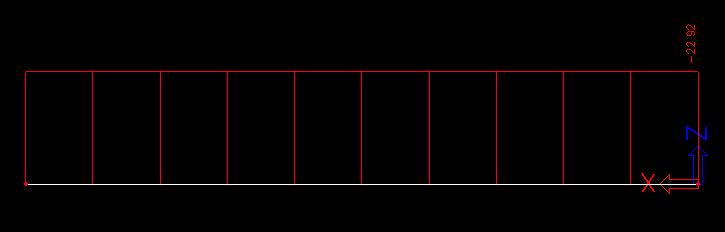
127 Fig A-9 Temperature gradient is

128 Fig A-10 Temperature gradient is +0 1

129 Fig A-11 Temperature gradient is

130 Fig A-1 Temperature gradient is

131 Fig A-13 Temperature gradient is

132 Fig A-14 Temperature gradient is
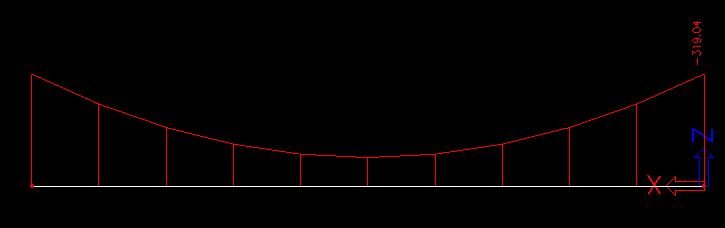
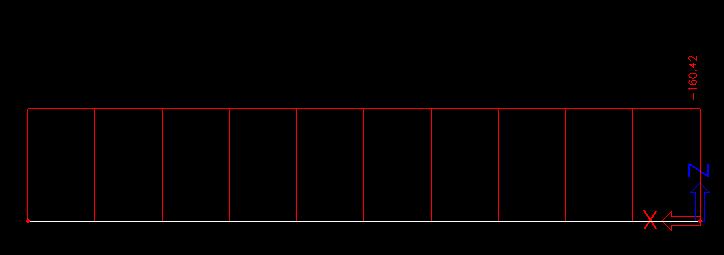
133 Fig A-15 Temperature gradient is

134 Fig A-16 Temperature gradient is

135 Fig A-17 Temperature gradient is +90 Fig A-18 Temperature gradient is
Serviceability Limit States
 Serviceability Limit States www.eurocode2.info 1 Outline Crack control and limitations Crack width calculations Crack width calculation example Crack width calculation problem Restraint cracking Deflection
ε t increases from the compressioncontrolled Figure 9.15: Adjusted interaction diagram
 CHAPTER NINE COLUMNS 4 b. The modified axial strength in compression is reduced to account for accidental eccentricity. The magnitude of axial force evaluated in step (a) is multiplied by 0.80 in case
Serviceability Deflection calculation
 Chp-6:Lecture Goals Serviceability Deflection calculation Deflection example Structural Design Profession is concerned with: Limit States Philosophy: Strength Limit State (safety-fracture, fatigue, overturning
Flexure: Behavior and Nominal Strength of Beam Sections
 4 5000 4000 (increased d ) (increased f (increased A s or f y ) c or b) Flexure: Behavior and Nominal Strength of Beam Sections Moment (kip-in.) 3000 2000 1000 0 0 (basic) (A s 0.5A s ) 0.0005 0.001 0.0015
3.5 Reinforced Concrete Section Properties
 CHAPER 3: Reinforced Concrete Slabs and Beams 3.5 Reinforced Concrete Section Properties Description his application calculates gross section moment of inertia neglecting reinforcement, moment of inertia
Pre-stressed concrete = Pre-compression concrete Pre-compression stresses is applied at the place when tensile stress occur Concrete weak in tension
 Pre-stressed concrete = Pre-compression concrete Pre-compression stresses is applied at the place when tensile stress occur Concrete weak in tension but strong in compression Steel tendon is first stressed
SERVICEABILITY OF BEAMS AND ONE-WAY SLABS
 CHAPTER REINFORCED CONCRETE Reinforced Concrete Design A Fundamental Approach - Fifth Edition Fifth Edition SERVICEABILITY OF BEAMS AND ONE-WAY SLABS A. J. Clark School of Engineering Department of Civil
SERVICEABILITY LIMIT STATE DESIGN
 CHAPTER 11 SERVICEABILITY LIMIT STATE DESIGN Article 49. Cracking Limit State 49.1 General considerations In the case of verifications relating to Cracking Limit State, the effects of actions comprise
Appendix K Design Examples
 Appendix K Design Examples Example 1 * Two-Span I-Girder Bridge Continuous for Live Loads AASHTO Type IV I girder Zero Skew (a) Bridge Deck The bridge deck reinforcement using A615 rebars is shown below.
Chapter. Materials. 1.1 Notations Used in This Chapter
 Chapter 1 Materials 1.1 Notations Used in This Chapter A Area of concrete cross-section C s Constant depending on the type of curing C t Creep coefficient (C t = ε sp /ε i ) C u Ultimate creep coefficient
Lecture-05 Serviceability Requirements & Development of Reinforcement
 Lecture-05 Serviceability Requirements & Development of Reinforcement By: Prof Dr. Qaisar Ali Civil Engineering Department UET Peshawar drqaisarali@uetpeshawar.edu.pk www.drqaisarali.com 1 Section 1: Deflections
9.5 Compression Members
 9.5 Compression Members This section covers the following topics. Introduction Analysis Development of Interaction Diagram Effect of Prestressing Force 9.5.1 Introduction Prestressing is meaningful when
Simplified procedures for calculation of instantaneous and long-term deflections of reinforced concrete beams
 Simplified procedures for calculation of instantaneous and long-term deflections of reinforced concrete beams José Milton de Araújo 1 Department of Materials and Construction, University of Rio Grande
1. ARRANGEMENT. a. Frame A1-P3. L 1 = 20 m H = 5.23 m L 2 = 20 m H 1 = 8.29 m L 3 = 20 m H 2 = 8.29 m H 3 = 8.39 m. b. Frame P3-P6
 Page 3 Page 4 Substructure Design. ARRANGEMENT a. Frame A-P3 L = 20 m H = 5.23 m L 2 = 20 m H = 8.29 m L 3 = 20 m H 2 = 8.29 m H 3 = 8.39 m b. Frame P3-P6 L = 25 m H 3 = 8.39 m L 2 = 3 m H 4 = 8.5 m L
CHAPTER 6: ULTIMATE LIMIT STATE
 CHAPTER 6: ULTIMATE LIMIT STATE 6.1 GENERAL It shall be in accordance with JSCE Standard Specification (Design), 6.1. The collapse mechanism in statically indeterminate structures shall not be considered.
CHAPTER 4. ANALYSIS AND DESIGN OF COLUMNS
 4.1. INTRODUCTION CHAPTER 4. ANALYSIS AND DESIGN OF COLUMNS A column is a vertical structural member transmitting axial compression loads with or without moments. The cross sectional dimensions of a column
Estimation of the Residual Stiffness of Fire-Damaged Concrete Members
 Copyright 2011 Tech Science Press CMC, vol.22, no.3, pp.261-273, 2011 Estimation of the Residual Stiffness of Fire-Damaged Concrete Members J.M. Zhu 1, X.C. Wang 1, D. Wei 2, Y.H. Liu 2 and B.Y. Xu 2 Abstract:
Design of Reinforced Concrete Structures (II)
") Design of Reinforced Concrete Structures (II) Discussion Eng. Mohammed R. Kuheil Review The thickness of one-way ribbed slabs After finding the value of total load (Dead and live loads), the elements are
Design of Reinforced Concrete Structures (II) Discussion Eng. Mohammed R. Kuheil Review The thickness of one-way ribbed slabs After finding the value of total load (Dead and live loads), the elements are
Redistribution of force concentrations in reinforced concrete cantilever slab using 3D non-linear FE analyses
 y x m y m y Linear elastic isotropic Linear elastic orthotropic Plastic Redistribution of force concentrations in reinforced concrete cantilever slab using 3D non-linear FE analyses x Master of Science
Delhi Noida Bhopal Hyderabad Jaipur Lucknow Indore Pune Bhubaneswar Kolkata Patna Web: Ph:
 Serial : IG1_CE_G_Concrete Structures_100818 Delhi Noida Bhopal Hyderabad Jaipur Lucknow Indore Pune Bhubaneswar Kolkata Patna Web: E-mail: info@madeeasy.in Ph: 011-451461 CLASS TEST 018-19 CIVIL ENGINEERING
Therefore, for all members designed according to ACI 318 Code, f s =f y at failure, and the nominal strength is given by:
 5.11. Under-reinforced Beams (Read Sect. 3.4b oour text) We want the reinforced concrete beams to fail in tension because is not a sudden failure. Therefore, following Figure 5.3, you have to make sure
March 24, Chapter 4. Deflection and Stiffness. Dr. Mohammad Suliman Abuhaiba, PE
 Chapter 4 Deflection and Stiffness 1 2 Chapter Outline Spring Rates Tension, Compression, and Torsion Deflection Due to Bending Beam Deflection Methods Beam Deflections by Superposition Strain Energy Castigliano
STATICALLY INDETERMINATE STRUCTURES
 STATICALLY INDETERMINATE STRUCTURES INTRODUCTION Generally the trusses are supported on (i) a hinged support and (ii) a roller support. The reaction components of a hinged support are two (in horizontal
Lecture-04 Design of RC Members for Shear and Torsion
 Lecture-04 Design of RC Members for Shear and Torsion By: Prof. Dr. Qaisar Ali Civil Engineering Department UET Peshawar drqaisarali@uetpeshawar.edu.pk www.drqaisarali.com 1 Topics Addressed Design of
PURE BENDING. If a simply supported beam carries two point loads of 10 kn as shown in the following figure, pure bending occurs at segment BC.
 BENDING STRESS The effect of a bending moment applied to a cross-section of a beam is to induce a state of stress across that section. These stresses are known as bending stresses and they act normally
Mechanics of Materials Primer
 Mechanics of Materials rimer Notation: A = area (net = with holes, bearing = in contact, etc...) b = total width of material at a horizontal section d = diameter of a hole D = symbol for diameter E = modulus
Appendix J. Example of Proposed Changes
 Appendix J Example of Proposed Changes J.1 Introduction The proposed changes are illustrated with reference to a 200-ft, single span, Washington DOT WF bridge girder with debonded strands and no skew.
Design of AAC wall panel according to EN 12602
 Design of wall panel according to EN 160 Example 3: Wall panel with wind load 1.1 Issue Design of a wall panel at an industrial building Materials with a compressive strength 3,5, density class 500, welded
Reinforced Concrete Structures
 Reinforced Concrete Structures MIM 232E Dr. Haluk Sesigür I.T.U. Faculty of Architecture Structural and Earthquake Engineering WG Ultimate Strength Theory Design of Singly Reinforced Rectangular Beams
STRUCTURAL ANALYSIS CHAPTER 2. Introduction
 CHAPTER 2 STRUCTURAL ANALYSIS Introduction The primary purpose of structural analysis is to establish the distribution of internal forces and moments over the whole part of a structure and to identify
Neutral Axis Depth for a Reinforced Concrete Section. Under Eccentric Axial Load
 Neutral Axis Depth for a Reinforced Concrete Section Doug Jenkins; Interactive Design Services Pty Ltd Under Eccentric Axial Load To determine the stresses in a reinforced concrete section we must first
Seismic Pushover Analysis Using AASHTO Guide Specifications for LRFD Seismic Bridge Design
 Seismic Pushover Analysis Using AASHTO Guide Specifications for LRFD Seismic Bridge Design Elmer E. Marx, Alaska Department of Transportation and Public Facilities Michael Keever, California Department
MODELLING NON-LINEAR BEHAVIOUR OF STEEL FIBRE REINFORCED CONCRETE
 6th RILEM Symposium on Fibre-Reinforced Concretes (FRC) - BEFIB - September, Varenna, Italy MODELLING NON-LINEAR BEHAVIOUR OF STEEL FIBRE REINFORCED CONCRETE W. A. Elsaigh, J. M. Robberts and E.P. Kearsley
TIME-DEPENDENT ANALYSIS OF PARTIALLY PRESTRESSED CONTINUOUS COMPOSITE BEAMS
 2nd Int. PhD Symposium in Civil Engineering 998 Budapest IME-DEPENDEN ANAYSIS OF PARIAY PRESRESSED CONINUOUS COMPOSIE BEAMS M. Sar and Assoc. Prof. J. apos 2 Slova echnical University, Faculty of Civil
Lecture-03 Design of Reinforced Concrete Members for Flexure and Axial Loads
 Lecture-03 Design of Reinforced Concrete Members for Flexure and Axial Loads By: Prof. Dr. Qaisar Ali Civil Engineering Department UET Peshawar drqaisarali@uetpeshawar.edu.pk www.drqaisarali.com Prof.
Chapter 5 Elastic Strain, Deflection, and Stability 1. Elastic Stress-Strain Relationship
 Chapter 5 Elastic Strain, Deflection, and Stability Elastic Stress-Strain Relationship A stress in the x-direction causes a strain in the x-direction by σ x also causes a strain in the y-direction & z-direction
POST-PEAK BEHAVIOR OF FRP-JACKETED REINFORCED CONCRETE COLUMNS
 POST-PEAK BEHAVIOR OF FRP-JACKETED REINFORCED CONCRETE COLUMNS - Technical Paper - Tidarut JIRAWATTANASOMKUL *1, Dawei ZHANG *2 and Tamon UEDA *3 ABSTRACT The objective of this study is to propose a new
Roadway Grade = m, amsl HWM = Roadway grade dictates elevation of superstructure and not minimum free board requirement.
 Example on Design of Slab Bridge Design Data and Specifications Chapter 5 SUPERSTRUCTURES Superstructure consists of 10m slab, 36m box girder and 10m T-girder all simply supported. Only the design of Slab
SIMPLIFIED METHOD FOR PREDICTING DEFORMATIONS OF RC FRAMES DURING FIRE EXPOSURE
 SIMPLIFIED METHOD FOR PREDICTING DEFORMATIONS OF RC FRAMES DURING FIRE EXPOSURE M.A. Youssef a, S.F. El-Fitiany a a Western University, Faculty of Engineering, London, Ontario, Canada Abstract Structural
Software Verification
 EXAMPLE 16 racked Slab Analysis RAKED ANALYSIS METHOD The moment curvature diagram shown in Figure 16-1 depicts a plot of the uncracked and cracked conditions, Ψ 1 State 1, and, Ψ State, for a reinforced
FLEXURAL MODELLING OF STRAIN SOFTENING AND STRAIN HARDENING FIBER REINFORCED CONCRETE
 Proceedings, Pro. 53, S.A.R.L., Cachan, France, pp.55-6, 7. FLEXURAL MODELLING OF STRAIN SOFTENING AND STRAIN HARDENING FIBER REINFORCED CONCRETE Chote Soranakom and Barzin Mobasher Department of Civil
Bending and Shear in Beams
 Bending and Shear in Beams Lecture 3 5 th October 017 Contents Lecture 3 What reinforcement is needed to resist M Ed? Bending/ Flexure Section analysis, singly and doubly reinforced Tension reinforcement,
Slenderness Effects for Concrete Columns in Sway Frame - Moment Magnification Method (CSA A )
") Slenderness Effects for Concrete Columns in Sway Frame - Moment Magnification Method (CSA A23.3-94) Slender Concrete Column Design in Sway Frame Buildings Evaluate slenderness effect for columns in a
Slenderness Effects for Concrete Columns in Sway Frame - Moment Magnification Method (CSA A23.3-94) Slender Concrete Column Design in Sway Frame Buildings Evaluate slenderness effect for columns in a
FIXED BEAMS IN BENDING
 FIXED BEAMS IN BENDING INTRODUCTION Fixed or built-in beams are commonly used in building construction because they possess high rigidity in comparison to simply supported beams. When a simply supported
CHAPTER 5. Beam Theory
 CHPTER 5. Beam Theory SangJoon Shin School of Mechanical and erospace Engineering Seoul National University ctive eroelasticity and Rotorcraft Lab. 5. The Euler-Bernoulli assumptions One of its dimensions
Evaluation of Flexural Stiffness for RC Beams During Fire Events
 3 rd International Structural Specialty Conference 3 ième conférence internationale spécialisée sur le génie des structures Edmonton, Alberta June 6-9, 202 / 6 au 9 juin 202 Evaluation of Flexural Stiffness
A PARAMETRIC STUDY ON BUCKLING OF R/C COLUMNS EXPOSED TO FIRE
 Proceedings of the International Conference in Dubrovnik, 15-16 October 215 A PARAMETRIC STUDY ON BUCKLING OF R/C COLUMNS EXPOSED TO FIRE Lijie Wang, Robby Caspeele, Luc Taerwe Ghent University, Department
DETERMINATION OF DUCTILITY CAPACITY AND OTHER SECTION PROPERTIES OF T-SHAPED RC WALLS IN DIRECT DISPLACEMENT-BASED DESIGN
 DETERMINATION OF DUCTILITY CAPACITY AND OTHER SECTION PROPERTIES OF T-SHAPED RC WALLS IN DIRECT DISPLACEMENT-BASED DESIGN E. Smyrou 1, T.J. Sullivan 2, M.J.N. Priestley 3 and G.M. Calvi 4 1 PhD Candidate,
Dynamic analysis of a reinforced concrete shear wall with strain rate effect. Synopsis. Introduction
 Dynamic analysis of a reinforced concrete shear wall with strain rate effect Synopsis A simplified analysis method for a reinforced concrete shear wall structure considering strain rate effects is presented.
- Rectangular Beam Design -
 Semester 1 2016/2017 - Rectangular Beam Design - Department of Structures and Material Engineering Faculty of Civil and Environmental Engineering University Tun Hussein Onn Malaysia Introduction The purposes
3.5 Analysis of Members under Flexure (Part IV)
") 3.5 Analysis o Members under Flexure (Part IV) This section covers the ollowing topics. Analysis o a Flanged Section 3.5.1 Analysis o a Flanged Section Introduction A beam can have langes or lexural eiciency.
3.5 Analysis o Members under Flexure (Part IV) This section covers the ollowing topics. Analysis o a Flanged Section 3.5.1 Analysis o a Flanged Section Introduction A beam can have langes or lexural eiciency.
7 Vlasov torsion theory
 7 Vlasov torsion theory P.C.J. Hoogenboom, October 006 Restrained Warping The typical torsion stresses according to De Saint Venant only occur if warping can take place freely (Fig. 1). In engineering
Bridge deck modelling and design process for bridges
 EU-Russia Regulatory Dialogue Construction Sector Subgroup 1 Bridge deck modelling and design process for bridges Application to a composite twin-girder bridge according to Eurocode 4 Laurence Davaine
Lecture-08 Gravity Load Analysis of RC Structures
 Lecture-08 Gravity Load Analysis of RC Structures By: Prof Dr. Qaisar Ali Civil Engineering Department UET Peshawar www.drqaisarali.com 1 Contents Analysis Approaches Point of Inflection Method Equivalent
Derivation of minimum steel ratio: based on service applied stresses
 MATEC Web of Conferences, () DOI:./ matecconf/ Derivation of minimum steel ratio: based on service applied stresses Humam AL Sebai,*, Salah Al Toubat University of Sharjah, Sharjah city, UAE Abstract.
If you take CT5143 instead of CT4143 then write this at the first of your answer sheets and skip problem 4 and 6.
 Delft University of Technology Faculty of Civil Engineering and Geosciences Structural Mechanics Section Write your name and study number at the top right-hand of your work. Exam CT4143 Shell Analysis
Karbala University College of Engineering Department of Civil Eng. Lecturer: Dr. Jawad T. Abodi
 Chapter 05 Structural Steel Design According to the AISC Manual 13 th Edition Analysis and Design of Beams By Dr. Jawad Talib Al-Nasrawi University of Karbala Department of Civil Engineering 71 Introduction
Design of reinforced concrete sections according to EN and EN
 Design of reinforced concrete sections according to EN 1992-1-1 and EN 1992-2 Validation Examples Brno, 21.10.2010 IDEA RS s.r.o. South Moravian Innovation Centre, U Vodarny 2a, 616 00 BRNO tel.: +420-511
A.2 AASHTO Type IV, LRFD Specifications
 A.2 AASHTO Type IV, LRFD Specifications A.2.1 INTRODUCTION A.2.2 DESIGN PARAMETERS 1'-5.0" Detailed example showing sample calculations for design of typical Interior AASHTO Type IV prestressed concrete
five Mechanics of Materials 1 ARCHITECTURAL STRUCTURES: FORM, BEHAVIOR, AND DESIGN DR. ANNE NICHOLS SUMMER 2017 lecture
 ARCHITECTURAL STRUCTURES: FORM, BEHAVIOR, AND DESIGN DR. ANNE NICHOLS SUMMER 2017 lecture five mechanics www.carttalk.com of materials Mechanics of Materials 1 Mechanics of Materials MECHANICS MATERIALS
Part 1 is to be completed without notes, beam tables or a calculator. DO NOT turn Part 2 over until you have completed and turned in Part 1.
 NAME CM 3505 Fall 06 Test 2 Part 1 is to be completed without notes, beam tables or a calculator. Part 2 is to be completed after turning in Part 1. DO NOT turn Part 2 over until you have completed and
Lecture 15 Strain and stress in beams
 Spring, 2019 ME 323 Mechanics of Materials Lecture 15 Strain and stress in beams Reading assignment: 6.1 6.2 News: Instructor: Prof. Marcial Gonzalez Last modified: 1/6/19 9:42:38 PM Beam theory (@ ME
(Refer Slide Time: 01:00 01:01)
") Strength of Materials Prof: S.K.Bhattacharya Department of Civil Engineering Indian institute of Technology Kharagpur Lecture no 27 Lecture Title: Stresses in Beams- II Welcome to the second lesson of
Strength of Materials Prof: S.K.Bhattacharya Department of Civil Engineering Indian institute of Technology Kharagpur Lecture no 27 Lecture Title: Stresses in Beams- II Welcome to the second lesson of
Strengthening of columns with FRP
 with FRP Professor Dr. Björn Täljsten Luleå University of Technology Sto Scandinavia AB 9/12/2013 Agenda Case study Restrained transverse expansion (confinement) Circular and rectangular cross sections
Influence of residual stresses in the structural behavior of. tubular columns and arches. Nuno Rocha Cima Gomes
 October 2014 Influence of residual stresses in the structural behavior of Abstract tubular columns and arches Nuno Rocha Cima Gomes Instituto Superior Técnico, Universidade de Lisboa, Portugal Contact:
3. BEAMS: STRAIN, STRESS, DEFLECTIONS
 3. BEAMS: STRAIN, STRESS, DEFLECTIONS The beam, or flexural member, is frequently encountered in structures and machines, and its elementary stress analysis constitutes one of the more interesting facets
Fire resistance assessment of composite steel-concrete structures
 Workshop Structural Fire Design of Buildings according to the Eurocodes Brussels, 78 November 0 Fire resistance assessment of composite steelconcrete structures Basic design methods Worked examples CAJOT
DESIGN OF DOWELS FOR SHEAR TRANSFER AT THE INTERFACE BETWEEN CONCRETE CAST AT DIFFERENT TIMES: A CASE STUDY
 DESIGN OF DOWELS FOR SHEAR TRANSFER AT THE INTERFACE BETWEEN CONCRETE CAST AT DIFFERENT TIMES: A CASE STUDY Samayamanthree Mudiyanselage Premasiri Karunarathna 118614J Degree of Master of Engineering in
Practical Design to Eurocode 2
 Practical Design to Eurocode 2 The webinar will start at 12.30 (Any questions beforehand? use Questions on the GoTo Control Panel) Course Outline Lecture Date Speaker Title 1 21 Sep Jenny Burridge Introduction,
Civil Engineering Design (1) Design of Reinforced Concrete Columns 2006/7
 Design of Reinforced Concrete Columns 2006/7") Civil Engineering Design (1) Design of Reinforced Concrete Columns 2006/7 Dr. Colin Caprani, Chartered Engineer 1 Contents 1. Introduction... 3 1.1 Background... 3 1.2 Failure Modes... 5 1.3 Design Aspects...
Civil Engineering Design (1) Design of Reinforced Concrete Columns 2006/7 Dr. Colin Caprani, Chartered Engineer 1 Contents 1. Introduction... 3 1.1 Background... 3 1.2 Failure Modes... 5 1.3 Design Aspects...
Analytical Model for Estimating Long-Term Deflections of Two-Way Reinforced Concrete Slabs *
 Analytical Model for Estimating Long-Term Deflections of Two-Way Reinforced Concrete Slabs * Dr. Bayan Salim Al-Nu'man Civil Engineering Department, College of Engineering Al-Mustansiriya University, Baghdad,
SPECIFIC VERIFICATION Chapter 5
 As = 736624/(0.5*413.69) = 3562 mm 2 (ADAPT 3569 mm 2, B29, C6) Data Block 27 - Compressive Stresses The initial compressive strength, f ci, is the strength entered in the Material/Concrete input screen.
Lab Exercise #5: Tension and Bending with Strain Gages
 Lab Exercise #5: Tension and Bending with Strain Gages Pre-lab assignment: Yes No Goals: 1. To evaluate tension and bending stress models and Hooke s Law. a. σ = Mc/I and σ = P/A 2. To determine material
4.3 Moment Magnification
 CHAPTER 4: Reinforced Concrete Columns 4.3 Moment Magnification Description An ordinary or first order frame analysis does not include either the effects of the lateral sidesway deflections of the column
RETAINING WALL ANALYSIS
 Retaining Wall Analysis Example (EN997:2004) GEODOMISI Ltd. Dr. Costas Sachpazis Consulting Company for Tel.: (+30) 20 523827, 20 57263 Fax.:+30 20 5746 App'd by RETAINING WALL ANALYSIS In accordance with
Accordingly, the nominal section strength [resistance] for initiation of yielding is calculated by using Equation C-C3.1.
![Accordingly, the nominal section strength [resistance] for initiation of yielding is calculated by using Equation C-C3.1.](/thumbs/89/98617066.jpg "Accordingly, the nominal section strength [resistance] for initiation of yielding is calculated by using Equation C-C3.1.") C3 Flexural Members C3.1 Bending The nominal flexural strength [moment resistance], Mn, shall be the smallest of the values calculated for the limit states of yielding, lateral-torsional buckling and distortional
C3 Flexural Members C3.1 Bending The nominal flexural strength [moment resistance], Mn, shall be the smallest of the values calculated for the limit states of yielding, lateral-torsional buckling and distortional
Chapter 4. Test results and discussion. 4.1 Introduction to Experimental Results
 Chapter 4 Test results and discussion This chapter presents a discussion of the results obtained from eighteen beam specimens tested at the Structural Technology Laboratory of the Technical University
Parametric analysis and torsion design charts for axially restrained RC beams
 Structural Engineering and Mechanics, Vol. 55, No. 1 (2015) 1-27 DOI: http://dx.doi.org/10.12989/sem.2015.55.1.001 1 Parametric analysis and torsion design charts for axially restrained RC beams Luís F.A.
Annex - R C Design Formulae and Data
 The design formulae and data provided in this Annex are for education, training and assessment purposes only. They are based on the Hong Kong Code of Practice for Structural Use of Concrete 2013 (HKCP-2013).
Software Verification
 PROGRAM NAME: SAFE 014 EXAMPLE 16 racked Slab Analysis RAKED ANALYSIS METHOD The moment curvature diagram shown in Figure 16-1 depicts a plot of the uncracked and cracked conditions, 1 State 1, and, State,
Design of Reinforced Concrete Beam for Shear
 Lecture 06 Design of Reinforced Concrete Beam for Shear By: Prof Dr. Qaisar Ali Civil Engineering Department UET Peshawar drqaisarali@uetpeshawar.edu.pk 1 Topics Addressed Shear Stresses in Rectangular
Finite Element Modelling with Plastic Hinges
 01/02/2016 Marco Donà Finite Element Modelling with Plastic Hinges 1 Plastic hinge approach A plastic hinge represents a concentrated post-yield behaviour in one or more degrees of freedom. Hinges only
Mechanics of Structure
 S.Y. Diploma : Sem. III [CE/CS/CR/CV] Mechanics of Structure Time: Hrs.] Prelim Question Paper Solution [Marks : 70 Q.1(a) Attempt any SIX of the following. [1] Q.1(a) Define moment of Inertia. State MI
twenty one concrete construction: shear & deflection ARCHITECTURAL STRUCTURES: FORM, BEHAVIOR, AND DESIGN DR. ANNE NICHOLS SUMMER 2014 lecture
 ARCHITECTURAL STRUCTURES: FORM, BEHAVIOR, AND DESIGN DR. ANNE NICHOLS SUMMER 2014 lecture twenty one concrete construction: Copyright Kirk Martini shear & deflection Concrete Shear 1 Shear in Concrete
Practical Design to Eurocode 2. The webinar will start at 12.30
 Practical Design to Eurocode 2 The webinar will start at 12.30 Course Outline Lecture Date Speaker Title 1 21 Sep Jenny Burridge Introduction, Background and Codes 2 28 Sep Charles Goodchild EC2 Background,
Generation of Biaxial Interaction Surfaces
 COPUTERS AND STRUCTURES, INC., BERKELEY, CALIFORNIA AUGUST 2002 CONCRETE FRAE DESIGN BS 8110-97 Technical Note This Technical Note describes how the program checks column capacity or designs reinforced
A METHOD OF LOAD INCREMENTS FOR THE DETERMINATION OF SECOND-ORDER LIMIT LOAD AND COLLAPSE SAFETY OF REINFORCED CONCRETE FRAMED STRUCTURES
 A METHOD OF LOAD INCREMENTS FOR THE DETERMINATION OF SECOND-ORDER LIMIT LOAD AND COLLAPSE SAFETY OF REINFORCED CONCRETE FRAMED STRUCTURES Konuralp Girgin (Ph.D. Thesis, Institute of Science and Technology,
Second-order Analysis of Cable-stayed Bridge Deck Slabs
 Western University Scholarship@Western Electronic Thesis and Dissertation Repository September 2013 Second-order Analysis of Cable-stayed Bridge Deck Slabs Zachary McNeil The University of Western Ontario
Chapter 4 Deflection and Stiffness
 Chapter 4 Deflection and Stiffness Asst. Prof. Dr. Supakit Rooppakhun Chapter Outline Deflection and Stiffness 4-1 Spring Rates 4-2 Tension, Compression, and Torsion 4-3 Deflection Due to Bending 4-4 Beam
Name :. Roll No. :... Invigilator s Signature :.. CS/B.TECH (CE-NEW)/SEM-3/CE-301/ SOLID MECHANICS
/SEM-3/CE-301/ SOLID MECHANICS") Name :. Roll No. :..... Invigilator s Signature :.. 2011 SOLID MECHANICS Time Allotted : 3 Hours Full Marks : 70 The figures in the margin indicate full marks. Candidates are required to give their answers
Name :. Roll No. :..... Invigilator s Signature :.. 2011 SOLID MECHANICS Time Allotted : 3 Hours Full Marks : 70 The figures in the margin indicate full marks. Candidates are required to give their answers
PLATE GIRDERS II. Load. Web plate Welds A Longitudinal elevation. Fig. 1 A typical Plate Girder
 16 PLATE GIRDERS II 1.0 INTRODUCTION This chapter describes the current practice for the design of plate girders adopting meaningful simplifications of the equations derived in the chapter on Plate Girders
THEME IS FIRST OCCURANCE OF YIELDING THE LIMIT?
 CIE309 : PLASTICITY THEME IS FIRST OCCURANCE OF YIELDING THE LIMIT? M M - N N + + σ = σ = + f f BENDING EXTENSION Ir J.W. Welleman page nr 0 kn Normal conditions during the life time WHAT HAPPENS DUE TO
2 marks Questions and Answers
 1. Define the term strain energy. A: Strain Energy of the elastic body is defined as the internal work done by the external load in deforming or straining the body. 2. Define the terms: Resilience and
Chapter 3. Load and Stress Analysis
 Chapter 3 Load and Stress Analysis 2 Shear Force and Bending Moments in Beams Internal shear force V & bending moment M must ensure equilibrium Fig. 3 2 Sign Conventions for Bending and Shear Fig. 3 3
MECHANICS OF MATERIALS Sample Problem 4.2
 Sample Problem 4. SOLUTON: Based on the cross section geometry, calculate the location of the section centroid and moment of inertia. ya ( + Y Ad ) A A cast-iron machine part is acted upon by a kn-m couple.
Basic Energy Principles in Stiffness Analysis
 Basic Energy Principles in Stiffness Analysis Stress-Strain Relations The application of any theory requires knowledge of the physical properties of the material(s) comprising the structure. We are limiting
RETAINING WALL ANALYSIS
 GEODOMISI Ltd. Dr. Costas Sachpazis Consulting Company for Tel.: (+30) 20 523827, 20 57263 Fax.:+30 20 5746 Retaining wall Analysis & Design (EN997:2004 App'd by RETAINING WALL ANALYSIS In accordance with
Standardisation of UHPC in Germany
 Standardisation of UHPC in Germany Part II: Development of Design Rules, University of Siegen Prof. Dr.-Ing. Ekkehard Fehling, University of Kassel 1 Overvie Introduction: Work of the Task Group Design
ENG2000 Chapter 7 Beams. ENG2000: R.I. Hornsey Beam: 1
 ENG2000 Chapter 7 Beams ENG2000: R.I. Hornsey Beam: 1 Overview In this chapter, we consider the stresses and moments present in loaded beams shear stress and bending moment diagrams We will also look at
Flexural properties of polymers
 A2 _EN BUDAPEST UNIVERSITY OF TECHNOLOGY AND ECONOMICS FACULTY OF MECHANICAL ENGINEERING DEPARTMENT OF POLYMER ENGINEERING Flexural properties of polymers BENDING TEST OF CHECK THE VALIDITY OF NOTE ON