Geog183: Cartographic Design and Geovisualization Spring Quarter 2016 Lecture 15: Dealing with Uncertainty
|
|
|
- Austin Matthews
- 6 years ago
- Views:
Transcription


1 Geog183: Cartographic Design and Geovisualization Spring Quarter 2016 Lecture 15: Dealing with Uncertainty
2 All maps are distortions It s not easy to lie with maps, it s essential...to present a useful and truthful picture, an accurate map must tell white lies. -- Mark Monmonier A map is a set of errors that have been agreed upon Distort 3-D world into 2-D abstraction (projection: distorts scale, direction, area, shape) Convert real-world features into symbolic objects e.g. city to circle Maps can portray abstractions (e.g., gradients, contours) as distinct spatial objects


3 The limits to mapping Measurement errors e.g. sampling, missing data Methodological errors e.g. conflation Symbology errors Map use and interpretation errors Misuse, misinterpretation and belief

4 Attribute uncertainty
5 What is Uncertainty? NIST data quality: lineage positional accuracy attribute accuracy completeness logical consistency Also: source scale methodology Reliability trust and confidence

6 Example 3 reports, two say a bridge exists one says it is destroyed Report 3 introduces uncertainty Bridge is certain, >0.5 Trust? Reliability of sources Method in OSM

7 Lineage
8 Positional accuracy e.g. NMAS 1. Horizontal accuracy. For maps on publication scales larger than 1:20,000, not more than 10 percent of the points tested shall be in error by more than 1/30 inch, measured on the publication scale; for maps on publication scales of 1:20,000 or smaller, 1/50 inch. These limits of accuracy shall apply in all cases to positions of well-defined points only. Well-defined points are those that are easily visible or recoverable on the ground, such as the following: monuments or markers, such as bench marks, property boundary monuments; intersections of roads, railroads, etc.; corners of large buildings or structures (or center points of small buildings); etc. In general what is well defined will be determined by what is plotable on the scale of the map within 1/100 inch. 2. Vertical accuracy, as applied to contour maps on all publication scales, shall be such that not more than 10 percent of the elevations tested shall be in error more than one-half the contour interval. In checking elevations taken from the map, the apparent vertical error may be decreased by assuming a horizontal displacement within the permissible horizontal error for a map of that scale. 3. The accuracy of any map may be tested by comparing the positions of points whose locations or elevations are shown upon it with corresponding positions as determined by surveys of a higher accuracy. Tests shall be made by the producing agency, which shall also determine which of its maps are to be tested, and the extent of the testing. 4. Published maps meeting these accuracy requirements shall note this fact on their legends, as follows: This map complies with National Map accuracy Standards. 5. Published maps whose errors exceed those aforestated shall omit from their legends all mention of standard accuracy. 6. When a published map is a considerable enlargement of a map drawing (manuscript) or of a published map, that fact shall be stated in the legend. For example, This map is an enlargement of a 1:20,000-scale map drawing, or This map is an enlargement of a 1:24,000-scale published map. 7. To facilitate ready interchange and use of basic information for map construction among all Federal mapmaking agencies, manuscript maps and published maps, wherever economically feasible and consistent with the uses to which the map is to be put, shall conform to latitude and longitude boundaries, being 15 minutes of latitude and longitude, or 7.5 minutes, or 3-3/4 minutes in size. Issued June 10, 194l U.S. BUREAU OF THE BUDGET Revised April 26, 1943 Revised June 17, 1947


9 Attribute accuracy/definition and scale

10 Temporal and differential completeness


11 Logical completeness


12 Nick Chrisman s View ( )

13 Source: Longley et al.


14 Tile/Merge Source: Longley et al.

15 Spot the tiles

16 Scale-induced, temporal error


17
18 Generalization uncertainty Measurements not perfectly accurate Maps distorted when generalized Selection Simplification Combination Displacement Objects at scale can be far less than 0.1mm Definitions vague, ambiguous, subjective Landscape has changed over time

19 Classification inconsistency

20 Classification purpose
21 Dealing with uncertainty Simple quantification Showing missing data Conflation Symbolizing uncertainty

22 Map showing the discoveries of Abel Tasman in and The map includes the track of Tasman s first voyage from Mauritius. It was included in Vol. 3, part 2 of his Francois Valentijn s history, Oud en nieuw Oost-Indien (Old and new East Indies).

23 A Cartographic Trap

24

25 Quantification Horizontal and vertical RMSE Recognized by GPS as DOP Categorical: by Confusion matrix, User/Producer, Kappa, ROC


26 Missing data Age-adjusted suicide rates per 100,000

27 Rubber sheeting

28 Temporal conflation

29

30 Conflation


31 Interpolation method uncertainty Top: IDW Bottom: Spline
32 Fuzzy attributes and positions Positions assumed accurate But really, just best guess Best Available Data Differentiate best guesses from truth Shadow map of certainty where an estimate is likely to be the most accurate Tracking error propagation


33 Source diagram: NOAA Chart (Kotzebue, AK)

34 Fuzzy overlay
35 More Strategies Simulation Complex models Describing uncertainty as a spatially autoregressive model with parameter rho not helpful How to get message across Many models out there Research on modeling uncertainty (NCGIA Initiative 1) Users can t understand them all Given choice, most users do not want uncertainty information
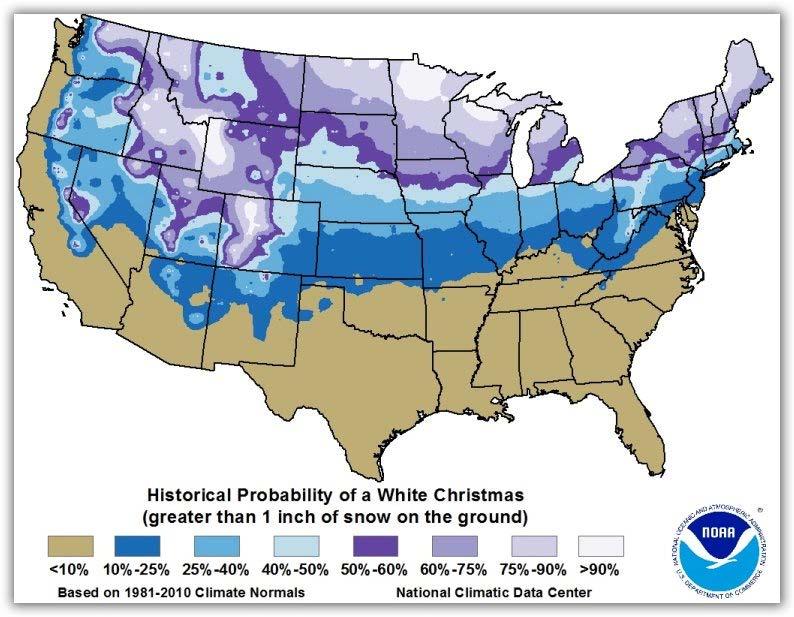

36 Probabilities


37 Outliers SRTM elevation errors of over 100m vertical
38 Options for dealing with map uncertainty 1. Ignore the issue completely 2. Describe uncertainty with measures (shadow map or RMSE) 3. Simulate equally probable versions of data 4. Be uncertainty-aware (trust, but verify)

")


39 Monte Carlo Simulation Change Uncertainty (%)


40 A Review of Uncertainty in Data Visualization Ken Brodlie, Rodolfo Allendes Osorio and Adriano Lopes

41 Kriging uncertainty in R Figure: Visualisation of uncertainty for a quantitative variable (topsoil thickness in cm) interpolated using regression kriging: uncertainty included with whiteness and the accompanying two-dimensional legend.


42 Visualizing Uncertainty
43 Summary All data are uncertain Uncertainty types include lineage, positional accuracy, attribute accuracy, completeness and logical consistency Error due to scale, method, interpretation, source, bias Methods for dealing with error include ignoring it, quantification, simulation Few methods explore integrating error and uncertainty directly People have a hard time dealing with probabilities, let alone expected error information
Accuracy and Uncertainty
 Accuracy and Uncertainty Accuracy and Uncertainty Why is this an issue? What is meant by accuracy and uncertainty (data vs rule)? How things have changed in a digital world. Spatial data quality issues
Watershed Sciences 4930 & 6920 GEOGRAPHIC INFORMATION SYSTEMS
 Watershed Sciences 4930 & 6920 GEOGRAPHIC INFORMATION SYSTEMS WEEK TWELVE UNCERTAINTY IN GIS Joe Wheaton HOUSEKEEPING Labs Do you need extended Quinney Lab hours? Okay with Lab 9? Geoprocessing worked?
Overview. GIS Data Output Methods
 Overview GIS Output Formats ENV208/ENV508 Applied GIS Week 2: Making maps, data visualisation, and GIS output GIS Output Map Making Types of Maps Key Elements Table Graph Statistics Maps Map Making Maps
ENV208/ENV508 Applied GIS. Week 2: Making maps, data visualisation, and GIS output
 ENV208/ENV508 Applied GIS Week 2: Making maps, data visualisation, and GIS output Overview GIS Output Map Making Types of Maps Key Elements GIS Output Formats Table Graph Statistics Maps Map Making Maps
Different types of maps and how to read them.
 Different types of maps and how to read them. A map is a picture or representation of the Earth's surface, showing how things are related to each other by distance, direction, and size. Maps have been
Geovisualization of Attribute Uncertainty
 Geovisualization of Attribute Uncertainty Hyeongmo Koo 1, Yongwan Chun 2, Daniel A. Griffith 3 University of Texas at Dallas, 800 W. Campbell Road, Richardson, Texas 75080, 1 Email: hxk134230@utdallas.edu
Types of spatial data. The Nature of Geographic Data. Types of spatial data. Spatial Autocorrelation. Continuous spatial data: geostatistics
 The Nature of Geographic Data Types of spatial data Continuous spatial data: geostatistics Samples may be taken at intervals, but the spatial process is continuous e.g. soil quality Discrete data Irregular:
Chapter 1 Overview of Maps
 Chapter 1 Overview of Maps In this chapter you will learn about: Key points when working with maps General types of maps Incident specific maps Map legend and symbols Map sources A map is a navigational
HORIZONTAL PROJECTION PARAMETERS: DANE COUNTY COORDINATES
 Recommended RTK GPS Configuration Parameters for the City of Madison, WI Base Station Compiled by: Dan Rodman RLS, City of Madison (608)266-6674 drodman@cityofmadison.com For base station information see
Quality and Coverage of Data Sources
 Quality and Coverage of Data Sources Objectives Selecting an appropriate source for each item of information to be stored in the GIS database is very important for GIS Data Capture. Selection of quality
Reasoning with Uncertainty
 Reasoning with Uncertainty Representing Uncertainty Manfred Huber 2005 1 Reasoning with Uncertainty The goal of reasoning is usually to: Determine the state of the world Determine what actions to take
Chapter 02 Maps. Multiple Choice Questions
 Chapter 02 Maps Multiple Choice Questions 1. Every projection has some degree of distortion because A. a curved surface cannot be represented on a flat surface without distortion. B. parallels and meridians
Software. People. Data. Network. What is GIS? Procedures. Hardware. Chapter 1
 People Software Data Network Procedures Hardware What is GIS? Chapter 1 Why use GIS? Mapping Measuring Monitoring Modeling Managing Five Ms of Applied GIS Chapter 2 Geography matters Quantitative analyses
Geog183: Cartographic Design and Geovisualization Spring Quarter 2018 Lecture 11: Dasymetric and isarithmic mapping
 Geog183: Cartographic Design and Geovisualization Spring Quarter 2018 Lecture 11: Dasymetric and isarithmic mapping Discrete vs. continuous revisited Choropleth suited to discrete areal, but suffers from
B. Topographic maps are also called. contour maps
 Topographic Maps Introduction A. Topographic maps are essential tools in geologic and engineering studies because they show the configuration of Earth's surface in remarkable detail and permit one to measure
Studying Geography: Tools of the Trade
 GEOG 101 TUTORING AVAILABLE Free tutoring is available to all GEOG 101 students by experienced teachers. No appointment is necessary. Walk in/walk out sessions. Bring your notes, textbook, handouts, and
An Information Model for Maps: Towards Cartographic Production from GIS Databases
 An Information Model for s: Towards Cartographic Production from GIS Databases Aileen Buckley, Ph.D. and Charlie Frye Senior Cartographic Researchers, ESRI Barbara Buttenfield, Ph.D. Professor, University
Introduction to GIS I
 Introduction to GIS Introduction How to answer geographical questions such as follows: What is the population of a particular city? What are the characteristics of the soils in a particular land parcel?
Maps: Geography s Basic Tools
 Maps: Geography s Basic Tools What is a map? - A map is a representation of the earth s features drawn on a flat surface. - Maps use points, lines, colours, and symbols to represent the features of an
What is a map? A Map is a two or three-dimensional model or representation of the Earth s surface. 2-Dimensional map
 What is a map? A Map is a two or three-dimensional model or representation of the Earth s surface. 2-Dimensional map What is a Map Projection? Planar Projection Projection A Projection is a mathematical
Why Is It There? Attribute Data Describe with statistics Analyze with hypothesis testing Spatial Data Describe with maps Analyze with spatial analysis
 6 Why Is It There? Why Is It There? Getting Started with Geographic Information Systems Chapter 6 6.1 Describing Attributes 6.2 Statistical Analysis 6.3 Spatial Description 6.4 Spatial Analysis 6.5 Searching
Test Bank Chapter 2: Representations of Earth
 Multiple Choice Test Bank Chapter 2: Representations of Earth 1. A rhumb line on a Mercator projection is a line of. a. true size b. true shape c. true compass bearing d. true location 2. Maximum longitude
Using Maps. Using Maps. Using Maps. Using Maps
 A is a visual representation, or model, of part or all of the earth. lines are imaginary lines that run east to west around the globe; they are also known as parallels. They show distances in degrees north
Using Map and Compass Together
 Using Map and Compass Together In situations where you foresee a potential evacuation on foot, where there are no roads, and no indication as to the direction of travel (i.e., road signs), it is recommended
Lecture 9: Reference Maps & Aerial Photography
 Lecture 9: Reference Maps & Aerial Photography I. Overview of Reference and Topographic Maps There are two basic types of maps? Reference Maps - General purpose maps & Thematic Maps - maps made for a specific
LESSON 2: INTRODUCTION TO TOPOGRAPHICAL MAPS
 LESSON 2: INTRODUCTION TO TOPOGRAPHICAL MAPS Finding your way if you become separated from a group. PURPOSE This lesson presents an overview of topographic maps. It describes their characteristics and
Propagation of Errors in Spatial Analysis
 Stephen F. Austin State University SFA ScholarWorks Faculty Presentations Spatial Science 2001 Propagation of Errors in Spatial Analysis Peter P. Siska I-Kuai Hung Arthur Temple College of Forestry and
9/7/ Studying Geography: Introduction to Mapping. Cartographic Terms. Cartographic Terms. Geographers Tools. Geographers Needs.
 Geographers Tools Studying Geography: Introduction to Mapping Prof. Anthony Grande Hunter College Geography Lecture design, content and presentation AFG0918. Individual images and illustrations may be
Geog 469 GIS Workshop. Data Analysis
 Geog 469 GIS Workshop Data Analysis Outline 1. What kinds of need-to-know questions can be addressed using GIS data analysis? 2. What is a typology of GIS operations? 3. What kinds of operations are useful
Class Notes: Mapping the Earth
 Name: Date: Period: Mapping the Earth The Physical Setting: Earth Science Class Notes: Mapping the Earth I. Latitude and Longitude Map -! Latitude -! Also called These lines intersect Equator -! The North
New Intensity-Frequency- Duration (IFD) Design Rainfalls Estimates
 Design Rainfalls Estimates") New Intensity-Frequency- Duration (IFD) Design Rainfalls Estimates Janice Green Bureau of Meteorology 17 April 2013 Current IFDs AR&R87 Current IFDs AR&R87 Current IFDs - AR&R87 Options for estimating
New Intensity-Frequency- Duration (IFD) Design Rainfalls Estimates Janice Green Bureau of Meteorology 17 April 2013 Current IFDs AR&R87 Current IFDs AR&R87 Current IFDs - AR&R87 Options for estimating
Road Scholar. Williamette Valley Invitational Practice Tournament
 Road Scholar Williamette Valley Invitational Practice Tournament Rules for this Event As you complete this event, enter your answers on the online data sheet. You may click "submit" when done and quietly
NAME DATE TOPOGRAPHIC MAPS. Activity 1: Topographic Map Investigation I: More Than a Road Map
 NAME DATE PARTNER(S) TOPOGRAPHIC MAPS Now you have seen how topographic maps can be generated to present the elevation of a terrain. Let s look at some topographic maps and learn how to interpret them.
Mapping Our World Chapter 2
 Mapping Our World Chapter 2 Section 2.1: Latitude and Longitude Maps are flat models of threedimensional objects. For thousands of years people have used maps to define borders and to find places. With
Basic principles of cartographic design. Makram Murad-al-shaikh M.S. Cartography Esri education delivery team
 Basic principles of cartographic design Makram Murad-al-shaikh M.S. Cartography Esri education delivery team Cartographic concepts Cartography defined The communication channel - Why maps fail Objectives
Earth Science: Chapter 2 Assessment
 Earth Science: Chapter 2 Assessment Do not write on this text booklet. Write the letter of the correct answer on your answer sheet. SECTION 1: Multiple Choice (50 points) Choose the letter of the BEST
Overview key concepts and terms (based on the textbook Chang 2006 and the practical manual)
") Introduction Geo-information Science (GRS-10306) Overview key concepts and terms (based on the textbook 2006 and the practical manual) Introduction Chapter 1 Geographic information system (GIS) Geographically
Introduction Geo-information Science (GRS-10306) Overview key concepts and terms (based on the textbook 2006 and the practical manual) Introduction Chapter 1 Geographic information system (GIS) Geographically
CHAPTER 9 DATA DISPLAY AND CARTOGRAPHY
 CHAPTER 9 DATA DISPLAY AND CARTOGRAPHY 9.1 Cartographic Representation 9.1.1 Spatial Features and Map Symbols 9.1.2 Use of Color 9.1.3 Data Classification 9.1.4 Generalization Box 9.1 Representations 9.2
Where, on Earth, are you?
 Where, on Earth, are you? We all live on a big planet called Earth, of course. But where on Earth? And if you want to go to a different spot on Earth other than the spot you are in, how do you know which
What Do You See? FOR 274: Forest Measurements and Inventory. Area Determination: Frequency and Cover
 What Do You See? Message of the Day: Many options exist to determine the size, area, or extent of a feature on a landscape FOR 274: Forest Measurements and Inventory Lecture 7: Measures of Land Area Frequency
Topographic Maps and Landforms Geology Lab
 Topographic Maps and Landforms Geology Lab Ray Rector: Instructor Today s Lab Activities 1) Discussion of Last Week s Lab 2) Lecture on Topo Maps and Elevation Contours 3) Construct Topographic Maps and
Physical Geography Lab Activity #15
 Physical Geography Lab Activity #15 Due date Name Choropleth Maps COR Objective 1 & 7, SLOs 1 & 3 15.1. Introduction Up until this point we have used maps to find locations on the Earth. While they are
Latitude and Longitude Pre Test
 Name Date Latitude and Longitude Pre Test Multiple Choice Directions: For questions, 1 10 circle the answer that letter that best answers the question. Each question is worth 1 point each. 1. To locate
Use your text to define the following term. Use the terms to label the figure below. Define the following term.
 Mapping Our World Section. and Longitude Skim Section of your text. Write three questions that come to mind from reading the headings and the illustration captions.. Responses may include questions about
CHAPTER EXIT CHAPTER. Models of Earth. 3.1 Modeling the Planet. 3.2 Mapmaking and Technology. 3.3 Topographic Maps CHAPTER OUTLINE
 EXIT CHAPTER.1 Modeling the Planet.2 Mapmaking and Technology. Topographic Maps CHAPTER OUTLINE CHAPTER.1 Modeling the Planet A flat of Earth is a convenient tool, but it can distort the shape, distance,
Lecture 5. G. Cowan Lectures on Statistical Data Analysis Lecture 5 page 1
 Lecture 5 1 Probability (90 min.) Definition, Bayes theorem, probability densities and their properties, catalogue of pdfs, Monte Carlo 2 Statistical tests (90 min.) general concepts, test statistics,
Compass Basics. Quick Map Basics Review For Compass Use
 Compass Basics Quick Map Basics Review For Compass Use A topographic map tells you where things are and how to get to them, whether you're hiking, biking, hunting, fishing, or just interested in the world
PROJECTIONS AND COORDINATES EXPLORED THROUGH GOOGLE EARTH EXERCISE (SOLUTION SHEET)
") PROJECTIONS AND COORDINATES EXPLORED THROUGH GOOGLE EARTH EXERCISE (SOLUTION SHEET) Name: Date: Period: Note: Correct answers on some problems are indicated with a yellow highlight. PROJECTIONS 1. Here
PROJECTIONS AND COORDINATES EXPLORED THROUGH GOOGLE EARTH EXERCISE (SOLUTION SHEET) Name: Date: Period: Note: Correct answers on some problems are indicated with a yellow highlight. PROJECTIONS 1. Here
Supplementary material: Methodological annex
 1 Supplementary material: Methodological annex Correcting the spatial representation bias: the grid sample approach Our land-use time series used non-ideal data sources, which differed in spatial and thematic
Version 1.1 GIS Syllabus
 GEOGRAPHIC INFORMATION SYSTEMS CERTIFICATION Version 1.1 GIS Syllabus Endorsed 1 Version 1 January 2007 GIS Certification Programme 1. Target The GIS certification is aimed at: Those who wish to demonstrate
BUILDING AN ACCURATE GIS
 BUILDING AN ACCURATE GIS 2006 GIS in the Rockies Denver, Colorado September 13, 2006 William E. Linzey United States Department of Commerce National Oceanic and Atmospheric Administration National Geodetic
APPENDIX A GLOSSARY. Appendix A.1
 APPENDIX A GLOSSARY Appendix A.1 Appendix A.2 Back Bearing A back bearing is measured from the object to your position. It is the exact opposite of a direct bearing. Base Line An imaginary line on the
Aileen Buckley, Ph.D. and Charlie Frye
 An Information Model for Maps: Towards Production from GIS Databases Aileen Buckley, Ph.D. and Charlie Frye Researchers, ESRI GIS vs. cart GIS Outline of the presentation Introduction Differences between
Guidance to Instructors on Subject Delivery MAP READING. This is a suggested programme for the delivery of this subject.
 Programme of learning: Guidance to Instructors on Subject Delivery This is a suggested programme for the delivery of this subject. The main headings are the Learning Outcomes (LO1, LO2, etc), with sub
Unit 1, Lesson 3 What Tools and Technologies Do Geographers Use?
 Unit 1, Lesson 3 What Tools and Technologies Do Geographers Use? Geographers use a variety of tools and technologies in investigating geographic questions. Maps and globes both represent the earth, but
A map is a small-scale flat-surface representation of some portion of the earth s surface.
 MAPS AND CHARTS A map is a small-scale flat-surface representation of some portion of the earth s surface. A representation that is designed for plotting navigational information is called a chart. Often
Approaching quantitative accuracy in early Dutch city maps
 Approaching quantitative accuracy in early Dutch city maps Introduction Jakeline Benavides and John Nerbonne Alfa-informatica, University of Groningen j.benavides@rug.nl, j.nerbonne@rug.nl We are motivated
Map Skills and Geographic Tools
 Name: Period: Map Skills and Geographic Tools TEKS: 8.9C interpret topographic maps and satellite views to identify land and erosional features and predict how these features may be reshaped by weathering
Chapter 2: Studying Geography, Economics, and Citizenship
 Chapter 2: Studying Geography, Economics, and Citizenship Lesson 2.1 Studying Geography I. Displaying the Earth s Surface A. A globe of the Earth best shows the sizes of continents and the shapes of landmasses
Wayne E. Sirmon GEO 301 World Regional Geography
 Wayne E. Sirmon GEO 301 Geography 301 Geography 301 MAP: A graphic representation of a portion of the earth s surface dawn to scale, as seen from above. Types of Maps Climate maps give general information
4 Studying Geography:
 4 Studying Geography: Introduction to Mapping Prof. Anthony Grande Hunter College Geography Lecture design, content and presentation AFG0119 Individual images and illustrations may be subject to prior
Unit 1, Lesson 2. What is geographic inquiry?
 What is geographic inquiry? Unit 1, Lesson 2 Understanding the way in which social scientists investigate problems will help you conduct your own investigations about problems or issues facing your community
Quality Elements and Measures of Relief and Aesthetics on Croatian Topographic Map TK25
 DRŽAVNA GEODETSKA UPRAVA Gruška 20 / 10 000 Zagreb Quality Elements and Measures of Relief and Aesthetics on Croatian Topographic Map TK25 Branko Puceković Quality Elements and Measures of Relief and Aesthetics
Metadata for 2005 Orthophotography Products
 Metadata for 2005 Orthophotography Products What does this data set describe? 1. How should this data set be cited? 2. What geographic area does the data set cover? 3. What does it look like? 4. Does the
Industrial Technology: Intro to Industrial Technology Crosswalk to AZ Math Standards
 East Valley Page 1 of 1 August 1998 3M-P6 Perform mathematical operations on expressions and matrices, and solve equations and inequalities. PO 4 PO 5 PO 6 PO 7 PO 8 PO 9 PO 10 5.0 Demonstrate the elements
Geography 128 Winter Quarter Lecture 5: What is Analytical Cartography?
 Geography 128 Winter Quarter 2017 Lecture 5: What is Analytical Cartography? What is Cartography? Cartography - the science, technology and art of making maps. Matthew Hampton, 2007, A Mosaic of Space,
Introduction to Cartography GEOG 2016 E. Lecture-2 Geodesy and Projections
 Introduction to Cartography GEOG 2016 E Lecture-2 Geodesy and Projections What is Geodesy? The science of geodesy determines: Earth s shape and Interrelation of different points on earth s surface The
MAPPING THE EARTH HOW DO YOU FIND A LOCATION ON THE EARTH?
 MAPPING THE EARTH HOW DO YOU FIND A LOCATION ON THE EARTH? UNIT TOPICS TOPIC 1: LATITUDE & LONGITUDE TOPIC 2: FIELD MAPS TOPIC 3: TOPOGRAPHIC MAPS TOPIC 4: NYS LANDSCAPES TOPIC 1: LATITUDE & LONGITUDE
How to Lie with Maps. Author: Mark Monmonier
 How to Lie with Maps Author: Mark Monmonier Maps are not infallible. "The image on a map is drawn by human hands, controlled by operations in a human mind. John Kirkland Wright in 1942. An Example- What
Military Map Reading 201
 Military Map Reading 201 This information paper is designed to resolve the confusion between the Universal Transverse Mercator (UTM) and the Military Grid Reference System (MGRS) coordinates. The two systems
Map reading made easy
 Map reading made easy 1. What is a map? A map is simply a drawing or picture (in 2-D) of a landscape or area of a country (in 3-D). It could be anything from a sketch map for a visitor to find your school
ALGEBRAIC PRINCIPLES
 ALGEBRAIC PRINCIPLES Numbers and Operations Standard: 1 Understands and applies concepts of numbers and operations Power 1: Understands numbers, ways of representing numbers, relationships among numbers,
Cartography and Geovisualization. Chapters 12 and 13 of your textbook
 Cartography and Geovisualization Chapters 12 and 13 of your textbook Why cartography? Maps are the principle means of displaying spatial data Exploration: visualization, leading to conceptualization of
Map Skills Unit. Note taking unit
 Map Skills Unit Note taking unit Introduction To learn about the Earth, we are going to learn about two geographic tools you can use.globes and maps. Globe A globe is a round model of the planet Earth
Map reading made easy
 Map reading made easy Maps can be great fun and they can lead you to all sorts of discoveries. They can help you get to know an area really well, because they pinpoint interesting places that are often
Measurements and Data Analysis
 Measurements and Data Analysis 1 Introduction The central point in experimental physical science is the measurement of physical quantities. Experience has shown that all measurements, no matter how carefully
Topographic Maps and Profiles
 Name: Date: Period: Earth Science Foundations The Physical Setting: Earth Science CLASS NOTES! Topographic Maps [contour maps] -! Topographic maps show three-dimensional shapes in two dimensions Elevation
The Sundial Primer - "Dialling Guides" Double Gnomon Polar Sundial
 1 Double Polar Sundial he purpose of the "Dialling Guides" is to provide an easy method for laying out the hour lines for a number of double gnomon polar sundials located at any latitude in either the
Introduction to Geography
 Introduction to Geography What is geography? Geography comes from the Greek word Geographia. Geo means earth and graphia means to describe or chart. Geographers study the earth in relation to space and
Cartography the art of making maps
 Cartography the art of making maps A map is a drawing or a picture of the earths surface, showing how things are related to each other by distance, direction and size. Maps are used for: Navigation Distance
Chapter 3 Models of the Earth. 3.1 Finding Locations on the Earth. 3.1 Objectives
 Chapter 3 Models of the Earth 3.1 Finding Locations on the Earth 3.1 Objectives Explain latitude and longitude. How can latitude and longitude be used to find locations on Earth? How can a magnetic compass
FlexiCadastre User Conference 2013 GIS Data Verification & Challenges
 FlexiCadastre User Conference 2013 GIS Data Verification & Challenges May 7, 2013 Amanda Blackmore GIS Specialist OVERVIEW GIS Definitions & Terminology Spatial Data Common Issues or Concerns Data Verification
Mapping Earth. How are Earth s surface features measured and modeled?
 Name Mapping Earth How are Earth s surface features measured and modeled? Before You Read Before you read the chapter, think about what you know about maps Record your thoughts in the first column Pair
Probabilistic assessment of danger zones using a surrogate model of CFD simulations
 HARMO 17 17 th International Conference on Harmonisation within Atmospheric Dispersion Modelling for Regulatory Purposes Probabilistic assessment of danger zones using a surrogate model of CFD simulations
Introducing GIS analysis
 1 Introducing GIS analysis GIS analysis lets you see patterns and relationships in your geographic data. The results of your analysis will give you insight into a place, help you focus your actions, or
Integrating LiDAR data into the workflow of cartographic representation.
 Integrating LiDAR data into the workflow of cartographic representation. Cartographic Workflow I. 1 2 3 4 5 Surveying Vector (Nat. GDB) GPS, Laser Range Finder Yes/ No Scanning old maps LiDARflights Capture
Homework - Topographic Maps and What They Mean - Standard Earth Science
 Name: Mr. Schwartz Earth Science Period: Date: /10 Homework - Topographic Maps and What They Mean - Standard Earth Science Read pages 46-47 and 53-56 in your text. Then, answer the questions. Don t forget
Geography Can Be Cool. Seriously
 Geography Can Be Cool Seriously Why does geography matter? Geography: the study of looking at every aspect of the Earth s systems, such as human economies, societies, cultures, plants, animals, & climate.
ENGRG Introduction to GIS
 ENGRG 59910 Introduction to GIS Michael Piasecki October 13, 2017 Lecture 06: Spatial Analysis Outline Today Concepts What is spatial interpolation Why is necessary Sample of interpolation (size and pattern)
SURVEYING AND MAPPING, INC. COORDINATE DATA SHEET JOB: CITY OF DECATUR CLIENT: CITY OF DECATUR SAM JOB#:
 13 March 2001 SURVEYING AND MAPPING, INC. COORDINATE DATA SHEET JOB: CITY OF DECATUR CLIENT: CITY OF DECATUR SAM JOB#: 21038-20 HORIZONTAL DATUM: NAD-83 GEODETIC VERTICAL STATION ID LATITUDE LONGITUDE
8 th 12 th Designing a Monitoring Plan Mapping & Analysis (Activities 1 2)
") 8 th 12 th Designing a Monitoring Plan Mapping & Analysis (Activities 1 2) Objectives for All Activities - To be able to define and describe the purpose and uses of topographic maps. - To define rules
8 th 12 th Designing a Monitoring Plan Mapping & Analysis (Activities 1 2) Objectives for All Activities - To be able to define and describe the purpose and uses of topographic maps. - To define rules
Measuring Keepers S E S S I O N 1. 5 A
 S E S S I O N 1. 5 A Measuring Keepers Math Focus Points Naming, notating, and telling time to the hour on a digital and an analog clock Understanding the meaning of at least in the context of linear measurement
Scott A. True Project Scientist Geodesy & Geophysics Division Basic and Applied Research Office InnoVision Directorate
 EGM96 Variable Resolution Geoid Implementation Error in GEOTRANS 2.3 Scott A. True Project Scientist Geodesy & Geophysics Division Basic and Applied Research Office InnoVision Directorate Introduction
Lecture 5. Symbolization and Classification MAP DESIGN: PART I. A picture is worth a thousand words
 Lecture 5 MAP DESIGN: PART I Symbolization and Classification A picture is worth a thousand words Outline Symbolization Types of Maps Classifying Features Visualization Considerations Symbolization Symbolization
Terms GIS GPS Vector Data Model Raster Data Model Feature Attribute Table Point Line Polygon Pixel RGB Overlay Function
 FINAL REVIEW FOR GIS (2016) PRACTICAL COMPONENT The first 40 mins of the exam will be open book and will require you to make a map using all the techniques learned over the semester. This map will be e-mailed
Spatial locations. Spatial locations. Spatial locations. Spatial locations
 Where am I? sounds simple, but definitely not huge amount of picky detail Cartographers make a career from the details focus on the minimum you need to know c Philip M. Dixon (Iowa State Univ.) Spatial
Lab 11. Optical Instruments
 Lab 11. Optical Instruments Goals To construct a simple telescope with two positive lenses having known focal lengths, and to determine the angular magnification (analogous to the magnifying power of a
STUDYING THE EFFECT OF DISTORTION IN BASIC MAP ELEMENTS FOR THE DEGREE OF SPATIAL ACCURACY OF GAZA STRIP MAPS
 STUDYING THE EFFECT OF DISTORTION IN BASIC MAP ELEMENTS FOR THE DEGREE OF SPATIAL ACCURACY OF GAZA STRIP MAPS Maher A. El-Hallaq Assistant professor, Civil Engineering Department, IUG,, mhallaq@iugaza.edu.ps
IE 316 Exam 1 Fall 2011
 IE 316 Exam 1 Fall 2011 I have neither given nor received unauthorized assistance on this exam. Name Signed Date Name Printed 1 1. Suppose the actual diameters x in a batch of steel cylinders are normally
Land Navigation Table of Contents
 Land Navigation Table of Contents Preparatory Notes to Instructor... 1 Session Notes... 5 Learning Activity: Grid Reference Four Figure... 7 Learning Activity: Grid Reference Six Figure... 8 Learning Activity: