8 th 12 th Designing a Monitoring Plan Mapping & Analysis (Activities 1 2)
|
|
|
- Prudence Alexander
- 6 years ago
- Views:
Transcription
1 8 th 12 th Designing a Monitoring Plan Mapping & Analysis (Activities 1 2) Objectives for All Activities - To be able to define and describe the purpose and uses of topographic maps. - To define rules of interpreting topographic maps and the symbols used for features. - To comprehend calculations for determining latitude and longitude of a location on a topographic map. - To identify important features on topographic maps. - To determine primary land uses in watershed. - To identify potential hazards to water quality in the watershed. - To establish goals for monitoring the water quality at a given site. Materials Activity As many different 1:24,000, 7 ½ Minute Series topographic maps as your can locate. You may obtain topographic maps from several different sources. + The Texas Natural Resources Information System in Austin, Texas offers topographic maps for education. The only cost is shipping, which is $5 per tube of 25 maps. To order, visit them on the web at or call at The United States Geological Survey, USGS, provides information for ordering maps and for finding other map suppliers. Their web site is + The local public library may have topographic maps on file. + Private mapping companies also have topographic maps. The USGS web site gives a list of these companies. - Several topographic map legends, found on the web at or Topographic Map of Local Area per group - Cardboard - Plastic Sheets (or several overheads) per group - Dry Erase Markers - Thumb Tacks Alternative setup for maps - If unable to obtain topographic maps, students may use copies of topographic maps or maps printed from the web, as long as students are allowed to write on the maps.
2 Background Many environmental and human factors exist that influence measurements of the water quality parameters of depth, temperature, ph, conductivity, and dissolved oxygen. Important factors to consider include: 1) size of watershed 2) topography, or land features 3) stream location 4) cultural features, such as buildings, roads, pipelines, etc. 5) the number and size of towns, and 6) the types of land use within the watershed. TOPOGRAPHIC MAPS Topographic maps provide one method of analyzing factors that influence water quality parameters and of mapping a watershed. Topographic maps, a type of contour map, project a flat, 2-D representation of the shape of earth s surface. These maps also identify other important physical and cultural features, such as vegetation, streams, lakes, caves, towns, buildings, roads, pipelines, and bridges. Topographic maps serve many purposes for a diversity of professionals including, city planners, urban developers, hydrologists, flood plain managers, hazards researchers, and physical geographers to name a few. In their jobs, topographic maps are used to identify areas for potential growth, assess future problems related to growth issues, determine threats to the local environment, locate boundaries of flood plains, find areas prone to damage from disasters, and study the physical landscape. Latitude and Longitude Latitude and longitude is one of the coordinate systems represented on topographic maps. Latitude lines measure north and south and run east and west. Longitude lines measure east and west and run north and south. When writing and reading latitude and longitude, latitude always comes first. Each corner of the topographic map displays the latitude and longitude of that corner. These are the boundaries of the topographic map. Latitude and longitude readings in between these corners, or boundaries, are shown on the side of the map. Latitude readings can be found on the vertical axes of the map, while longitude readings are on the horizontal axes of the map. On topographic maps, latitude and longitude are given in degrees, minutes, and seconds. These units measure distance. One degree consists of 60 minutes and one minute consists of 60 seconds. The symbol for minutes is one apostrophe and seconds is two apostrophes. For example, a location at N, W is at 29 degrees, 52 minutes, and 30 seconds north latitude and 97 degrees, 45 minutes, and zero seconds west longitude. Classifying Topographic Maps One way of classifying topographic maps is by the scale of the map. The scale is a ratio between distance on the map and distance on the earth s surface. For example,
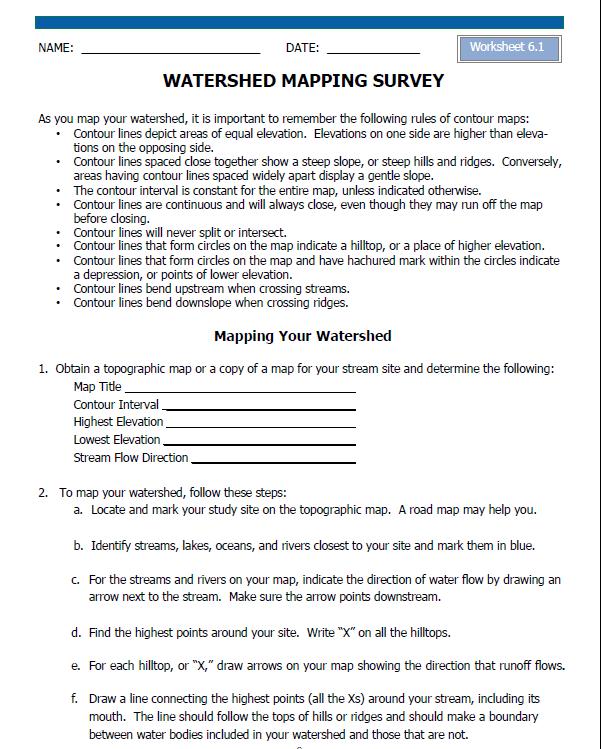
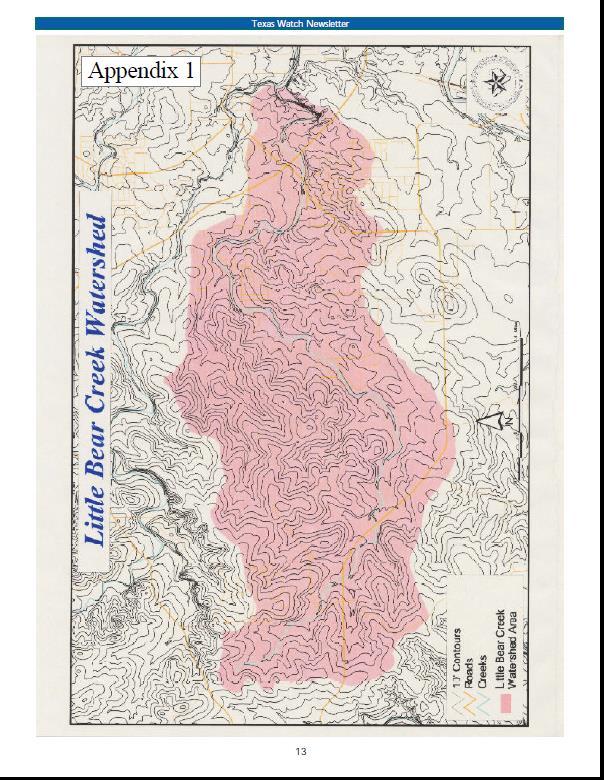
3 one of the most common types of topographic maps is the 7 ½ minute quadrangle. This map depicts an area of 7 ½ minutes latitude and 7 ½ minutes longitude, thus making it the 7 ½ Minute Series. For this map, the scale is usually 1:24,000. This means that one inch on the map equals 24,000 inches on the earth s surface, and one foot on the map represents 24,000 feet of the earth s surface. Topographic maps also come in scales of 1:100,000 and 1:250,000. This lesson requires the 1:24,000, 7 ½ Minute Series topographic maps. Activity 1: Introduction to Topographic Maps 1. Gather materials. 2. In a class discussion, generate a definition for topographic maps and make a list of people in society who might use them. Write the list on the board or overhead. As students provide names of professions that use topographic maps, have them describe how these professionals use the maps. Activity 2: Mapping Your Watershed 1. Gather materials. 2. To mount plastic over the topographic map: a) Place the topographic map on the cardboard. b) Place sheet of plastic on top of topographic map. c) Tape plastic and map to cardboard. (May also use thumbtacks to fasten plastic and map to cardboard). *Topographic maps may be laminated instead of covering them with plastic 3. Divide students into groups of two or three for Mapping Your Watershed Activity. 4. Distribute Watershed Mapping Survey worksheet (6.1) for students to complete. The end result should resemble the mapped watershed of the topographic map in Appendix 1.
4 8 th 12 th Designing a Monitoring Plan Mapping & Analysis (Activities 3 and 4) Objectives for All Activities - To be able to define and describe the purpose and uses of topographic maps. - To define rules of interpreting topographic maps and the symbols used for features. - To comprehend calculations for determining latitude and longitude of a location on a topographic map. - To identify important features on topographic maps. - To determine primary land uses in watershed. - To identify potential hazards to water quality in the watershed. - To establish goals for monitoring the water quality at a given site. Materials Activity Rulers (with centimeters) - Calculators for each group - Local Area Topographic Maps with Marked Watersheds from Activity 2 Background Many environmental and human factors exist that influence measurements of the water quality parameters of depth, temperature, ph, conductivity, and dissolved oxygen. Important factors to consider include: 1) size of watershed 2) topography, or land features 3) stream location 4) cultural features, such as buildings, roads, pipelines, etc. 5) the number and size of towns, and 6) the types of land use within the watershed. TOPOGRAPHIC MAPS Topographic maps provide one method of analyzing factors that influence water quality parameters and of mapping a watershed. Topographic maps, a type of contour map, project a flat, 2-D representation of the shape of earth s surface. These maps also identify other important physical and cultural features, such as vegetation, streams, lakes, caves, towns, buildings, roads, pipelines, and bridges. Topographic maps serve many purposes for a diversity of professionals including, city planners, urban developers, hydrologists, flood plain managers, hazards researchers, and physical geographers to name a few. In their jobs, topographic maps are used to identify areas for potential growth, assess future problems related to growth issues, determine threats to the local environment, locate boundaries of flood plains, find areas prone to damage from disasters, and study the physical landscape.
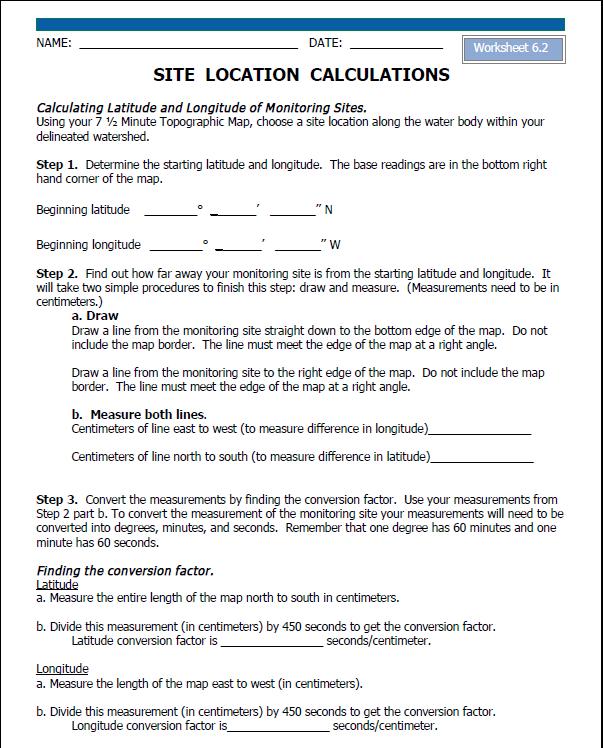
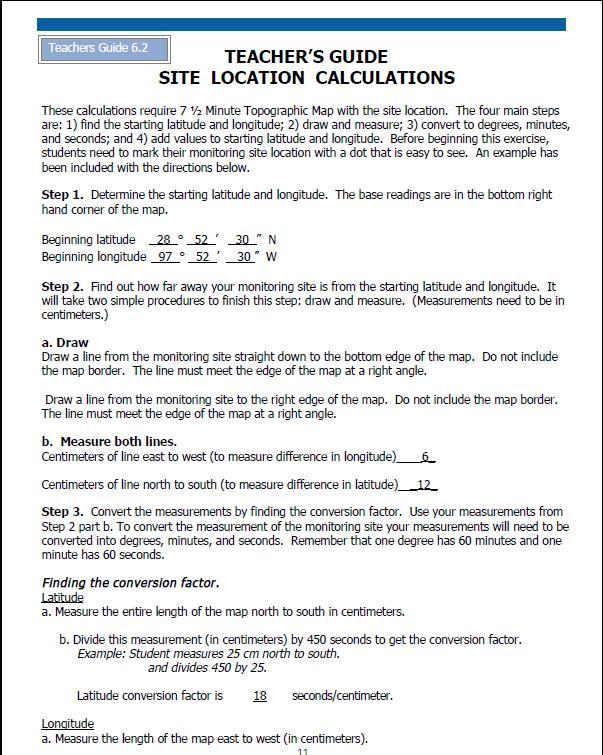
5 Latitude and Longitude Latitude and longitude is one of the coordinate systems represented on topographic maps. Latitude lines measure north and south and run east and west. Longitude lines measure east and west and run north and south. When writing and reading latitude and longitude, latitude always comes first. Each corner of the topographic map displays the latitude and longitude of that corner. These are the boundaries of the topographic map. Latitude and longitude readings in between these corners, or boundaries, are shown on the side of the map. Latitude readings can be found on the vertical axes of the map, while longitude readings are on the horizontal axes of the map. On topographic maps, latitude and longitude are given in degrees, minutes, and seconds. These units measure distance. One degree consists of 60 minutes and one minute consists of 60 seconds. The symbol for minutes is one apostrophe and seconds is two apostrophes. For example, a location at N, W is at 29 degrees, 52 minutes, and 30 seconds north latitude and 97 degrees, 45 minutes, and zero seconds west longitude. Classifying Topographic Maps One way of classifying topographic maps is by the scale of the map. The scale is a ratio between distance on the map and distance on the earth s surface. For example, Activity 3: Locating Your Monitoring Site 1. Gather materials. 2. On the topographic map, locate a monitoring site on a waterway. 3. Have students use Site Location Calculations worksheet (6.2) to find the latitude and longitude of their monitoring site. NOTE: Topographic maps printed from the web do not display latitude and longitude coordinates on the map and are not suitable for calculating the latitude and longitude of the monitoring site. Activity 4: Creating a Monitoring Plan 1. Gather materials. 2. Divide students into the same groups as for the previous activity, Mapping Your Watershed.
6 3. Provide each group with Monitoring Plan Activity worksheet (6.3). 4. Have students review the topographic maps and discuss their findings. 5. Using the information from their Watershed Survey, have each group design a Monitoring Plan around their watershed on their map. 6. After completing their Monitoring Plans, have each group discuss their findings and conclusion. Assessment/Evaluation 1. Lead a class discussion defining topographic maps, describing the purpose and uses of topographic maps, and explaining topographic map rules and symbols to introduce students to topographic maps and determine their comprehension of basic topographic map terminology. 2. The Watershed Mapping Activity will assess students understanding of topographic map rules, calculating latitude and longitude on a topographic map, watershed-mapping procedures, meanings of topographic map symbols, and identification of land uses. 3. The Monitoring Plan Activity measures student mastery of calculating map location and of developing a monitoring site plan. TEKS Science 8.1A, 8.2A, 8.2B, 8.2C, 8.2D, 8.2E, 8.3A, 8.4A, 8.4B, 8.11B, 8.11C Aquatic Science 1A,2A, 2B, 2C, 2D, 2E, 2F, 2G, 2H, 2I, 2J, 3A, 4A, 5B, 5D, 6A, 9C, 11B, 12A Biology 1A, 2E, 2F, 2G, 2H, 3A, 11B, 12F Chemistry 1A, 2E, 2F, 2G, 2H, 2I, 3A, 10A, 10B Earth and Space Science 1A, 2E, 2H, 2I, 3A Environmental Systems 1A, 2E, 2F, 2G, 2H, 2I, 2J, 2K, 3A, 4E, 5B, 9B, 9C
7 Resources ESRI topographic maps and digital data This ESRI site allows you to make and print a topographic map from their site. You may also obtain digital data for developing your own topographic map with GIS. Geographic Information Systems Data Depot Topographic map digital data This website provides digital data to create your own topographic map in GIS programs. Texas Center for Policy Studies - Texas Environmental Atlas The Texas Environmental Almanac displays facts and figures concerning environmental issues in Texas, including water quantity and water quality. The 1995 edition is available on-line at the above site. Texas Natural Resources Information System Paper topographic maps The Texas Natural Resources Information System (TNRIS) in Austin, Texas offers topographic maps for education. The only cost to you is shipping, which is $5 per tube of 25 maps. To order, visit them on the web at or call at Texas Parks and Wildlife - River basin and stream gauge identification and discharge Information about river basins and stream discharge is available at this site. Topozone - topographic maps This website offers free topographic maps that may be printed from their site. United States Geological Survey This site provides stream discharge data for specific gauging stations located in the United States.
8
9
10
11
12
13
14
15
16
Topo Map Tidbits. Adapted from: An original Creek Connections activity. Creek Connections, Box 10, Allegheny College, Meadville, Pennsylvania, 16335
 Topo Map Tidbits Adapted from: An original Creek Connections activity. Creek Connections, Box 10, Allegheny College, Meadville, Pennsylvania, 16335 Introduction to Topographic Maps Grade Level: Basic Duration:
Laboratory Exercise #2 Introduction to Quadrangle Maps
 page - Laboratory Exercise #2 Introduction to Quadrangle Maps A. Introduction to Quadrangle Maps The United States Geological Survey has developed a nationwide series of quadrangle maps that cover small
Lecture 9: Reference Maps & Aerial Photography
 Lecture 9: Reference Maps & Aerial Photography I. Overview of Reference and Topographic Maps There are two basic types of maps? Reference Maps - General purpose maps & Thematic Maps - maps made for a specific
Laboratory Exercise #2 Introduction to Quadrangle Maps
 page - 1 Laboratory Exercise #2 Introduction to Quadrangle Maps A. Introduction to Quadrangle Maps The United States Geological Survey has developed a nationwide series of quadrangle maps that cover small
Activities: Map and Compass
 Activities: Map and Compass Determining General Directions Modified with permission from Outdoor Living Skills Series: Map and Compass, Missouri Department of Conservation Overview: Students use the sun
Chapter 6 Mapping and Online Tools
 Chapter 6 Mapping and Online Tools The stream site you monitor is just part of a much larger system. When analyzing stream health, it is important to take a holistic view by considering the entire watershed.
Map Makers 2nd Grade
 Map Makers 2nd Grade Students use mapmaking to develop science and social studies concepts and practice map skills while developing a sense of place and a connection to the property. Concepts of landforms,
Erosional Features. What processes shaped this landscape?
 Have you ever looked at the land around you and wondered what processes shaped what you see? Perhaps you see mountains, valleys, rivers, or canyons. Do you know how long these geologic features have been
Geology 101 Lab Worksheet: Topographic Maps
 Geology 101 Lab Worksheet: Topographic Maps Name: Refer to the Topographic Maps Lab for the information you need to complete this worksheet (http://commons.wvc.edu/rdawes/g101ocl/labs/topomapslab.html).
EROSIONAL FEATURES. reflect
 reflect Have you ever looked at the land around you and wondered what processes shaped what you see? Perhaps you see mountains, valleys, rivers, or canyons. Do you know how long these geologic features
The details represented in the map depends mostly on the scale at which the map is designed.
 Measurement IN GIS A map is a visual representation of an area a symbolic depiction highlighting relationships between elements of that space such as objects, region, themes. The details represented in
Road Scholar. Williamette Valley Invitational Practice Tournament
 Road Scholar Williamette Valley Invitational Practice Tournament Rules for this Event As you complete this event, enter your answers on the online data sheet. You may click "submit" when done and quietly
B. Topographic maps are also called. contour maps
 Topographic Maps Introduction A. Topographic maps are essential tools in geologic and engineering studies because they show the configuration of Earth's surface in remarkable detail and permit one to measure
Mapping Earth. How are Earth s surface features measured and modeled?
 Name Mapping Earth How are Earth s surface features measured and modeled? Before You Read Before you read the chapter, think about what you know about maps Record your thoughts in the first column Pair
Using Map and Compass Together
 Using Map and Compass Together In situations where you foresee a potential evacuation on foot, where there are no roads, and no indication as to the direction of travel (i.e., road signs), it is recommended
APPENDIX A GLOSSARY. Appendix A.1
 APPENDIX A GLOSSARY Appendix A.1 Appendix A.2 Back Bearing A back bearing is measured from the object to your position. It is the exact opposite of a direct bearing. Base Line An imaginary line on the
Topographic Map Series:
 DEFINITION OF A MAP A MAP IS A GEOGRAPHIC PREPRESENTATION OF A PORTION OF THE EARTH S SURFACE DRAWN TO SCALE, AS SEEN FROM ABOVE. IT S USES COLORS, SYMBOLS AND LABELS TO REPRESENT FEATURES FOUND ON THE
One Hilltop, Three Major Watersheds!
 One Hilltop, Three Major Watersheds! Adapted from: An original Creek Connections activity. Creek Connections, Box E, Allegheny College, Meadville, Pennsylvania, 16335 Watersheds of PA/ Topo Map Review
Earth and Space: Topographic Maps Satellite Images
 Earth and Space: Topographic Maps Satellite Images Earth and Space: Formative Assessment Activities for Earth and Space Topographic Maps Satellite Images Teacher Pages Purpose The purpose of this station
UNIT 1C. USING TOPOGRAPHIC MAPS WHERE IN THE WORLD... ARE YOU?
 UNIT 1C. USING TOPOGRAPHIC MAPS WHERE IN THE WORLD... ARE YOU? TIME 60-90 minutes LEVEL All BENCHMARKS Next Generation Science Standards MS-LS1.D Science & Engineering Practices Developing and Using Models
Terrain Analysis through Maps.
 Terrain Analysis through Maps Need for Maps Theodolite Every Inch on Earth is Measured Maps are Prepared based on these Measurements Classification of Maps Function Scale Physical (Natural Features)
Map Mysteries Activities
 Page 1 of 8 Map Mysteries Activities 74,796 Ready-To-Go Lesson Plans Teaching Earth Science and Geography with USGS Topographic and Thematic Maps Author: Dr. Joseph J. Kerski Geographer Box 25046 - MS
1/28/16. EGM101 Skills Toolbox. Map types. Political Physical Topographic Climate Resource Road. Thematic maps (use one of the above as backdrop)
") EGM101 Skills Toolbox Map types Political Physical Topographic Climate Resource Road Thematic maps (use one of the above as backdrop) Map Types Deriving information from maps Hydrographic Geological Soils
EGM101 Skills Toolbox Map types Political Physical Topographic Climate Resource Road Thematic maps (use one of the above as backdrop) Map Types Deriving information from maps Hydrographic Geological Soils
About places and/or important events Landmarks Maps How the land is, hills or flat or mountain range Connected to maps World Different countries
 What do you think you know about geography? About places and/or important events Landmarks Maps How the land is, hills or flat or mountain range Connected to maps World Different countries What do you
Watershed Delineation
 Watershed Delineation Adapted from: An original Creek Connections activity. Creek Connections, Box E, Allegheny College, Meadville, Pennsylvania, 16335 Watershed Delineation Grade Level: Intermediate to
NAME DATE TOPOGRAPHIC MAPS. Activity 1: Topographic Map Investigation I: More Than a Road Map
 NAME DATE PARTNER(S) TOPOGRAPHIC MAPS Now you have seen how topographic maps can be generated to present the elevation of a terrain. Let s look at some topographic maps and learn how to interpret them.
Activity Plotting Earthquake Epicenters an activity for seismic discovery
 Note: this is not an activity from the TOTLE workshop, but is a good prerequisite to the triangulation activity that follows. Activity Plotting Earthquake Epicenters an activity for seismic discovery x
b. Why is the area affected by each earthquake circular or nearly circular? Where is the epicenter of each quake located?
 Name: Skill Sheet 29-A Interpreting Geologic Hazard Maps Plate tectonics and the weather are often the cause of geologic hazards such as earthquakes, volcanic eruptions, and flooding. Geologic hazard events
Map and Compass Skills
 Map and Compass Skills Grade levels: 5-12 In a Nutshell Given a map and compass, students will be able to find a location on the map, chart a course to that location with the compass, and find that location
Topographic Maps and Landforms Geology Lab
 Topographic Maps and Landforms Geology Lab Ray Rector: Instructor Today s Lab Activities 1) Discussion of Last Week s Lab 2) Lecture on Topo Maps and Elevation Contours 3) Construct Topographic Maps and
Finding Fault Geologic History from a Road Cut
 Finding Fault Geologic History from a Road Cut Elisabeth M. Price, DD LaPointe, and Jonathan G. Price 4 July 2005 Introduction Earth science is an important science to present to students because it directly
Mapping Earth. Technology and Mapmaking
 CHAPTER 1 LESSON 2 Mapping Earth Technology and Mapmaking Key Concepts What can a topographic map tell you about the shape of Earth s surface? What can you learn from geologic maps about the rocks near
How Irrigation Affected the Geography of Northeast Oregon
 Delia Wallis How Irrigation Affected the Geography of Northeast Oregon Grade Levels: 4 (with ability to move up or down) Time: two x 45-minute sessions Overview: Students are going to study topographical
Pierce Cedar Creek Institute GIS Development Final Report. Grand Valley State University
 Pierce Cedar Creek Institute GIS Development Final Report Grand Valley State University Major Goals of Project The two primary goals of the project were to provide Matt VanPortfliet, GVSU student, the
Plotting Earthquake Epicenters*
 Plotting Earthquake Epicenters* Seismic discovery Note: This is not an activity from the CEETEP workshop, but is a good prerequisite to the triangulation activity that follows. x In this activity, students
MAP STUDY: INTERPRETATION OF SURVEY MAPS
 MAP STUDY: INTERPRETATION OF SURVEY MAPS Types and Elements of Maps Maps are drawn to represent the Earth on a piece of paper. Maps are used widely to represent the Earth. Maps use signs and symbols in
Chapter 02 Maps. Multiple Choice Questions
 Chapter 02 Maps Multiple Choice Questions 1. Every projection has some degree of distortion because A. a curved surface cannot be represented on a flat surface without distortion. B. parallels and meridians
Vermont Stream Geomorphic Assessment. Appendix E. River Corridor Delineation Process. VT Agency of Natural Resources. April, E0 - April, 2004
 Vermont Stream Geomorphic Assessment Appendix E River Corridor Delineation Process Vermont Agency of Natural Resources - E0 - River Corridor Delineation Process Purpose A stream and river corridor delineation
Core Curriculum Supplement
 Core Curriculum Supplement Academic Unit / Office EAS Catalog Year of Implementation 2018-2019 Course (Prefix / Number) GEOL / 1370 Core Proposal Request Add to Core Curriculum Course Title Natural Disasters
AN ARCHAEOLOGICAL SURVEY FOR THE DCP MIDSTREAM THREE RIVERS PLANT TO CGP 51 PROJECT IN LIVE OAK COUNTY, TEXAS
 AN ARCHAEOLOGICAL SURVEY FOR THE DCP MIDSTREAM THREE RIVERS PLANT TO CGP 51 PROJECT IN LIVE OAK COUNTY, TEXAS By William E. Moore Brazos Valley Research Associates Contract Report Number 251 2011 AN ARCHAEOLOGICAL
Topographic Maps and Mount Rainier
 Topographic Maps and Mount Rainier 50 60 80 70 Learner Objectives: Students will: Read and understand map explanations, including the name, date and origin of the map, scale and contour intervals Understand
Class Notes: Mapping the Earth
 Name: Date: Period: Mapping the Earth The Physical Setting: Earth Science Class Notes: Mapping the Earth I. Latitude and Longitude Map -! Latitude -! Also called These lines intersect Equator -! The North
Topographic Maps. Take Notes as you view the slides
 Topographic Maps Take Notes as you view the slides Lesson Objectives Define a topographic map and state its uses. Describe how contour lines show the elevations, shape, and slope of the land. Identify
Stream Length. Adapted from: An original Creek Connections activity. Creek Connections, Box E, Allegheny College, Meadville, Pennsylvania, 16335
 Stream Length Adapted from: An original Creek Connections activity. Creek Connections, Box E, Allegheny College, Meadville, Pennsylvania, 16335 Stream Length Grade Level: Intermediate to Advanced Duration:
Get to Know Your Watershed
 engaging learners exploring watersheds connecting communities Get to Know Your Watershed QUESTION(S) What is a watershed? Where is my watershed? Author(s): Beth Bisson, Maine Sea Grant Program; Sandy Daniel,
Module 2 Educator s Guide Investigation 2
 Module 2 Educator s Guide Investigation 2 How does remote sensing help us to observe human activities on Earth? Investigation Overview Landscapes that are influenced by human activities are found nearly
Grade. Why are maps useful? What do maps tell us?
 ACTIVITY 2.1 Follow That DART Bus! DETAILS TYPE Whole-group TIME 20 minutes plus 20 minutes homework (40 minutes total) PRINTED MATERIALS Handouts (Reading A Map, Follow that DART Bus! map and Follow that
MAPPING THE EARTH HOW DO YOU FIND A LOCATION ON THE EARTH?
 MAPPING THE EARTH HOW DO YOU FIND A LOCATION ON THE EARTH? UNIT TOPICS TOPIC 1: LATITUDE & LONGITUDE TOPIC 2: FIELD MAPS TOPIC 3: TOPOGRAPHIC MAPS TOPIC 4: NYS LANDSCAPES TOPIC 1: LATITUDE & LONGITUDE
Quick Response Report #126 Hurricane Floyd Flood Mapping Integrating Landsat 7 TM Satellite Imagery and DEM Data
 Quick Response Report #126 Hurricane Floyd Flood Mapping Integrating Landsat 7 TM Satellite Imagery and DEM Data Jeffrey D. Colby Yong Wang Karen Mulcahy Department of Geography East Carolina University
Topographic Maps and Profiles
 Name: Date: Period: Earth Science Foundations The Physical Setting: Earth Science CLASS NOTES! Topographic Maps [contour maps] -! Topographic maps show three-dimensional shapes in two dimensions Elevation
CE 394K/CEE6440 GIS in Water Resources Fall 2018 Final Exam Solution
 CE 394K/CEE6440 GIS in Water Resources Fall 2018 Final Exam Solution 3. Austin Population The figure below shows two feature classes, one being the extent of the 1:24,000 Austin East topographic map and
Map Skills Lesson 1. Materials: maps, pencils, Lesson 1 Worksheet, strips of paper, grid paper
 Map Skills Lesson 1 Use cardinal directions, map grids, scales, and titles to locate places on a map. Interpret a map using information from its title, compass rose, scale, and legend. Vocabulary: map,
Looking at Communities: Comparing Urban and Rural Neighborhoods
 Looking at Communities: Comparing Urban and Rural Neighborhoods OVERVIEW & OBJECTIVES Our urban areas have become so dominant that frequently the children we teach have no connection with and very few
5 Themes of Geography Review Video Notes What is Geography?
 Name PG # 5 Themes of Geography Review Video Notes What is Geography? The study of, their, and their Main Idea or Topic Continents Notes about Main Idea or Topic There are 7 Continents or in the world:
FLOOD HAZARD MAPPING OF DHAKA-NARAYANGANJ-DEMRA (DND) PROJECT USING GEO-INFORMATICS TOOLS
 PROJECT USING GEO-INFORMATICS TOOLS") FLOOD HAZARD MAPPING OF DHAKA-NARAYANGANJ-DEMRA (DND) PROJECT USING GEO-INFORMATICS TOOLS Md. Aminul Islam MEE07178 Supervisor: Prof. Kuniyoshi TAKEUCHI ABSTRACT Dhaka-Narayanganj-Demra (DND) Project is
FLOOD HAZARD MAPPING OF DHAKA-NARAYANGANJ-DEMRA (DND) PROJECT USING GEO-INFORMATICS TOOLS Md. Aminul Islam MEE07178 Supervisor: Prof. Kuniyoshi TAKEUCHI ABSTRACT Dhaka-Narayanganj-Demra (DND) Project is
CHAPTER EXIT CHAPTER. Models of Earth. 3.1 Modeling the Planet. 3.2 Mapmaking and Technology. 3.3 Topographic Maps CHAPTER OUTLINE
 EXIT CHAPTER.1 Modeling the Planet.2 Mapmaking and Technology. Topographic Maps CHAPTER OUTLINE CHAPTER.1 Modeling the Planet A flat of Earth is a convenient tool, but it can distort the shape, distance,
Introduction to Contour Maps
 Your web browser (Safari 7) is out of date. For more security, comfort and Activityengage the best experience on this site: Update your browser Ignore Introduction to Contour Maps What information does
GET TO KNO W A NATIO NAL
 Your web browser (Safari 7) is out of date. For more security, comfort and the best experience on this site: Update your browser Ignore GET TO KNO W A NATIO NAL PARK W ITH FIEL DSCO PE Explore one of the
CAUSES FOR CHANGE IN STREAM-CHANNEL MORPHOLOGY
 CAUSES FOR CHANGE IN STREAM-CHANNEL MORPHOLOGY Chad A. Whaley, Department of Earth Sciences, University of South Alabama, MobileAL, 36688. E-MAIL: caw408@jaguar1.usouthal.edu The ultimate goal of this
MAPS AND THEIR CLASSIFICATION
 MAPPING MAPS AND THEIR CLASSIFICATION WHAT IS A MAP? A map is representation of the Earth's surface, showing how things are related to each other by distance, direction, and size. Maps are a way of showing
Chapter 1 Overview of Maps
 Chapter 1 Overview of Maps In this chapter you will learn about: Key points when working with maps General types of maps Incident specific maps Map legend and symbols Map sources A map is a navigational
Application of high-resolution (10 m) DEM on Flood Disaster in 3D-GIS
 DEM on Flood Disaster in 3D-GIS") Risk Analysis V: Simulation and Hazard Mitigation 263 Application of high-resolution (10 m) DEM on Flood Disaster in 3D-GIS M. Mori Department of Information and Computer Science, Kinki University, Japan
Risk Analysis V: Simulation and Hazard Mitigation 263 Application of high-resolution (10 m) DEM on Flood Disaster in 3D-GIS M. Mori Department of Information and Computer Science, Kinki University, Japan
Your web browser (Safari 7) is out of date. For more security, comfort and the best experience on this site: Update your browser Ignore
 is out of date. For more security, comfort and the best experience on this site: Update your browser Ignore") Your web browser (Safari 7) is out of date. For more security, comfort and the best experience on this site: Update your browser Ignore GIS ( GEO GRAPHIC INFO RMATIO N SYSTEM) geospatial information system
Your web browser (Safari 7) is out of date. For more security, comfort and the best experience on this site: Update your browser Ignore GIS ( GEO GRAPHIC INFO RMATIO N SYSTEM) geospatial information system
Progress Report. Flood Hazard Mapping in Thailand
 Progress Report Flood Hazard Mapping in Thailand Prepared By: Mr. PAITOON NAKTAE Chief of Safety Standard sub-beuro Disaster Prevention beuro Department of Disaster Prevention and Mitigation THAILAND E-mail:
FLOOD HAZARD AND RISK ASSESSMENT IN MID- EASTERN PART OF DHAKA, BANGLADESH
 FLOOD HAZARD AND RISK ASSESSMENT IN MID- EASTERN PART OF DHAKA, BANGLADESH Muhammad MASOOD MEE07180 Supervisor: Prof. Kuniyoshi TAKEUCHI ABSTRACT An inundation simulation has been done for the mid-eastern
[ 1.2 ] Texas Geography
![[ 1.2 ] Texas Geography](/thumbs/78/78091378.jpg "[ 1.2 ] Texas Geography") [ 1.2 ] Texas Geography [ 1.2 ] Texas Geography Learning Objectives Identify how geography helps people understand and organize information about a place. Compare the physical and human characteristics
[ 1.2 ] Texas Geography [ 1.2 ] Texas Geography Learning Objectives Identify how geography helps people understand and organize information about a place. Compare the physical and human characteristics
Basic Map Skills for the Outdoors
 Geography 80-20 80% of what there is to know, for 20% of the sweat Basic Map Skills for the Outdoors Map Scale Map source: US Geological Survey Four ways to indicate map scale: Representative fraction
Use of Geospatial data for disaster managements
 Use of Geospatial data for disaster managements Source: http://alertsystemsgroup.com Instructor : Professor Dr. Yuji Murayama Teaching Assistant : Manjula Ranagalage What is GIS? A powerful set of tools
Your web browser (Safari 7) is out of date. For more security, comfort and the best experience on this site: Update your browser Ignore
 is out of date. For more security, comfort and the best experience on this site: Update your browser Ignore") Your web browser (Safari 7) is out of date. For more security, comfort and the best experience on this site: Update your browser Ignore Activityengage MAPPING W O RL D HERITAGE Where are sites of significant
Your web browser (Safari 7) is out of date. For more security, comfort and the best experience on this site: Update your browser Ignore Activityengage MAPPING W O RL D HERITAGE Where are sites of significant
Laboratory Exercise #4 Geologic Surface Processes in Dry Lands
 Page - 1 Laboratory Exercise #4 Geologic Surface Processes in Dry Lands Section A Overview of Lands with Dry Climates The definition of a dry climate is tied to an understanding of the hydrologic cycle
Notes and Summary pages:
 Topographic Mapping 8.9C Interpret topographical maps and satellite views to identify land and erosional features and predict how these shapes may be reshaped by weathering ATL Skills: Communication taking
Your web browser (Safari 7) is out of date. For more security, comfort and the best experience on this site: Update your browser Ignore
 is out of date. For more security, comfort and the best experience on this site: Update your browser Ignore") Your web browser (Safari 7) is out of date. For more security, comfort and the best experience on this site: Update your browser Ignore Activitydevelop EXPLO RING PL ACE IN THE CHES APEAKE BAY WATERSHED
Your web browser (Safari 7) is out of date. For more security, comfort and the best experience on this site: Update your browser Ignore Activitydevelop EXPLO RING PL ACE IN THE CHES APEAKE BAY WATERSHED
4. GIS Implementation of the TxDOT Hydrology Extensions
 4. GIS Implementation of the TxDOT Hydrology Extensions A Geographic Information System (GIS) is a computer-assisted system for the capture, storage, retrieval, analysis and display of spatial data. It
 Chapter 2 Mapping Our World Picture: Mount Capulin, Raton, NM Cinder Cone Volcano ://3.bp.blogspot.com/_sKz1KwXRzcg/SzFzM52gIoI/AAAAAAAAABk/hguBAT80pk0/s320/capulin.jpg http://www.peteandmelissa.com/images/oklahoma/p1020190.jpg
 estrandh@uoregon.edu Introduction The general topic of this paper describes a unique cartographic project depicting a mountain landscape for the Friends of Opal Creek (F.O.C.), a non-profit organization.
Chapter 3 Models of the Earth. 3.1 Finding Locations on the Earth. 3.1 Objectives
 Chapter 3 Models of the Earth 3.1 Finding Locations on the Earth 3.1 Objectives Explain latitude and longitude. How can latitude and longitude be used to find locations on Earth? How can a magnetic compass
1. Origins of Geography
 II. ORIGINS AND BRANCHES OF GEOGRAPHY My Notes A. Origins of Geography Unit One 6 Before carefully examining the tools of the geographer, it would be useful to examine the origins and roots of this ancient
Classification of Erosion Susceptibility
 GEO327G: GIS & GPS Applications in Earth Sciences Classification of Erosion Susceptibility Denali National Park, Alaska Zehao Xue 12 3 2015 2 TABLE OF CONTENTS 1 Abstract... 3 2 Introduction... 3 2.1 Universal
Electronic Submission Format Guide Anthracite Preparation Plant Permit Application
 Electronic Submission Format Guide Anthracite Preparation Plant Permit Application Module 1: Application Section A through Section J, the Application Checklist, and all narrative responses Act 67 / 68
Curriculum Support Maps for the Study of Indiana Coal (Student Handout)
") Curriculum Support Maps for the Study of Indiana Coal (Student Handout) Introduction In this lesson you will learn how to use a geographic information system (GIS) program (IndianaMap) to investigate coal
Curriculum Support Maps for the Study of Indiana Coal (Student Handout) Introduction In this lesson you will learn how to use a geographic information system (GIS) program (IndianaMap) to investigate coal
Determination of Urban Runoff Using ILLUDAS and GIS
 Texas A&M University Department of Civil Engineering Instructor: Dr. Francisco Olivera CVEN689 Applications of GIS to Civil Engineering Determination of Urban Runoff Using ILLUDAS and GIS Tae Jin Kim 03.
Different types of maps and how to read them.
 Different types of maps and how to read them. A map is a picture or representation of the Earth's surface, showing how things are related to each other by distance, direction, and size. Maps have been
Electronic Submission Format Guide Bituminous Coal Surface Mine Permit Application (5600-PM-BMP0311)
") Electronic Submission Format Guide Bituminous Coal Surface Mine Permit Application (5600-PM-BMP0311) Module 1: Application Section A through Section J, the Application Checklist, and all narrative responses.
Electronic Submission Format Guide Bituminous Coal Surface Mine Permit Application (5600-PM-BMP0311) Module 1: Application Section A through Section J, the Application Checklist, and all narrative responses.
What Do You See? FOR 274: Forest Measurements and Inventory. Area Determination: Frequency and Cover
 What Do You See? Message of the Day: Many options exist to determine the size, area, or extent of a feature on a landscape FOR 274: Forest Measurements and Inventory Lecture 7: Measures of Land Area Frequency
STAAR Science Tutorial 40 TEK 8.9C: Topographic Maps & Erosional Landforms
 Name: Teacher: Pd. Date: STAAR Science Tutorial 40 TEK 8.9C: Topographic Maps & Erosional Landforms TEK 8.9C: Interpret topographic maps and satellite views to identify land and erosional features and
Information. Information Technology. Geographic. Services (GIS) 119 W Indiana Ave Deland, FL 32720
 119 W Indiana Ave Deland, FL 32720") Information Technology Geographic Information Services (GIS) 119 W Indiana Ave Deland, FL 32720 A GIS consists of 5 primary components: Hardware Software People Data Methods or Business Processes --- Hardware
Information Technology Geographic Information Services (GIS) 119 W Indiana Ave Deland, FL 32720 A GIS consists of 5 primary components: Hardware Software People Data Methods or Business Processes --- Hardware
Watershed Detectives:
 Watershed Detectives: Making Science Relevant Jessica Gordon City of Austin Watershed Protection Jessica.Gordon@austintexas.gov Watershed Detectives: Making Science Relevant The Fish Kill Mystery Austin-based,
Topographic Maps: Background
 Topographic Maps: Background Introduction From Dr. Terry Swanson, University of Washington, ESS 101 Lab, Geologic Techniques, and Dr. David Kendrick, Hobart and William Smith Colleges, Geneva, NY Geoscientists
Living in a Watershed
 Living in a Watershed Department of Ecosystem Science and Ma... http://ecosystems.psu.edu/youth/sftrc/lesson-plans/water/k-5/watershed Department of Ecosystem Science and Management Youth Living in a Watershed
Many Ways to Name a Place
 Your web browser (Safari 7) is out of date. For more security, comfort and Activityapply the best experience on this site: Update your browser Ignore Many Ways to Name a Place What are the names for the
3D Elevation Program, Lidar in Missouri. West Central Regional Advanced LiDAR Workshop Ray Fox
 3D Elevation Program, Lidar in Missouri West Central Regional Advanced LiDAR Workshop Ray Fox National Enhanced Elevation Assessment (Dewberry, 2011) Sponsored by the National Digital Elevation Program
Level 1 Geography, 2011
 91010 910100 1SUPERVISOR S Level 1 Geography, 2011 91010 Apply concepts and basic geographic skills to demonstrate understanding of a given environment 9.30 am ednesday Wednesday 2 November 2011 Credits:
Lab Topographic Maps. Name: Partner: Purpose. Background Information
 Lab Topographic Maps Name: Partner: Purpose The purpose of this lab is to familiarize you with graphic representations of the Earth s surface primarily maps. Simple line maps show the spatial relationship
Getting to know GIS. Chapter 1. Introducing GIS. Part 1. Learning objectives
 Part Getting to know GIS Chapter Introducing GIS Learning objectives Learn the uses of geographic information systems (GIS) Learn how GIS layers work Differentiate between GIS features and surfaces Obtain
1. Identify the Earth motion that provides the basis for our system of local time and time zones.
 Base your answers to questions 1 through 4 on the map below and on your knowledge of Earth science. The map shows the four time zones and some latitude and longitude lines across the continental United
Factors that Shape Places (Blacktown) Stage 3 Geography
 Stage 3 Geography") Factors that Shape Places (Blacktown) Stage 3 Geography Summary This unit is written for Stage 3 "Factors that shape places". It is a Geographical Inquiry, enabling students to work through the 3 stages
Factors that Shape Places (Blacktown) Stage 3 Geography Summary This unit is written for Stage 3 "Factors that shape places". It is a Geographical Inquiry, enabling students to work through the 3 stages
Ecological Land Cover Classification For a Natural Resources Inventory in the Kansas City Region, USA
 Ecological Land Cover Classification For a Natural Resources Inventory in the Kansas City Region, USA by Applied Ecological Services, Inc. In cooperation with the Mid-America Regional Council 600 Broadway,
Geography and Earth Science. Unit 5
 Geography and Earth Science Unit 5 Chapter 1 Map Skills Lesson 2 Introduction to Maps Key Terms What You Will Learn to Do Use map reading skills bar scale contrast elevation intermittent landforms legend
Great California Delta Trail Blueprint for Contra Costa and Solano Counties GIS AND MAPPING MEMORANDUM JULY 2010
 Great California Delta Trail Blueprint for Contra Costa and Solano Counties GIS AND MAPPING MEMORANDUM JULY 2010 {DRAFT} July 2010 Introduction Geographic Information Systems (GIS) are computer-based
Name Class Date. For each pair of terms, explain how the meanings of the terms differ.
 Skills Worksheet Chapter Review USING KEY TERMS For each pair of terms, explain how the meanings of the terms differ. 1. true north and magnetic north 2. latitude and longitude 3. equator and prime meridian