New Intensity-Frequency- Duration (IFD) Design Rainfalls Estimates
|
|
|
- Garey Sullivan
- 6 years ago
- Views:
Transcription
1 New Intensity-Frequency- Duration (IFD) Design Rainfalls Estimates Janice Green Bureau of Meteorology 17 April 2013


2 Current IFDs AR&R87

3 Current IFDs AR&R87
4 Current IFDs - AR&R87 Options for estimating IFDs Read the six master charts to obtain intensities for basic durations and frequencies; read regional coefficient of skewness from master chart; read short duration factors from appropriate curves; estimate intensities for LPIII distribution for basic ARIs and durations using Diagram 2.2; estimate LPIII intensities for other durations using Diagram 2.1 Software developed to derive IFD relationships eg AusIFD Engage HAS at Bureau to provide $100 Computerised Design IFD Rainfall System (CDIRS) on-line

5 Current IFDs CDIRS On-line

6 Current IFDs CDIRS On-line

7 Current IFDs CDIRS On-line

8 Current IFDs CDIRS On-line
9 Current IFDs Developed by Bureau of Meteorology nearly 30 years ago Used a database comprising information primarily from the Bureau s network of daily read and pluviograph stations Adopted statistical techniques considered appropriate at the time Focus of the IFDs was the design of structures on relatively large rural catchments and therefore durations of less than five minutes were not considered necessary.
10 Basic approach Rainfall data Series of extreme values Establishment of database Quality controlling of data Annual Maximum Series Partial Duration Series Frequency Analysis Regionalisation Extraction of L-moments Choice of probability distribution Sub-daily and sub-hourly statistics Index rainfall approach Regions of Influence Gridding Explanatory variables Gridding technique Dissemination Outputs Medium
11 AR&R87 IFDs Adopted Approach Aspect ARR87 Data Record length BoM stations only ~ up to 1983; 7500 daily read > 30 years; 600 pluviographs > 6 years Frequency analysis Annual maximum series; method of moments; Log-Pearson Type III Daily to sub-daily Mapping Frequency Duration Dissemination Climate change Principal Component Analysis Subjective (meteorological analysis); ANUSPLIN used to translate hand drawn contours into grid format (CDIRS) ARIs 1 year to 100 year 5 minute to 72 hour (3 day) Maps; HAS; CDIRS on-line Stationary climate assumed; climatic trends negligible effect on IFDs
12 IFD2015 Adopted Approach Aspect IFD2013 Data Bureau stations plus stations from other data collecting agencies Record length up to 2011; 8074 daily read > 30 years (+2 >20 years); 2280 pluviographs > 8 years (754 Bureau; 1526 Regs) Frequency analysis Annual maximum series; L-moment; GEV Daily to sub-daily Mapping Frequency Duration Dissemination Climate change Bayesian Generalised Least Squares Regression ANUSPLIN 1 EY to 1% AEP 1 minute to 168 hour (7 day) New webpage on Bureau s website Stationarity of long term stations explicitly assessed and no significant trends identified; therefore using complete period of record
13 Data base Bureau of Meteorology Australian Data Archive for Meteorology (ADAM ) Contains daily read rainfall stations (both open & closed) for period from 1800 to 2011 Contain 1467 continuous stations both pluviograph & TBRG Water Act 2007 identified the Bureau s new responsibilities including collecting and publishing water information Water Regulations 2008 provided ready access to rainfall data collected by other organisations In particular, data from dense continuous rainfall networks operated by urban water utilities and councils: ~350 daily read rainfall stations ~2175 continuous rainfall stations
14 Spatial coverage of daily read rainfall stations
15 Spatial coverage of continuous rainfall stations
16 Data base Finalisation of data base Initially December 2010
17 Data base Finalisation of data base Initially December 2010
18 Data base Finalisation of data base Initially December 2010 Updated to December 2011
19 Data base Finalisation of data base Initially December 2010 Updated to December 2011


20 Data base Finalisation of data base Initially December 2010 Updated to December 2011 Updated to March 2012?????
21 Quality Control Previous work had undertaken QCing on a largely manual basis Enormous amount of data that needed to be quality controlled > daily read stations - Bureau > 1500 pluviograph stations Bureau ~350 daily read rainfall stations Water Regulations ~2175 continuous rainfall stations Water Regulations Disparate amount and type of QCing undertaken by data providers Necessitated automating as much of QCing as possible However still required manual QCing using Bureau s Quality Monitoring System (QMS)
22 QCing daily read data Quality Controlling of daily read data: Infilling of missing data Disaggregation of flagged accumulated daily rainfall totals Detection of suspect data, identification and correction of: Unflagged accumulated totals Time shifts Identification of gross errors - data inconsistent with neighbouring records but not either of the above two categories Manual correction gross errors identified as having a high probability of being incorrect


23 QCing daily read data using QMS
24 QCing of continuous data QCing of continuous rainfall data considerably more complicated: significantly more data due to shorter time step sparsity of continuous station network means fewer stations with which to compare small rainfall depths extremely difficult to QC Needed to reduce amount of data to be QC d to a manageable amount Developed approach QC d the PDS 5 x number of years of record Durations of: 5, 10, 15, 30 minutes 1, 2, 3, 6, 12 hours 1, 2, 3 days Number of PDS values to be QC d > 1,000,000
25 QCing continuous data Issues with Continuous Rainfall Data Time shifts of clock - DINES Missed pulses TBRG QCing procedure compared values to: AWAP (Australian Water Availability Product) gridded daily rainfall data Co-located or nearby daily read stations AWS (Automatic Weather Stations) Synoptic stations
26 Trialling of frequency distributions Frequency analysis Previously adopted Log-Pearson Type III fitted by method of moments Used 58 Bureau long-term continuous rainfall stations to trial a range of distributions From each of the 58 continuous rainfall stations extracted both the AMS and the PDS
27 Trialling of frequency distributions AMS & PDS extracted for durations of : 6, 12, 18, and 30 minutes 1, 2, 3, 6, and 12 hours Calculated L-moments and fit five distributions: Generalised Logistic (GLO) Generalised Extreme Value (GEV) Generalised Normal (GNO) Pearson Type III (PE3) Generalised Pareto (GPA). Assessed goodness of fit using Hosking and Wallis (1997) goodness of fit measure ZDist
28 Trialling of frequency distributions AMS PDS the GEV gave the most acceptable fit for all durations except 3 and 12 hours however, with the exception of the GPA, the other distributions also showed acceptable fits the GPA gave the most acceptable fit for all durations
29 Extraction of L-moments L-moments used to summarise statistical properties of AMS and PDS Index rainfall (mean) L-skewness L-CV L-moments expected to be more robust against large outliers in the data, particularly for the higher order moments. To reduce uncertainty in the parameter estimates, minimum station record lengths have been adopted 30 years for daily rainfall stations and 9 years for sub daily rainfall stations.
30 Estimation of sub-daily rainfalls Shift in focus to urban design on small catchments necessitating the provision of IFD estimates for durations as short as one minute Far fewer continuous rainfall stations than daily read rainfall stations

31 Spatial coverage of daily read rainfall stations

32 Spatial coverage of continuous rainfall stations
33 Derivation of short duration IFDs Need a method to improve spatial coverage of sub-daily data Most commonly done using information from daily stations Statistics of sub-daily data are inferred from those of daily data Techniques adopted include: Factoring of the 24 hour IFDs Principal component analysis (PCA) Partial least squares regression (PLSR)
34 Derivation of short duration IFDs However, major weakness of the previously adopted approaches is their inability to account for: Variation in record lengths from site to site Inter-station correlation An approach that avoids these problems is Bayesian Generalised Least Squares Regression (BGLSR)
35 Approach to be adopted Statistics to be derived (predictands) are: Index rainfall (mean) L-skewness L-CV Predictors to be used are: Location (latitude & longitude) Elevation Slope Aspect Distance from coast Mean annual rainfall Index rainfall, L-skewness & L-CV at 24, 48 & 72 hours
36 Regionalisation Regionalisation recognises for stations with short records considerable uncertainty when estimating the parameters of probability distributions and short records can bias estimates of rainfall statistics Overcome by combining information from multiple rainfall stations more accurate estimates of the probability distribution parameters can be made


37 Regionalisation Substitute space for time REGIONALISATION
38 Regionalisation Index rainfall approach adopted to do this (Hosking & Wallis) Station point estimates have been regionalised using a Region of Influence Approach (ROI). Trialled various approaches => ROIs defined as circle which is expanded until it includes 500 station years of record Circular ROIs defined with distance defined in three dimensions Latitude Longitude Elevation


39 Region of influence
40 Region of influence

41 Region of influence
42 Gridding Regionalisation gave estimates of GEV parameters at all station locations Combined with the mean of the AMS (index) at that site to estimate rainfall quantiles for any required exceedance probability. However IFD estimates required across Australia, not just at station locations. Results of the analyses needed to be extended in some way to ungauged locations.
43 Gridding Translation from point to gridded rainfall estimates carried out with thin plate smoothing splines implemented using ANUSPLIN. ANUSPLIN (Hutchinson 2007) was chosen to grid the GEV parameters so that IFD estimates are available for any point in Australia. GEV parameters are being gridded in ANUSPLIN, as: earlier testing showed little difference in quantile estimates if point parameter or point rainfall depths gridded. Gridding rainfall parameters gives more flexibility in the choice of exceedance probabilities that can be extracted and requires fewer grids to be processed in ANUSPLIN. Appropriate level of smoothing chosen through generalised cross validation by minimising the predictive error of the fitted surface

44 Interpolation point to grid SHAPE GRID SCALE GRID MEAN GRID


45 Gridding Index Alpha Kappa
46 Interpolation point to grid SHAPE GRID Y = 1 in 100 AEP Y = 1 in 50 AEP Y = 1 in 20 AEP Y = 1 in 10 AEP Y = 1 in 5AEP Y = 1 in 2 AEP SCALE GRID MEAN GRID

47 ANUSPLIN Output Example
48 Outputs Revised IFDs will be provided as depths in millimetres (not intensities) Revised IFDs will be provided for standard durations of: 1, 2, 3, 4, 5, 10, 15, 30 minutes 1, 2, 3, 6, 12 hours 1, 2, 3, 4, 5, 6, 7 days
49 Outputs Revised IFDs will be provided for standard EY and AEPs of: 1EY (1 Exceedance Per Year) 50%, 20%, 10%, 5%, 2%, 1% AEP New AR&R probability terminology
50 Revised IFDs Revised IFDs will be disseminated In electronic form Via new web page accessed from Bureau of Meteorology website Revised IFDs will be released 2 Phases
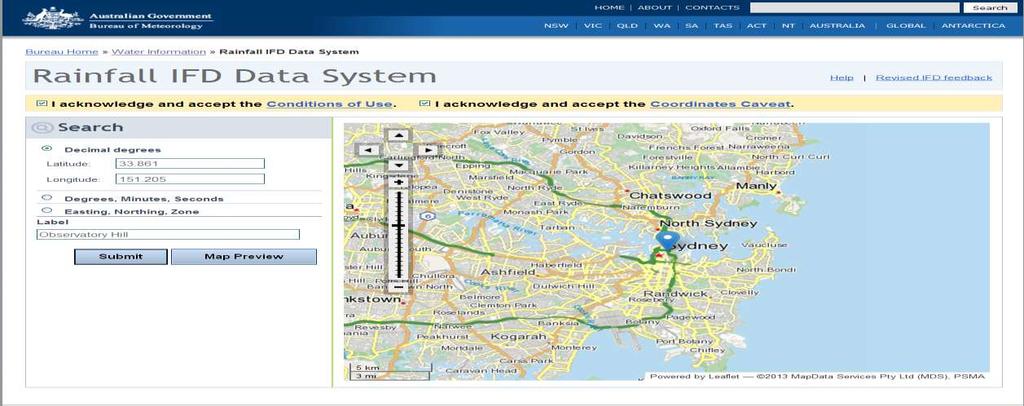
51 Phase 1 Phase 1 Revised IFDs for a point Functionality of Phase 1 web pages => same as current CDIRS web page Except raw data from 6 master charts, skew & short duration maps CDIRS and IFD 2013 run in parallel for ~ 18 months

52 Phase 1 IFD Web page

53 Phase 1 IFD Web page
54
55
56
57
58 Phase 2 Phase 2 - Enhancements Multiple locations Dynamic map Areal reduction factors Temporal patterns Areal IFDs
59 Phase 2 Phase 2 - Enhancements Seasonal IFDs Sub-annual IFDs eg 2EY, 12 EY Uncertainty estimates Advice provided for IFDs < 1 minute and > 7 days Rainfall frequency curve to 0.05% AEP (incorporating CRCFORGE estimates) Climate change adjustments to IFDs
 6232 3558 j.")
60 More information. Leave your business card Janice Green (02) or
New design rainfalls. Janice Green, Project Director IFD Revision Project, Bureau of Meteorology
 New design rainfalls Janice Green, Project Director IFD Revision Project, Bureau of Meteorology Design Rainfalls Design Rainfalls Severe weather thresholds Flood forecasting assessing probability of rainfalls
PLANNED UPGRADE OF NIWA S HIGH INTENSITY RAINFALL DESIGN SYSTEM (HIRDS)
") PLANNED UPGRADE OF NIWA S HIGH INTENSITY RAINFALL DESIGN SYSTEM (HIRDS) G.A. Horrell, C.P. Pearson National Institute of Water and Atmospheric Research (NIWA), Christchurch, New Zealand ABSTRACT Statistics
PLANNED UPGRADE OF NIWA S HIGH INTENSITY RAINFALL DESIGN SYSTEM (HIRDS) G.A. Horrell, C.P. Pearson National Institute of Water and Atmospheric Research (NIWA), Christchurch, New Zealand ABSTRACT Statistics
High intensity rainfall estimation in New Zealand
 Water New Zealand 31 st October 2013 High intensity rainfall estimation in New Zealand Graeme Horrell Engineering Hydrologist, Contents High Intensity Rainfall Design System (HIRDS Version 1) HIRDS Version
Updated Precipitation Frequency Estimates for Minnesota
 1 Updated Precipitation Frequency Estimates for Minnesota Presenter: Authors: (alphabetical order) Sanja Perica, Director Hydrometeorological Design Studies Center (HDSC), Office of Hydrology, National
USGS ATLAS. BACKGROUND
 USGS ATLAS. BACKGROUND 1998. Asquith. DEPTH-DURATION FREQUENCY OF PRECIPITATION FOR TEXAS. USGS Water-Resources Investigations Report 98 4044. Defines the depth-duration frequency (DDF) of rainfall annual
USSD Conference, Denver 2016
 USSD Conference, Denver 2016 M Schaefer, MGS Engineering Consultants K Neff, TVA River Operations C Jawdy, TVA River Operations S Carney, Riverside Technology B Barker, MGS Engineering Consultants G Taylor,
A New Probabilistic Rational Method for design flood estimation in ungauged catchments for the State of New South Wales in Australia
 21st International Congress on Modelling and Simulation Gold Coast Australia 29 Nov to 4 Dec 215 www.mssanz.org.au/modsim215 A New Probabilistic Rational Method for design flood estimation in ungauged
Australian Rainfall & Runoff
 Australian Rainfall & Runoff Revision Projects REVISION PROJECT 2 SPATIAL PATTERNS OF RAINFALL Short Duration Areal Reduction Factors STAGE 2 REPORT P2/S2/019 FEBRUARY 2014 AUSTRALIAN RAINFALL AND RUNOFF
Section 2.2 RAINFALL DATABASE S.D. Lynch and R.E. Schulze
 Section 2.2 RAINFALL DATABASE S.D. Lynch and R.E. Schulze Background to the Rainfall Database The rainfall database described in this Section derives from a WRC project the final report of which was titled
Regional Flood Estimation for NSW: Comparison of Quantile Regression and Parameter Regression Techniques
 21st International Congress on Modelling and Simulation, Gold Coast, Australia, 29 Nov to 4 Dec 2015 www.mssanz.org.au/modsim2015 Regional Flood Estimation for NSW: Comparison of Quantile Regression and
Tutorial 10 - PMP Estimation
 Tutorial 10 - PMP Estimation In Australia, the Probable Maximum Precipitation (PMP) storms are estimated using three generalised methods: Generalised Short Duration Method (GSDM) for short durations. Generalised
NRC Workshop - Probabilistic Flood Hazard Assessment Jan 2013
 Regional Precipitation-Frequency Analysis And Extreme Storms Including PMP Current State of Understanding/Practice Mel Schaefer Ph.D. P.E. MGS Engineering Consultants, Inc. Olympia, WA NRC Workshop - Probabilistic
Regionalization for one to seven day design rainfall estimation in South Africa
 FRIEND 2002 Regional Hydrology: Bridging the Gap between Research and Practice (Proceedings of (he fourth International l-'riknd Conference held at Cape Town. South Africa. March 2002). IAI IS Publ. no.
LITERATURE REVIEW. History. In 1888, the U.S. Signal Service installed the first automatic rain gage used to
 LITERATURE REVIEW History In 1888, the U.S. Signal Service installed the first automatic rain gage used to record intensive precipitation for short periods (Yarnell, 1935). Using the records from this
Australian Rainfall & Runoff
 Australian Rainfall & Runoff Revision Projects PROJECT 2 Spatial Patterns of Rainfall Short Duration Areal Reduction Factors STAGE 3 REPORT P2/S3/019 SEPTEMBER 2015 AUSTRALIAN RAINFALL AND RUNOFF REVISION
A Comparison of Rainfall Estimation Techniques
 A Comparison of Rainfall Estimation Techniques Barry F. W. Croke 1,2, Juliet K. Gilmour 2 and Lachlan T. H. Newham 2 SUMMARY: This study compares two techniques that have been developed for rainfall and
Design Flood Estimation in Ungauged Catchments: Quantile Regression Technique And Probabilistic Rational Method Compared
 Design Flood Estimation in Ungauged Catchments: Quantile Regression Technique And Probabilistic Rational Method Compared N Rijal and A Rahman School of Engineering and Industrial Design, University of
8-km Historical Datasets for FPA
 Program for Climate, Ecosystem and Fire Applications 8-km Historical Datasets for FPA Project Report John T. Abatzoglou Timothy J. Brown Division of Atmospheric Sciences. CEFA Report 09-04 June 2009 8-km
Regional Frequency Analysis of Extreme Climate Events. Theoretical part of REFRAN-CV
 Regional Frequency Analysis of Extreme Climate Events. Theoretical part of REFRAN-CV Course outline Introduction L-moment statistics Identification of Homogeneous Regions L-moment ratio diagrams Example
Model Output Statistics (MOS)
") Model Output Statistics (MOS) Numerical Weather Prediction (NWP) models calculate the future state of the atmosphere at certain points of time (forecasts). The calculation of these forecasts is based on
Model Output Statistics (MOS) Numerical Weather Prediction (NWP) models calculate the future state of the atmosphere at certain points of time (forecasts). The calculation of these forecasts is based on
IT S TIME FOR AN UPDATE EXTREME WAVES AND DIRECTIONAL DISTRIBUTIONS ALONG THE NEW SOUTH WALES COASTLINE
 IT S TIME FOR AN UPDATE EXTREME WAVES AND DIRECTIONAL DISTRIBUTIONS ALONG THE NEW SOUTH WALES COASTLINE M Glatz 1, M Fitzhenry 2, M Kulmar 1 1 Manly Hydraulics Laboratory, Department of Finance, Services
Extreme Precipitation in New York & New England [ ]
![Extreme Precipitation in New York & New England [ ]](/thumbs/73/68996398.jpg "Extreme Precipitation in New York & New England [ ]") Extreme Precipitation in New York & New England [ http://www.precip.net ] Technical Documentation & User Manual Dr. Art DeGaetano Dan Zarrow Northeast Regional Climate Center Cornell University Ithaca,
Extreme Precipitation in New York & New England [ http://www.precip.net ] Technical Documentation & User Manual Dr. Art DeGaetano Dan Zarrow Northeast Regional Climate Center Cornell University Ithaca,
STRUCTURAL ENGINEERS ASSOCIATION OF OREGON
 STRUCTURAL ENGINEERS ASSOCIATION OF OREGON P.O. Box 3285 PORTLAND, OR 97208 503.753.3075 www.seao.org E-mail: jane@seao.org 2010 OREGON SNOW LOAD MAP UPDATE AND INTERIM GUIDELINES FOR SNOW LOAD DETERMINATION
QPE and QPF in the Bureau of Meteorology
 QPE and QPF in the Bureau of Meteorology Current and future real-time rainfall products Carlos Velasco (BoM) Alan Seed (BoM) and Luigi Renzullo (CSIRO) OzEWEX 2016, 14-15 December 2016, Canberra Why do
Extreme Rain all Frequency Analysis for Louisiana
 78 TRANSPORTATION RESEARCH RECORD 1420 Extreme Rain all Frequency Analysis for Louisiana BABAK NAGHAVI AND FANG XIN Yu A comparative study of five popular frequency distributions and three parameter estimation
High Intensity Rainfall Design System
 High Intensity Rainfall Design System Version 4 Prepared for Envirolink August 2018 Prepared by: Trevor Carey-Smith Roddy Henderson Shailesh Singh For any information regarding this report please contact:
CHAPTER 1 INTRODUCTION
 CHAPTER 1 INTRODUCTION Mean annual precipitation (MAP) is perhaps the most widely used variable in hydrological design, water resources planning and agrohydrology. In the past two decades one of the basic
RADAR Rainfall Calibration of Flood Models The Future for Catchment Hydrology? A Case Study of the Stanley River catchment in Moreton Bay, Qld
 RADAR Rainfall Calibration of Flood Models The Future for Catchment Hydrology? A Case Study of the Stanley River catchment in Moreton Bay, Qld A 1 Principal Engineer, Water Technology Pty Ltd, Brisbane,
On the use of radar rainfall estimates and nowcasts in an operational heavy rainfall warning service
 On the use of radar rainfall estimates and nowcasts in an operational heavy rainfall warning service Alan Seed, Ross Bunn, Aurora Bell Bureau of Meteorology Australia The Centre for Australian Weather
Development of a regional flood frequency estimation model for Pilbara, Australia
 2st International Congress on Modelling and Simulation, Gold Coast, Australia, 29 Nov to 4 Dec 205 www.mssanz.org.au/modsim205 Development of a regional flood frequency estimation model for Pilbara, Australia
SEASONAL AND ANNUAL TRENDS OF AUSTRALIAN MINIMUM/MAXIMUM DAILY TEMPERATURES DURING
 SEASONAL AND ANNUAL TRENDS OF AUSTRALIAN MINIMUM/MAXIMUM DAILY TEMPERATURES DURING 1856-2014 W. A. van Wijngaarden* and A. Mouraviev Physics Department, York University, Toronto, Ontario, Canada 1. INTRODUCTION
4.5 Comparison of weather data from the Remote Automated Weather Station network and the North American Regional Reanalysis
 4.5 Comparison of weather data from the Remote Automated Weather Station network and the North American Regional Reanalysis Beth L. Hall and Timothy. J. Brown DRI, Reno, NV ABSTRACT. The North American
Gridded Historical Monthly Climate Data for the Australian Continent: January 1900-December Technical Report.
 CRC for Greenhouse Accounting: Gridded Historical Monthly Climate Data for the Australian Continent: January 19-December 24. Technical Report. Bevan McBeth and Stephen Roxburgh November 25 1 Contents Introduction...3
The Australian Operational Daily Rain Gauge Analysis
 The Australian Operational Daily Rain Gauge Analysis Beth Ebert and Gary Weymouth Bureau of Meteorology Research Centre, Melbourne, Australia e.ebert@bom.gov.au Daily rainfall data and analysis procedure
Changes to Extreme Precipitation Events: What the Historical Record Shows and What It Means for Engineers
 Changes to Extreme Precipitation Events: What the Historical Record Shows and What It Means for Engineers Geoffrey M Bonnin National Oceanic and Atmospheric Administration National Weather Service Office
Combining Deterministic and Probabilistic Methods to Produce Gridded Climatologies
 Combining Deterministic and Probabilistic Methods to Produce Gridded Climatologies Michael Squires Alan McNab National Climatic Data Center (NCDC - NOAA) Asheville, NC Abstract There are nearly 8,000 sites
Precipitation Extremes in the Hawaiian Islands and Taiwan under a changing climate
 Precipitation Extremes in the Hawaiian Islands and Taiwan under a changing climate Pao-Shin Chu Department of Atmospheric Sciences University of Hawaii-Manoa Y. Ruan, X. Zhao, D.J. Chen, and P.L. Lin December
Aurora Bell*, Alan Seed, Ross Bunn, Bureau of Meteorology, Melbourne, Australia
 15B.1 RADAR RAINFALL ESTIMATES AND NOWCASTS: THE CHALLENGING ROAD FROM RESEARCH TO WARNINGS Aurora Bell*, Alan Seed, Ross Bunn, Bureau of Meteorology, Melbourne, Australia 1. Introduction Warnings are
Met Éireann Climatological Note No. 15 Long-term rainfall averages for Ireland,
 Met Éireann Climatological Note No. 15 Long-term rainfall averages for Ireland, 1981-2010 Séamus Walsh Glasnevin Hill, Dublin 9 2016 Disclaimer Although every effort has been made to ensure the accuracy
NEW REGIONAL FLOOD FREQUENCY ESTIMATION (RFFE) METHOD FOR THE WHOLE OF AUSTRALIA: OVERVIEW OF PROGRESS
 METHOD FOR THE WHOLE OF AUSTRALIA: OVERVIEW OF PROGRESS") NEW REGIONAL FLOOD FREQUENCY ESTIMATION (RFFE) METHOD FOR THE WHOLE OF AUSTRALIA: OVERVIEW OF PROGRESS A. Rahman 1, K. Haddad 1, M. Zaman 1, G. Kuczera 2, P. E. Weinmann 3, P. Stensmyr 4, M. Babister 4
NEW REGIONAL FLOOD FREQUENCY ESTIMATION (RFFE) METHOD FOR THE WHOLE OF AUSTRALIA: OVERVIEW OF PROGRESS A. Rahman 1, K. Haddad 1, M. Zaman 1, G. Kuczera 2, P. E. Weinmann 3, P. Stensmyr 4, M. Babister 4
RAINFALL DURATION-FREQUENCY CURVE FOR UNGAGED SITES IN THE HIGH RAINFALL, BENGUET MOUNTAIN REGION IN THE PHILIPPINES
 RAINFALL DURATION-FREQUENCY CURVE FOR UNGAGED SITES IN THE HIGH RAINFALL, BENGUET MOUNTAIN REGION IN THE PHILIPPINES GUILLERMO Q. TABIOS III Department of Civil Engineering, University of the Philippines
What is one-month forecast guidance?
 What is one-month forecast guidance? Kohshiro DEHARA (dehara@met.kishou.go.jp) Forecast Unit Climate Prediction Division Japan Meteorological Agency Outline 1. Introduction 2. Purposes of using guidance
Dr Harvey Stern. University Of Melbourne, School Of Earth Sciences
 Dr Harvey Stern University Of Melbourne, School Of Earth Sciences Evaluating the Accuracy of Weather Predictions for Melbourne Leading Up to the Heavy Rain Event of Early December 2017 ABSTRACT: The opening
Hydrological forecasting and decision making in Australia
 Hydrological forecasting and decision making in Australia Justin Robinson, Jeff Perkins and Bruce Quig Bureau of Meteorology, Australia The Bureau's Hydrological Forecasting Services Seasonal Forecasts
How Significant is the BIAS in Low Flow Quantiles Estimated by L- and LH-Moments?
 How Significant is the BIAS in Low Flow Quantiles Estimated by L- and LH-Moments? Hewa, G. A. 1, Wang, Q. J. 2, Peel, M. C. 3, McMahon, T. A. 3 and Nathan, R. J. 4 1 University of South Australia, Mawson
First step: Construction of Extreme Rainfall timeseries
 First step: Construction of Extreme Rainfall timeseries You may compile timeseries of extreme rainfalls from accumulated intervals within the environment of Hydrognomon or import your existing data e.g.
STUDY OF FIXED-DURATION DESIGN RAINFALLS IN AUSTRALIAN RAINFALL RUNOFF AND JOINT PROBABILITY BASED DESIGN RAINFALLS
 STUDY OF FIXED-DURATION DESIGN RAINFALLS IN AUSTRALIAN RAINFALL RUNOFF AND JOINT PROBABILITY BASED DESIGN RAINFALLS ABDUR RAUF and ATAUR RAHMAN School of Engineering and Industrial Design, University of
data: Precipitation Interpolation
 Gridding and Uncertainties in gridded data: Precipitation Interpolation Phil Jones, Richard Cornes, Ian Harris and David Lister Climatic Research Unit UEA Norwich, UK Issues to be discussed Alternative
Gridded observation data for Climate Services
 Gridded observation data for Climate Services Ole Einar Tveito, Inger Hanssen Bauer, Eirik J. Førland and Cristian Lussana Norwegian Meteorological Institute Norwegian annual temperatures Norwegian annual
Extending clustered point process-based rainfall models to a non-stationary climate
 Extending clustered point process-based rainfall models to a non-stationary climate Jo Kaczmarska 1, 2 Valerie Isham 2 Paul Northrop 2 1 Risk Management Solutions 2 Department of Statistical Science, University
Introduction to Weather Data Cleaning
 Introduction to Weather Data Cleaning Speedwell Weather Limited An Introduction Providing weather services since 1999 Largest private-sector database of world-wide historic weather data Major provider
Hindcasting Wave Conditions on the North American Great Lakes
 Hindcasting Wave Conditions on the North American Great Lakes D. Scott 1, D. Schwab 2, C. Padala 1, and P. Zusek 1 1. & Associates 2. Great Lakes Environmental Research Laboratory, NOAA Lake Ontario 310
VALIDATION OF SPATIAL INTERPOLATION TECHNIQUES IN GIS
 VALIDATION OF SPATIAL INTERPOLATION TECHNIQUES IN GIS V.P.I.S. Wijeratne and L.Manawadu University of Colombo (UOC), Kumarathunga Munidasa Mawatha, Colombo 03, wijeratnesandamali@yahoo.com and lasan@geo.cmb.ac.lk
SPI: Standardized Precipitation Index
 PRODUCT FACT SHEET: SPI Africa Version 1 (May. 2013) SPI: Standardized Precipitation Index Type Temporal scale Spatial scale Geo. coverage Precipitation Monthly Data dependent Africa (for a range of accumulation
An introduction to homogenisation
 An introduction to homogenisation WMO-ETSCI Workshop, Pune 3-7 October 2016 Acacia Pepler Australian Bureau of Meteorology What do we want? A perfect station A well-situated and maintained station with
Flood hydrology of the Mangaroa River MARCH 2005
 Flood hydrology of the Mangaroa River MARCH 2005 MARCH 2005 Flood hydrology of the Mangaroa River Laura Watts Contents Summary 1 1. Introduction 2 2. Catchment description 3 3. Data availability and quality
QualiMET 2.0. The new Quality Control System of Deutscher Wetterdienst
 QualiMET 2.0 The new Quality Control System of Deutscher Wetterdienst Reinhard Spengler Deutscher Wetterdienst Department Observing Networks and Data Quality Assurance of Meteorological Data Michendorfer
Regional Flood Modelling in the New Australian Rainfall and Runoff
 20th International Congress on Modelling and Simulation, Adelaide, Australia, 1 6 December 2013 www.mssanz.org.au/modsim2013 Regional Flood Modelling in the New Australian Rainfall and Runoff A.S. Rahman
The MSC Beaufort Wind and Wave Reanalysis
 The MSC Beaufort Wind and Wave Reanalysis Val Swail Environment Canada Vincent Cardone, Brian Callahan, Mike Ferguson, Dan Gummer and Andrew Cox Oceanweather Inc. Cos Cob, CT, USA Introduction: History
INFLUENCE OF THE AVERAGING PERIOD IN AIR TEMPERATURE MEASUREMENT
 INFLUENCE OF THE AVERAGING PERIOD IN AIR TEMPERATURE MEASUREMENT Hristomir Branzov 1, Valentina Pencheva 2 1 National Institute of Meteorology and Hydrology, Sofia, Bulgaria, Hristomir.Branzov@meteo.bg
Selection of Best Fit Probability Distribution for Flood Frequency Analysis in South West Western Australia
 Abstract Selection of Best Fit Probability Distribution for Flood Frequency Analysis in South West Western Australia Benjamin P 1 and Ataur Rahman 2 1 Student, Western Sydney University, NSW, Australia
London Heathrow Field Site Metadata
 London Heathrow Field Site Metadata Field Site Information Name: Heathrow src_id (Station ID number): 708 Geographic Area: Greater London Latitude (decimal ): 51.479 Longitude (decimal ): -0.449 OS Grid
Impact of climate change on Australian flood risk: A review of recent evidence
 Impact of climate change on Australian flood risk: A review of recent evidence 30/5/2018 FMA Conference, Gold Coast S Westra 1, B Bennett 1, J Evans 2, F Johnson 3, M Leonard 1, A Sharma 3, C Wasko 4,
Andrew M. Lorrey and Petra R. Chappell. Correspondence to: Andrew M. Lorrey
 Supplement of Clim. Past, 12, 3 73, 216 http://www.clim-past.net/12/3/216/ doi:1.194/cp-12-3-216-supplement Author(s) 216. CC Attribution 3. License. Supplement of The dirty weather diaries of Reverend
Comparing rainfall interpolation techniques for small subtropical urban catchments
 Comparing rainfall interpolation techniques for small subtropical urban catchments 1 Y. Knight. 1 B. Yu, 1 G. Jenkins and 2 K. Morris 1 School of Environmental Engineering, Griffith University, Nathan,
Based on Met Éireann Technical Note 61 (Fitzgerald, 2007) Flood Frequency Estimation
 Flood Frequency Estimation") Flood Studies Update Technical Research Report Volume I Denis L Fitzgerald Based on Met Éireann Technical Note 61 (Fitzgerald, 2007) Volume I Volume II Volume III Volume IV Volume V Volume VI Flood Frequency
Flood Studies Update Technical Research Report Volume I Denis L Fitzgerald Based on Met Éireann Technical Note 61 (Fitzgerald, 2007) Volume I Volume II Volume III Volume IV Volume V Volume VI Flood Frequency
CONCEPTUAL AND TECHNICAL CHALLENGES IN DEFINING FLOOD PLANNING AREAS IN URBAN CATCHMENTS
 CONCEPTUAL AND TECHNICAL CHALLENGES IN DEFINING FLOOD PLANNING AREAS IN URBAN CATCHMENTS C Ryan 1, D Tetley 2, C Kinsey 3 1 & 2 Catchment Simulation Solutions, NSW 3 Co-ordinator Stormwater and Structural
Another 100-Year Storm. October 26, 2016 Mark Dennis, PE, CFM
 Another 100-Year Storm October 26, 2016 Mark Dennis, PE, CFM Agenda Are severe rainfall events becoming more frequent? Is there confusion about the 100-year storm that makes it seem like they happen all
OPTIMISING THE TEMPORAL AVERAGING PERIOD OF POINT SURFACE SOLAR RESOURCE MEASUREMENTS FOR CORRELATION WITH AREAL SATELLITE ESTIMATES
 OPTIMISING THE TEMPORAL AVERAGING PERIOD OF POINT SURFACE SOLAR RESOURCE MEASUREMENTS FOR CORRELATION WITH AREAL SATELLITE ESTIMATES Ian Grant Anja Schubert Australian Bureau of Meteorology GPO Box 1289
Implementation of CLIMAP and GIS for Mapping the Climatic Dataset of Northern Iraq
 Implementation of CLIMAP and GIS for Mapping the Climatic Dataset of Northern Iraq Sabah Hussein Ali University of Mosul/Remote sensing Center KEYWORDS: CLIMAP, GIS, DEM, Climatic, IRAQ ABSTRACT The main
Generation of an Annual Typical Meteorological Solar Radiation for Armidale NSWAustralia
 IOSR Journal of Engineering (IOSRJEN) ISSN (e): 2250-3021, ISSN (p): 2278-8719 Vol. 04, Issue 04 (April. 2014), V1 PP 41-45 www.iosrjen.org Generation of an Annual Typical Meteorological Solar Radiation
ANALYSIS OF THE MICROCLIMATE OF SÃO CRISTÓVÃO AND ITS INFLUENCE IN HEATING SYSTEMS, VENTILATING AND AIR CONDITIONING (HVAC)
") ANALYSIS OF THE MICROCLIMATE OF SÃO CRISTÓVÃO AND ITS INFLUENCE IN HEATING SYSTEMS, VENTILATING AND AIR CONDITIONING (HVAC) Monteiro, M.F.M., marcelofmm@gmail.com Bernardes, T.L.P, thamires-bernaredes@hotmail.com
ANALYSIS OF THE MICROCLIMATE OF SÃO CRISTÓVÃO AND ITS INFLUENCE IN HEATING SYSTEMS, VENTILATING AND AIR CONDITIONING (HVAC) Monteiro, M.F.M., marcelofmm@gmail.com Bernardes, T.L.P, thamires-bernaredes@hotmail.com
Regional Flood Frequency Analysis in the Range of Small to Large Floods: Development and Testing of Bayesian Regression-based Approaches
 Regional Flood Frequency Analysis in the Range of Small to Large Floods: Development and Testing of Bayesian Regression-based Approaches Khaled Haddad A thesis submitted for the degree of Doctor of Philosophy
FLOOD FORECAST MAPPING SANS MODELLING
 FLOOD FORECAST MAPPING SANS MODELLING C Smythe 1, G Newell 1, C Druery 2 1 Sunshine Coast Council, Nambour, QLD 2 WorleyParsons, Sydney, NSW Abstract The 2012 Queensland Floods Commission of Inquiry recommendations
MeteoSwiss Spatial Climate Analyses: Documentation of Datasets for Users
 Federal Department of Home Affairs FDHA Federal Office of Meteorology and Climatology MeteoSwiss MeteoSwiss Spatial Climate Analyses: Documentation of Datasets for Users Figure 1: Distribution of the 48-hour
Reliability of Daily and Annual Stochastic Rainfall Data Generated from Different Data Lengths and Data Characteristics
 Reliability of Daily and Annual Stochastic Rainfall Data Generated from Different Data Lengths and Data Characteristics 1 Chiew, F.H.S., 2 R. Srikanthan, 2 A.J. Frost and 1 E.G.I. Payne 1 Department of
Overview of Achievements October 2001 October 2003 Adrian Raftery, P.I. MURI Overview Presentation, 17 October 2003 c 2003 Adrian E.
 MURI Project: Integration and Visualization of Multisource Information for Mesoscale Meteorology: Statistical and Cognitive Approaches to Visualizing Uncertainty, 2001 2006 Overview of Achievements October
BUFR format in a nutshell
 BUFR format in a nutshell Enrico Fucile Enrico.Fucile@ecmwf.int ECMWF February 19, 2018 WMO Binary Codes BUFR (Binary Universal Form for the Representation of meteorological data) is a flexible binary
Gridding of precipitation and air temperature observations in Belgium. Michel Journée Royal Meteorological Institute of Belgium (RMI)
") Gridding of precipitation and air temperature observations in Belgium Michel Journée Royal Meteorological Institute of Belgium (RMI) Gridding of meteorological data A variety of hydrologic, ecological,
Gridding of precipitation and air temperature observations in Belgium Michel Journée Royal Meteorological Institute of Belgium (RMI) Gridding of meteorological data A variety of hydrologic, ecological,
Effect of Storm Separation Time on Rainfall Characteristics-A Case Study of Johor, Malaysia
 European Journal of Scientific Research ISSN 1450-216X Vol.45 No.2 (2010), pp.162-167 EuroJournals Publishing, Inc. 2010 http://www.eurojournals.com/ejsr.htm Effect of Storm Separation Time on Rainfall
JUNE 2004 Flood hydrology of the Waiwhetu Stream
 JUNE 2004 Flood hydrology of the Waiwhetu Stream Laura Watts Resource Investigations Contents 1. Introduction 1 2. Catchment description 2 3. Data availability and quality 3 3.1 Rainfall data 3 3.2 Water
Stochastic Hydrology. a) Data Mining for Evolution of Association Rules for Droughts and Floods in India using Climate Inputs
 Data Mining for Evolution of Association Rules for Droughts and Floods in India using Climate Inputs") Stochastic Hydrology a) Data Mining for Evolution of Association Rules for Droughts and Floods in India using Climate Inputs An accurate prediction of extreme rainfall events can significantly aid in policy
Stochastic Hydrology a) Data Mining for Evolution of Association Rules for Droughts and Floods in India using Climate Inputs An accurate prediction of extreme rainfall events can significantly aid in policy
Regional Rainfall Frequency Analysis By L-Moments Approach For Madina Region, Saudi Arabia
 International Journal of Engineering Research and Development e-issn: 2278-067X, p-issn: 2278-800X, www.ijerd.com Volume 13, Issue 7 (July 2017), PP.39-48 Regional Rainfall Frequency Analysis By L-Moments
REQUIREMENTS FOR WEATHER RADAR DATA. Review of the current and likely future hydrological requirements for Weather Radar data
 WORLD METEOROLOGICAL ORGANIZATION COMMISSION FOR BASIC SYSTEMS OPEN PROGRAMME AREA GROUP ON INTEGRATED OBSERVING SYSTEMS WORKSHOP ON RADAR DATA EXCHANGE EXETER, UK, 24-26 APRIL 2013 CBS/OPAG-IOS/WxR_EXCHANGE/2.3
Hydrol. Regional Earth Syst. precipitation-frequency Sci., 11(1), , analysis 2007 and spatial mapping for 24-hour and 2-hour durations for
, , analysis 2007 and spatial mapping for 24-hour and 2-hour durations for") Hydrol. Regional Earth Syst. precipitation-frequency Sci., 11(1), 415 442, analysis 2007 and spatial mapping for 24-hour and 2-hour durations for Washington State www.hydrol-earth-syst-sci.net/11/415/2007
Hydrol. Regional Earth Syst. precipitation-frequency Sci., 11(1), 415 442, analysis 2007 and spatial mapping for 24-hour and 2-hour durations for Washington State www.hydrol-earth-syst-sci.net/11/415/2007
WINFAP 4 QMED Linking equation
 WINFAP 4 QMED Linking equation WINFAP 4 QMED Linking equation Wallingford HydroSolutions Ltd 2016. All rights reserved. This report has been produced in accordance with the WHS Quality & Environmental
Table of Contents DBCP Buoy Monitoring Statistics... 1
 DBCP Buoy Monitoring Statistics Table of Contents DBCP Buoy Monitoring Statistics... 1 Introduction... 1 Standard format for the buoy monitoring statistics:... 4 Distribution of the statistics:... 4 Standard
INTRODUCTION OF THE RECURSIVE FILTER FUNCTION IN MSG MPEF ENVIRONMENT
 INTRODUCTION OF THE RECURSIVE FILTER FUNCTION IN MSG MPEF ENVIRONMENT Gregory Dew EUMETSAT Abstract EUMETSAT currently uses its own Quality Index (QI) scheme applied to wind vectors derived from the Meteosat-8
Mapping Weather Information
 Charles Sturt University Wagga Wagga 17 October 2013 Mapping Weather Information Robert Dahni Bureau of Meteorology Bureau of Meteorology The Bureau's mission We provide Australians with environmental
Improving Reservoir Management Using the Storm Precipitation Analysis System (SPAS) and NEXRAD Weather Radar
 and NEXRAD Weather Radar") Improving Reservoir Management Using the Storm Precipitation Analysis System (SPAS) and NEXRAD Weather Radar Bill D. Kappel, Applied Weather Associates, LLC, Monument, CO Edward M. Tomlinson, Ph.D., Applied
Improving Reservoir Management Using the Storm Precipitation Analysis System (SPAS) and NEXRAD Weather Radar Bill D. Kappel, Applied Weather Associates, LLC, Monument, CO Edward M. Tomlinson, Ph.D., Applied
Systematic errors and time dependence in rainfall annual maxima statistics in Lombardy
 Systematic errors and time dependence in rainfall annual maxima statistics in Lombardy F. Uboldi (1), A. N. Sulis (2), M. Cislaghi (2), C. Lussana (2,3), and M. Russo (2) (1) consultant, Milano, Italy
Interpolation of Growing Degree-Days in Non-Homogeneous Terrain
 Interpolation of Growing Degree-Days in Non-Homogeneous Terrain Rose Blair 1, B. Blair Fitzharris 2 & Katrina Richards 2 1 Department of Geography University of Otago. Dunedin, New Zealand Phone: +64 3
Statistical Downscaling of General Circulation. Model Outputs to Precipitation Accounting for Non-
 RESEARCH ARTICLE Statistical Downscaling of General Circulation Model Outputs to Precipitation Accounting for Non-Stationarities in Predictor-Predictand Relationships D. A. Sachindra*, B. J. C. Perera
Indices of droughts (SPI & PDSI) over Canada as simulated by a statistical downscaling model: current and future periods
 over Canada as simulated by a statistical downscaling model: current and future periods") Indices of droughts (SPI & PDSI) over Canada as simulated by a statistical downscaling model: current and future periods Philippe Gachon 1, Rabah Aider 1 & Grace Koshida Adaptation & Impacts Research Division,
Indices of droughts (SPI & PDSI) over Canada as simulated by a statistical downscaling model: current and future periods Philippe Gachon 1, Rabah Aider 1 & Grace Koshida Adaptation & Impacts Research Division,
Regionalization Approach for Extreme Flood Analysis Using L-moments
 J. Agr. Sci. Tech. (0) Vol. 3: 83-96 Regionalization Approach for Extreme Flood Analysis Using L-moments H. Malekinezhad, H. P. Nachtnebel, and A. Klik 3 ABSTRACT Flood frequency analysis is faced with
Weather observations from Tórshavn, The Faroe Islands
 Weather observations from Tórshavn, The Faroe Islands 1953-2014 - Observation data with description John Cappelen Copenhagen 2015 http://www.dmi.dk/fileadmin/rapporter/tr/tr15-09 page 1 of 14 Colophon
New rainfall and climate quality control systems used for land surface observation
 New rainfall and climate quality control systems used for land surface observation Monday, 30 October 2017 Clément Hutin - Climate Database Developer clement.hutin@metoffice.gov.uk Overview I. Importance
Regional Rainfall Frequency Analysis for the Luanhe Basin by Using L-moments and Cluster Techniques
 Available online at www.sciencedirect.com APCBEE Procedia 1 (2012 ) 126 135 ICESD 2012: 5-7 January 2012, Hong Kong Regional Rainfall Frequency Analysis for the Luanhe Basin by Using L-moments and Cluster
YOPP archive: needs of the verification community
 YOPP archive: needs of the verification community B. Casati, B. Brown, T. Haiden, C. Coelho Talk Outline: P1 model and observation data P2 observation uncertainty P2 matched model and observation: time
Prediction of Snow Water Equivalent in the Snake River Basin
 Hobbs et al. Seasonal Forecasting 1 Jon Hobbs Steve Guimond Nate Snook Meteorology 455 Seasonal Forecasting Prediction of Snow Water Equivalent in the Snake River Basin Abstract Mountainous regions of